
Organizations that are starting with BPM often have hundreds of process diagrams, but they lack the information about how those processes are related and struggle with providing a high-level overview of the processes.
If you had a chance to read articles from Roland about the Business Architecture and End-to-End processes, you already know that the process architecture offers you several levels of description and allows drill down for more details.
In this mini-series I wanted to share with you what I often see in practice while helping customers that use BOC Group’s BPM tool ADONIS to document and manage their processes.
Let’s begin from the top level of the architecture. There I usually see models containing a few dozen chevrons representing the top level processes (also called process groups, mega processes, …). They are often organized into categories like management processes, core processes, and support processes. Since this model is frequently a starting point for the readers of the process documentation there are also branding elements like logotype of the organization, nice looking graphics etc.
You can see below one of the example models for the ADOMoney Bank. As you may guess from the name this is fictional organization, which BOC Group uses in a demo scenario for ADONIS. If you want to see it in more detail, you can use the free ADONIS Community Edition account.
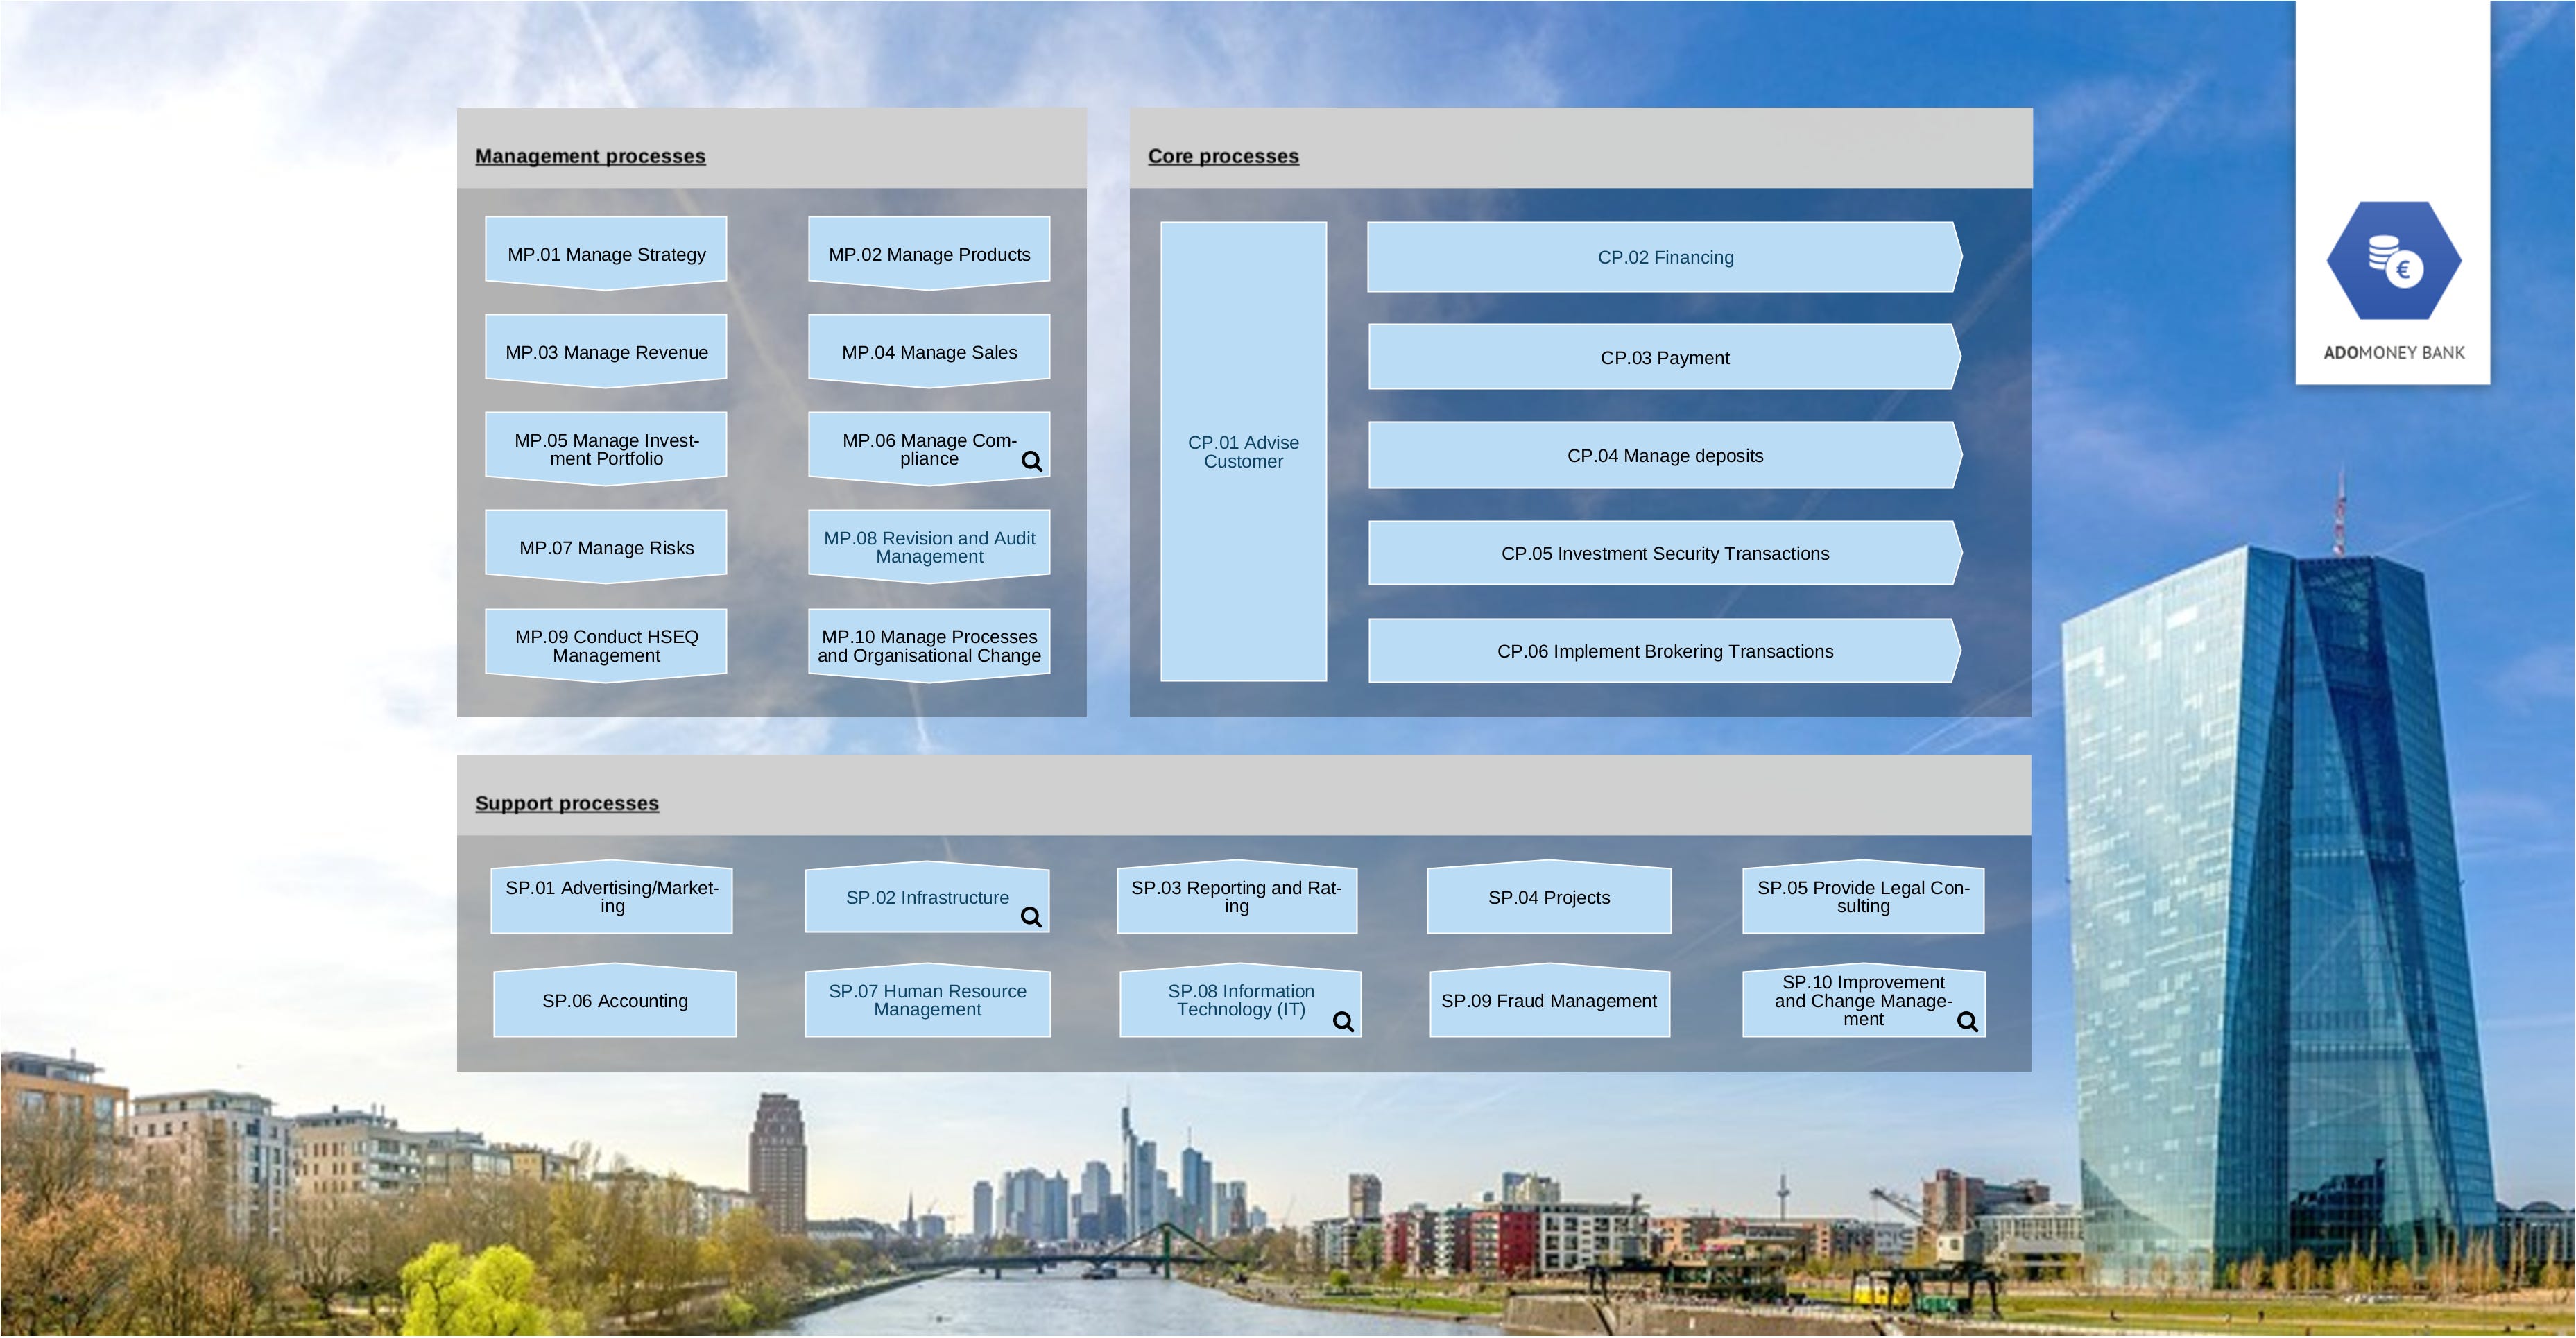
Each of those process objects is more than just a nice looking shape. One of their uses is to provide easy navigation (drill down) to the lower levels of the architecture. You can see for example that the CP.02 Financing process in the top right part of the model has a blue name, which suggests it is a hyperlink. By clicking it, you could easily navigate to a model showing what happens inside this process. You can see the example below.
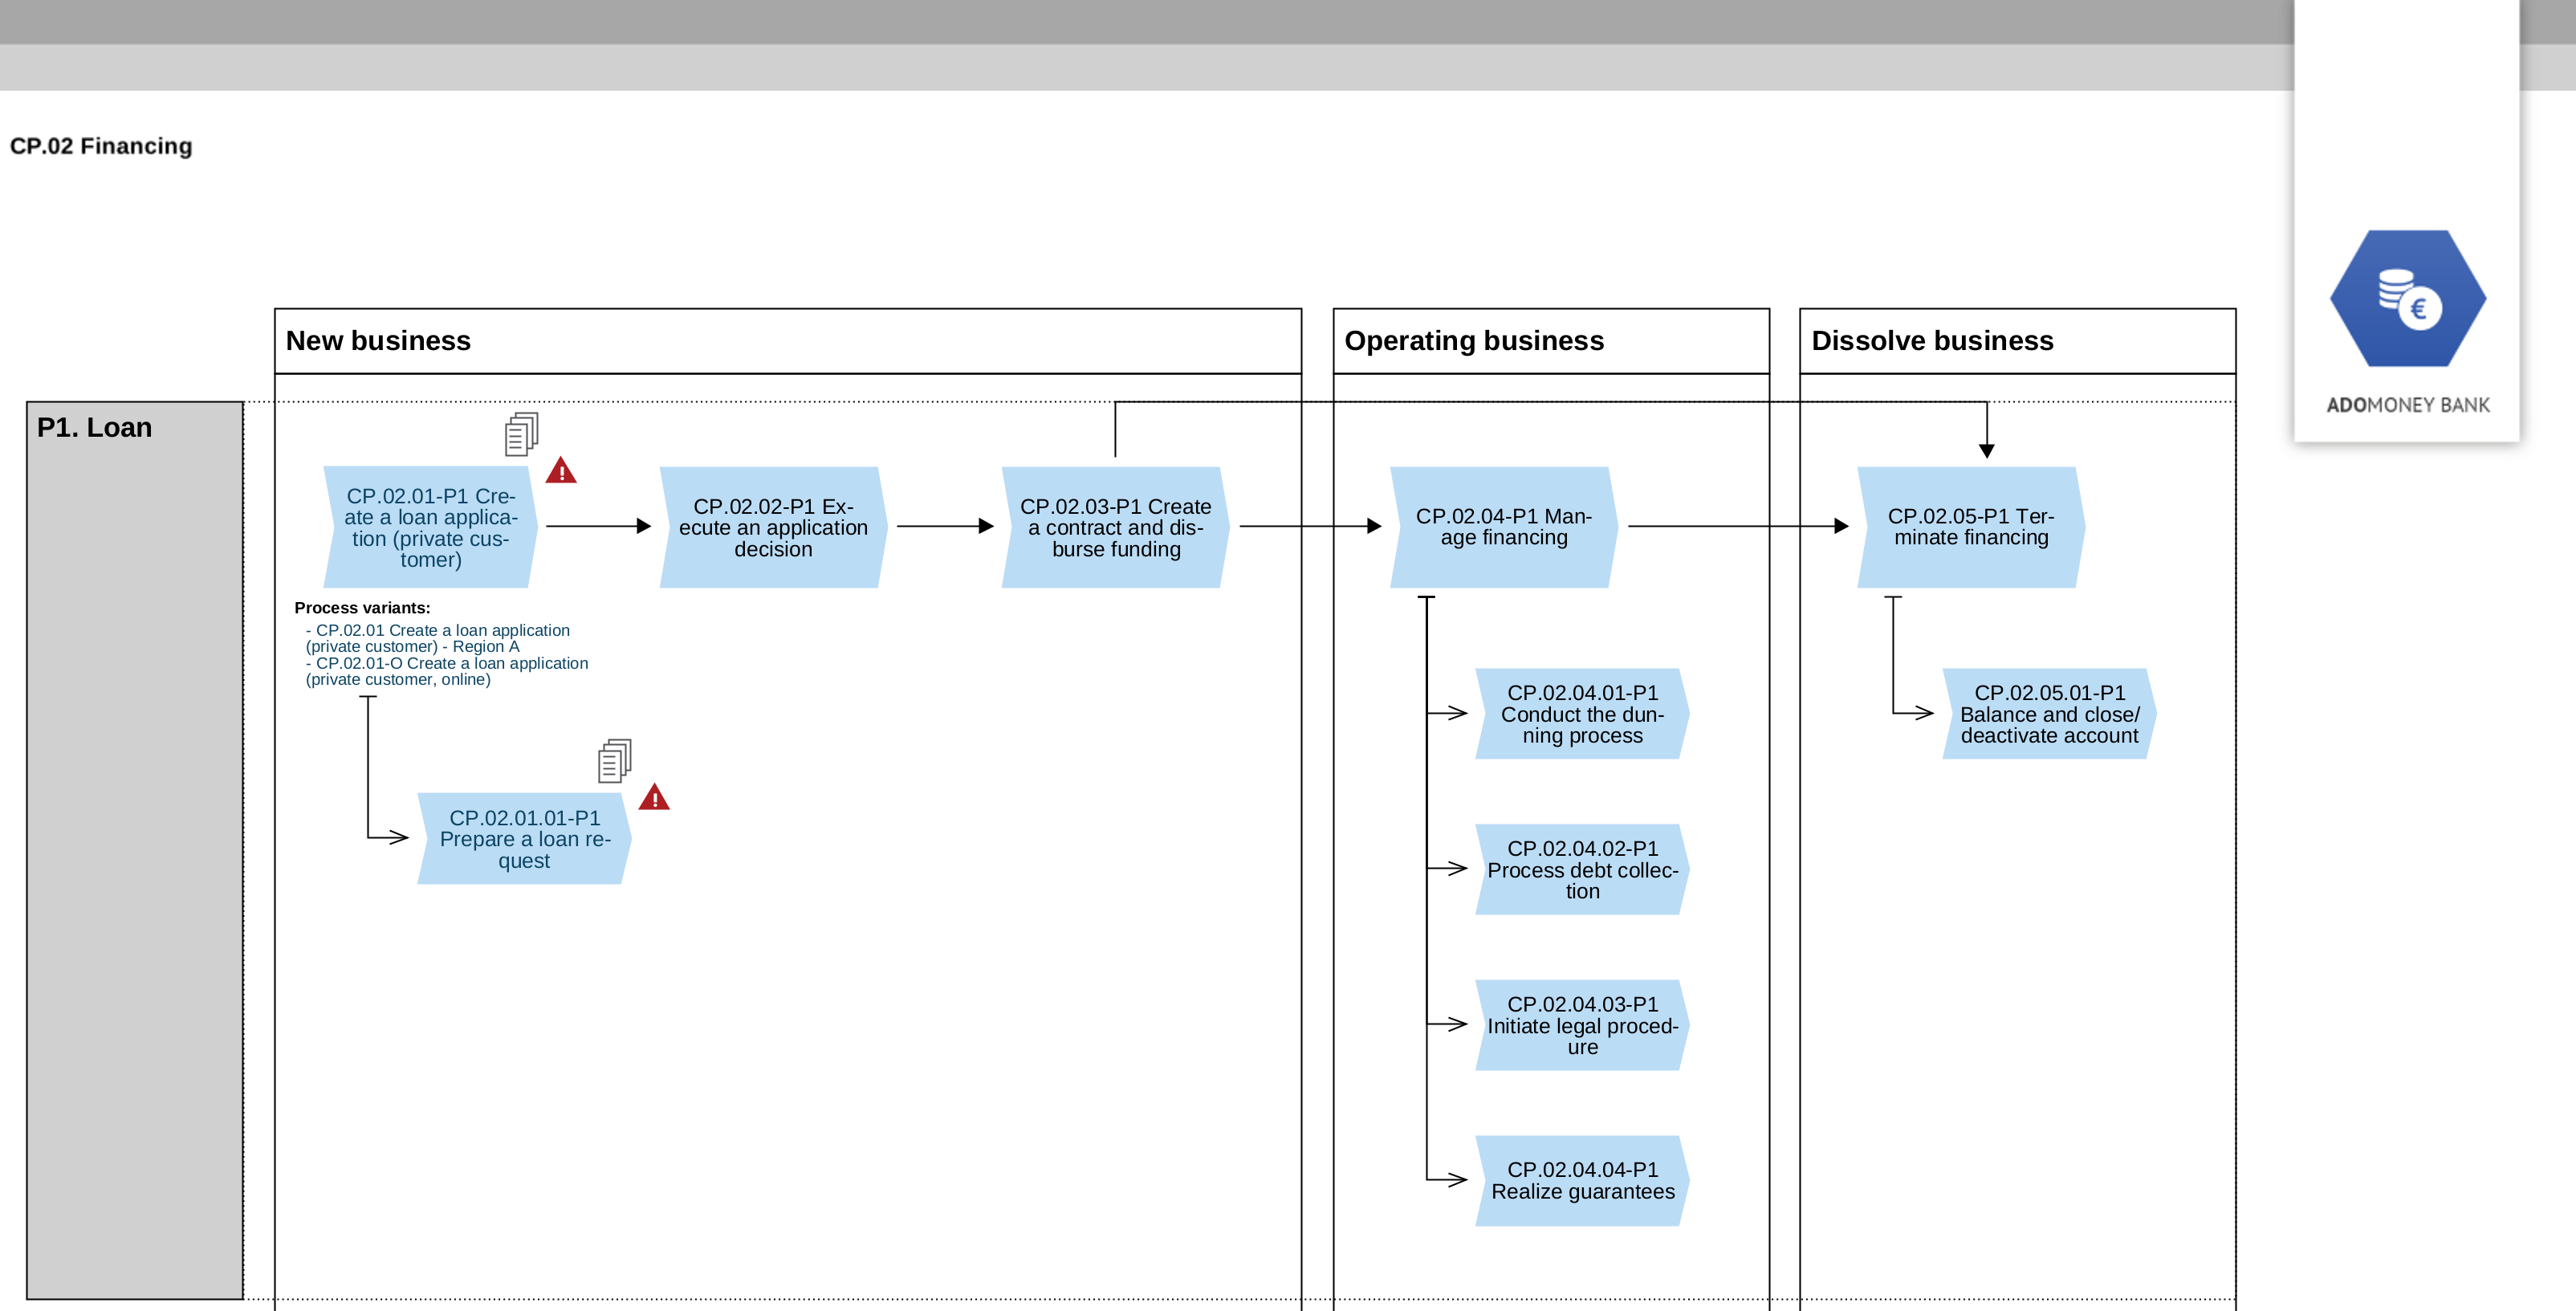
As you know from Roland’s articles there are several ways to show the process architecture. What I frequently see is that customers have several levels of models below the overview of the process architecture.
They can show the value stream view like in the example above or simply show parent-child decomposition to more detailed processes. Usually the End to End process views are seen for the core processes, because for management and support processes it may not always be so easy to create something helpful (for example - you can of course have the HR-related processes arranged with the Hire to Retire approach but often there will be a lot of not so clearly related processes in the middle).
Lower level models can represent several levels of processes and visualize not only the parent-child relations, but also e.g. value stream view. As you can see in the example above: Process CP 02.04-P1 Manage Financing has its children (CP 02.04.01-P1 and so on), but also it is clear that it is followed by the CP 02.05-P1 Terminate financing.
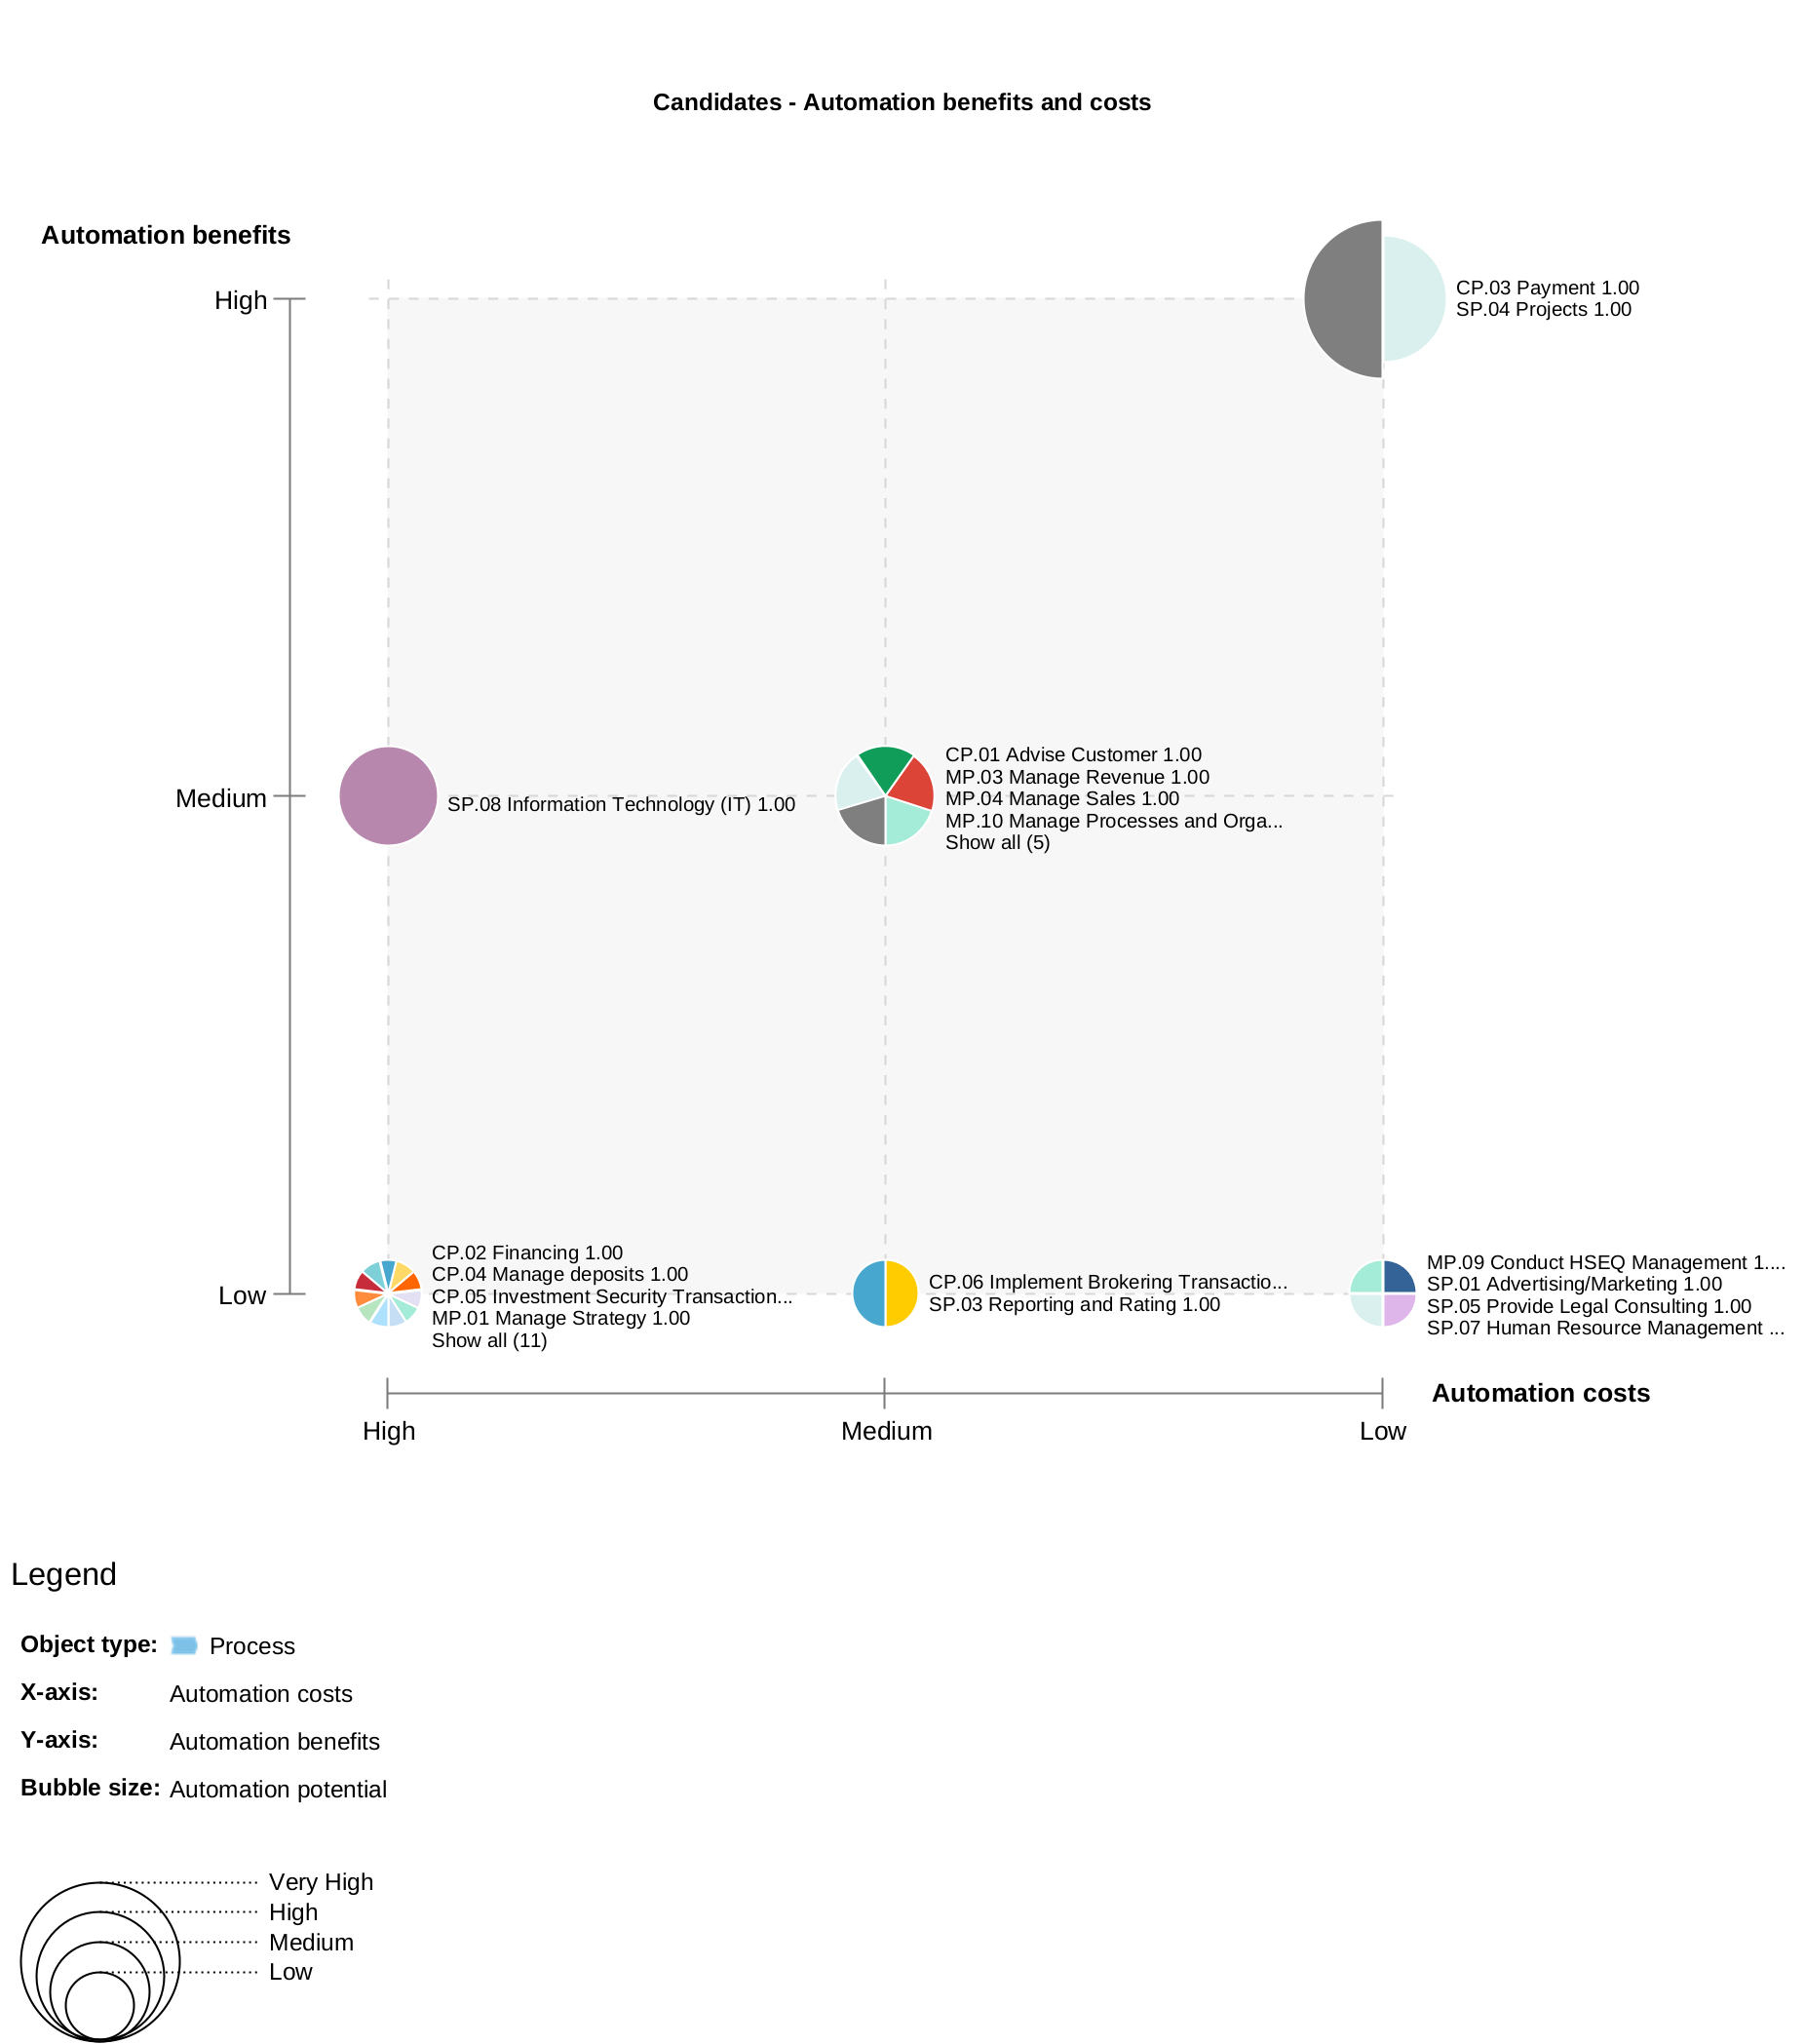
And this is just a tip of the iceberg, because a good process architecture allows you to store much more information that can be used for documentation, analysis and improvement. You can see one example of such analysis below - on a basis of process assessment for the automation costs and benefits you can easily create a view that suggests which processes are better suited for your automation/AI initiative than others.
Of course, useful process architecture should also help you navigate to the detailed process diagrams such as the one below. But it is important to note that not every Process chevron shape needs to link to the BPMN diagram - especially at first, because in many situations it will be sufficient to document some basic process properties without the need to create a detailed process diagram.

In the second part of the series we will see how to build the process architecture step by step, this time using the Heartbeat example from Roland’s books.
No posts
Comments
Nothing yet. Say the first thing.
Sign in to join the conversation.