
This article shares lessons from our experience building and maintaining a 3D fencing system designed to protect entire tree-planting sites on farms and other landscapes. This is a longer read but for those interested in landscape scale tree planting - we feel it is well worth the information we gleaned from this project.
For the past fifteen years at Wellspring Forest Farm, we’ve planted hundreds of trees, using a range of deer-deterrent strategies. Everything from tall and electric fencing to tree tubes, cages, and dogs, each with its own strengths and limitations.
Since installing a 3D deer fence in spring 2023, we’ve lived with the system for three full seasons. Here, we share why this type of fence is built, how it is designed and installed, the tradeoffs to consider, and a simple, step-by-step guide for those who may want to try this approach themselves.
Our appreciation to NE-SARE and funding for projects FNE22-010 and LNE23-466, which enabled us to spend the time and materials exploring this possibility we think has broad application to many agroforestry and tree planting systems.
This material is based upon work supported by the National Institute of Food and Agriculture, U.S. Department of Agriculture, through the Northeast Sustainable Agriculture Research and Education program under subaward number FNE22-010.
Originally within the context of grant FNE22-010 “Establishing Willow and Poplar Tree Fodder Blocks for Resilient Livestock Feed and Flood Mitigation in a Silvopasture Riparian Buffer“, we were going to compare the efficacy of multiple fencing options around relatively small plots (20’ x 40’) to compare cost and function, including:
8 foot T posts installed every 10 feet and three lines of non-electrified strand strung with flagging draped every three feet as a deterrent.
A “3D” fence system
Premier One’s 19/68/2 Anti-Deer netting installed and electrified.
The general idea when the project was conceived was to develop something that could be modular and move when trees reached a safe height to resist herbivore browse. But, as we began implementing the grant, we realized two main issues with this approach:
1) By isolating three spaces that were in close proximity to each other, we were unnecessarily increasing the cost and still creating a lot of room for deer to come close to plantings, which increased the risk of damage
2) We had numerous tree planting projects going on simultaneously, from NRCS Conservation Stewardship Program (CSP) to our own plantings for silvopasture and nursery stock (see table). It was clear we needed a larger overall strategy to more effectively address the larger site needs versus isolated plantings and protection strategies.
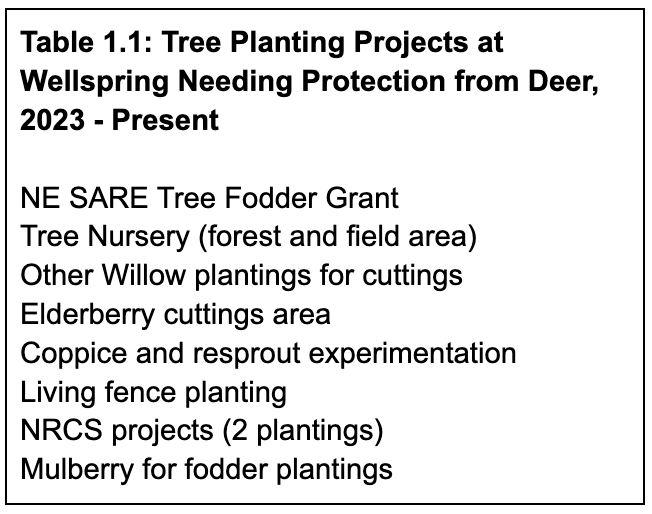
A big “aha!” moment came when we talked to perhaps our most important asset on this aspect of the project; our neighbor Dominic, who hunts our land and has gotten to know the character and movements of the deer across our landscape. It became clear that there were some established deer movement patterns that we could work with to encourage the deer to “stay the natural course” with the 3D fence, rather than force something outside their natural propensity to move. In addition to discussions and observation of deer patterns, we had observed that since our sweet dogs died of old age in 2020 and 2022, more and more deer were cutting up and across the field from the northwest corner, often decimating young trees in their path. For years prior, with dogs as trusty deterrents, we’d mostly been getting away with basic tree tubes, though some trees did suffer; tasty chestnuts were stunted from years of bud nibbling, and others showed signs of repeated damage.
Google Earth proved to be a valuable tool to complement these discussions, where we could zoom out and infer where deer were interested in traveling, which is generally from the Northwest, diagonally across the land, along the forested edges that bordered open fields (Figure 1.1). When comparing this to the area we had or wanted to keep planting trees (red circle), it was clear that a reasonable attempt would be to create a 3D fence that would encourage deer to stay along the Southwest edge of the land (also along a stream corridor) and go around the planting, as well as keep them moving to the East of the planting area, which they were already doing to some degree given the large 3 area pond and multiple dwellings of our neighbors that encouraged this movement.
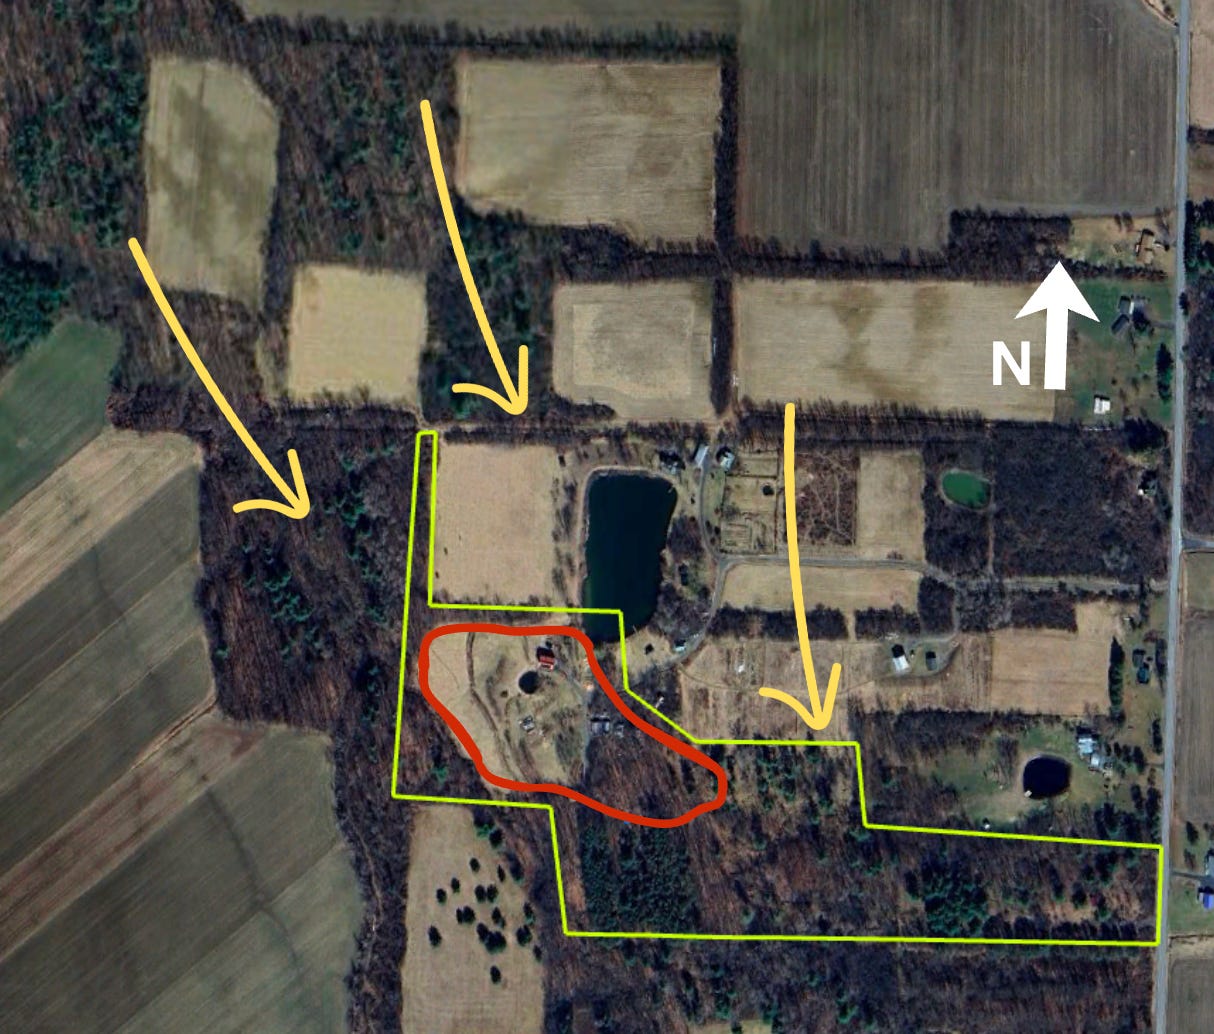
Figure 1.1: Deer patterns towards Wellspring Forest Farm. Arrows indicate major flows, while the red area is the main space we are actively tree planting on a range of scales.
After observing 3D fences at a Virginia Tech Agroforestry demonstration farm and various vegetable and flower farms, we heard positive reports on their effectiveness. Consequently, we shifted our strategy to invest in a perimeter fence. This approach protects nearly 7.5 acres of planting space, whereas our original plan for smaller plots would have enclosed less than 1/16 of an acre.
The fundamental idea of a 3D fence is to create a mental barrier that confuses deer and makes them unsure if they can jump over the barrier. The 3D system contains two parallel fences, spaced 3 feet apart. In the first fence, there are two electrified strands with one strand set at 48” (high/top position) and the second set at 18 inches (low/bottom position). The second fence, running parallel and spaced 3 feet away, has one electrified strand that is 24” feet off the ground (medium position). This spaced out and stratified 3-strand geometry can confuse a deer’s depth perception and makes them believe that they cannot jump over the fence.
deer psychology (depth confusion) All strands on the 3D fence are electrified, and often it is recommended to scent bait them for 2 months after installation to “train” the deer to them. The 3D fence is a deterrent only if it’s kept intact, at a high voltage, and assessed for possible vulnerabilities on a routine basis.
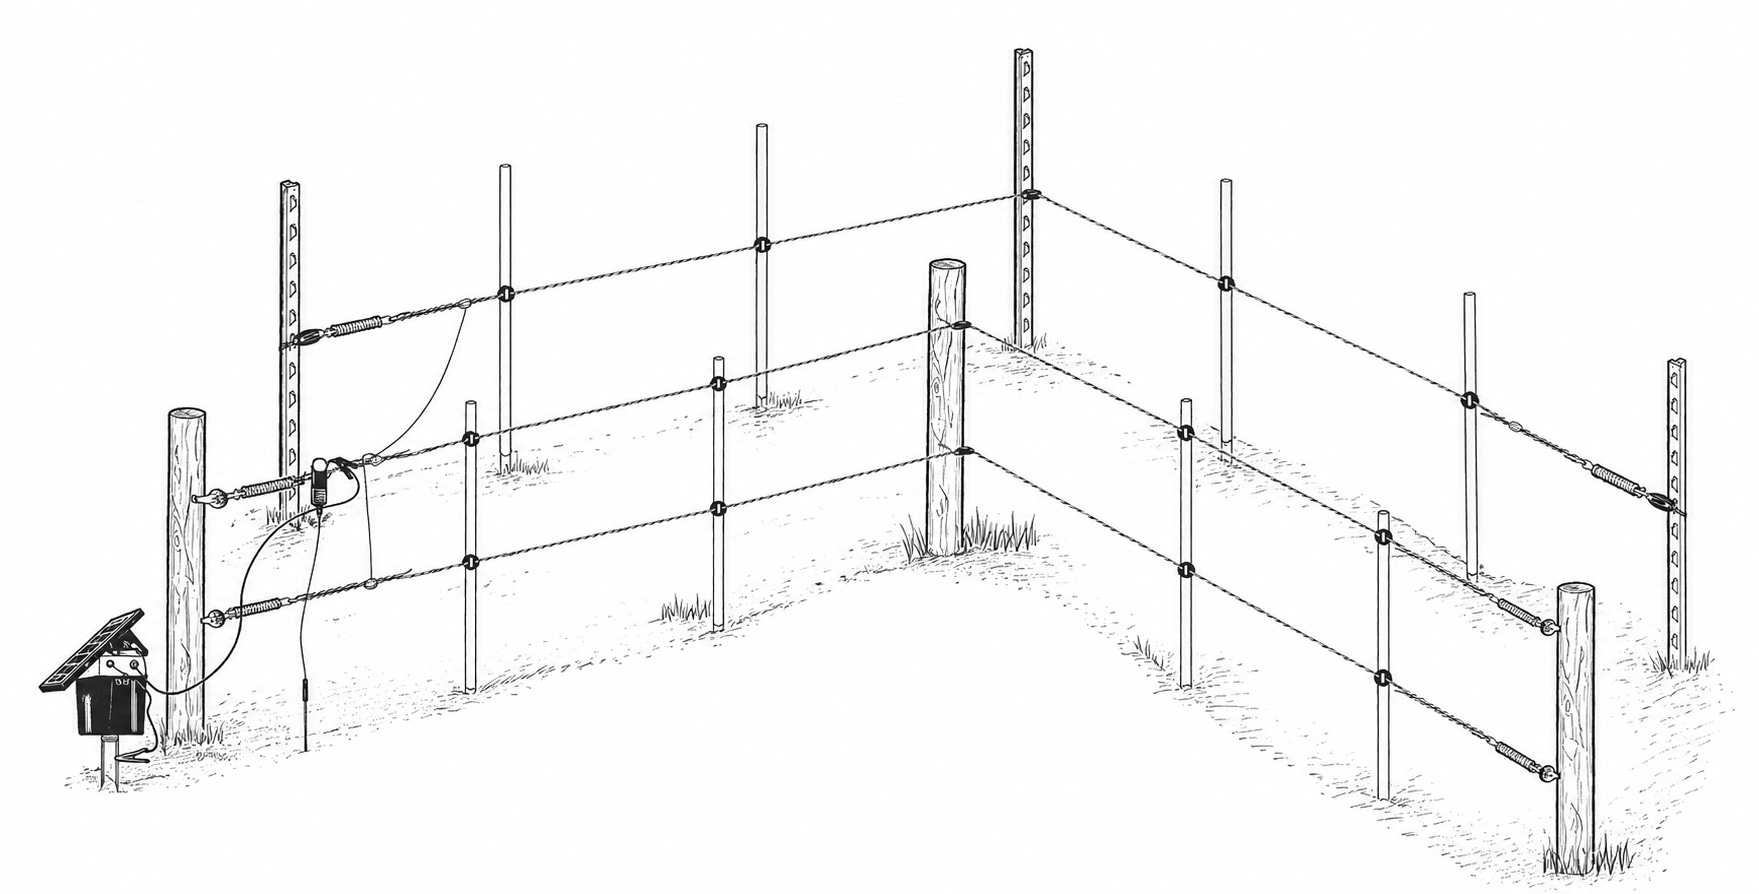
Figure 1.2: Diagram of 3D Fence, adapted from image courtesy of Premier One Supply
Our initial plan included considerations about the practicalities of moving around and through the fence, access for maintenance (mostly weed-whacking or mowing), and where gates would be most useful. We also had existing infrastructure: a permanent fence system in the woods that served as our winter paddock for the sheep that was fully electrified.
We knew the deer moved through the paddocks but we were less concerned with them coming into the main area we wanted protection from. Because of that, we designed two extensions of 3D fence to push deer toward the edges of the farm. This final fence totaled about 2,048 feet and utilized 279 feet of the existing woodland fence (of the 1,307 feet it encompasses).
As shown in Figure 1.3, this plan resulted in two “spurs” (white lines from the “hub” / main permanent fence which are shown as the orange line), which proved very useful when troubleshooting the fence in subsequent seasons. The two spurs are as follows:
(1) An extension to the west and northeast, funneling deer to keep to the far side of the creek and blocking hedgerow access to our fields.
(2) An extension to the east and wrapping around the maple woods. We added an extension in 2024 (an additional 416 feet) that encircled the fodder block plantings after noticing a breach where deer clearly took a diagonal path across and nibbled on a patch of willow that was not part of the study. The additional fencing, along with dropping a few trees in the open zone where jumping was obviously easy, resulted in no further notable damage.
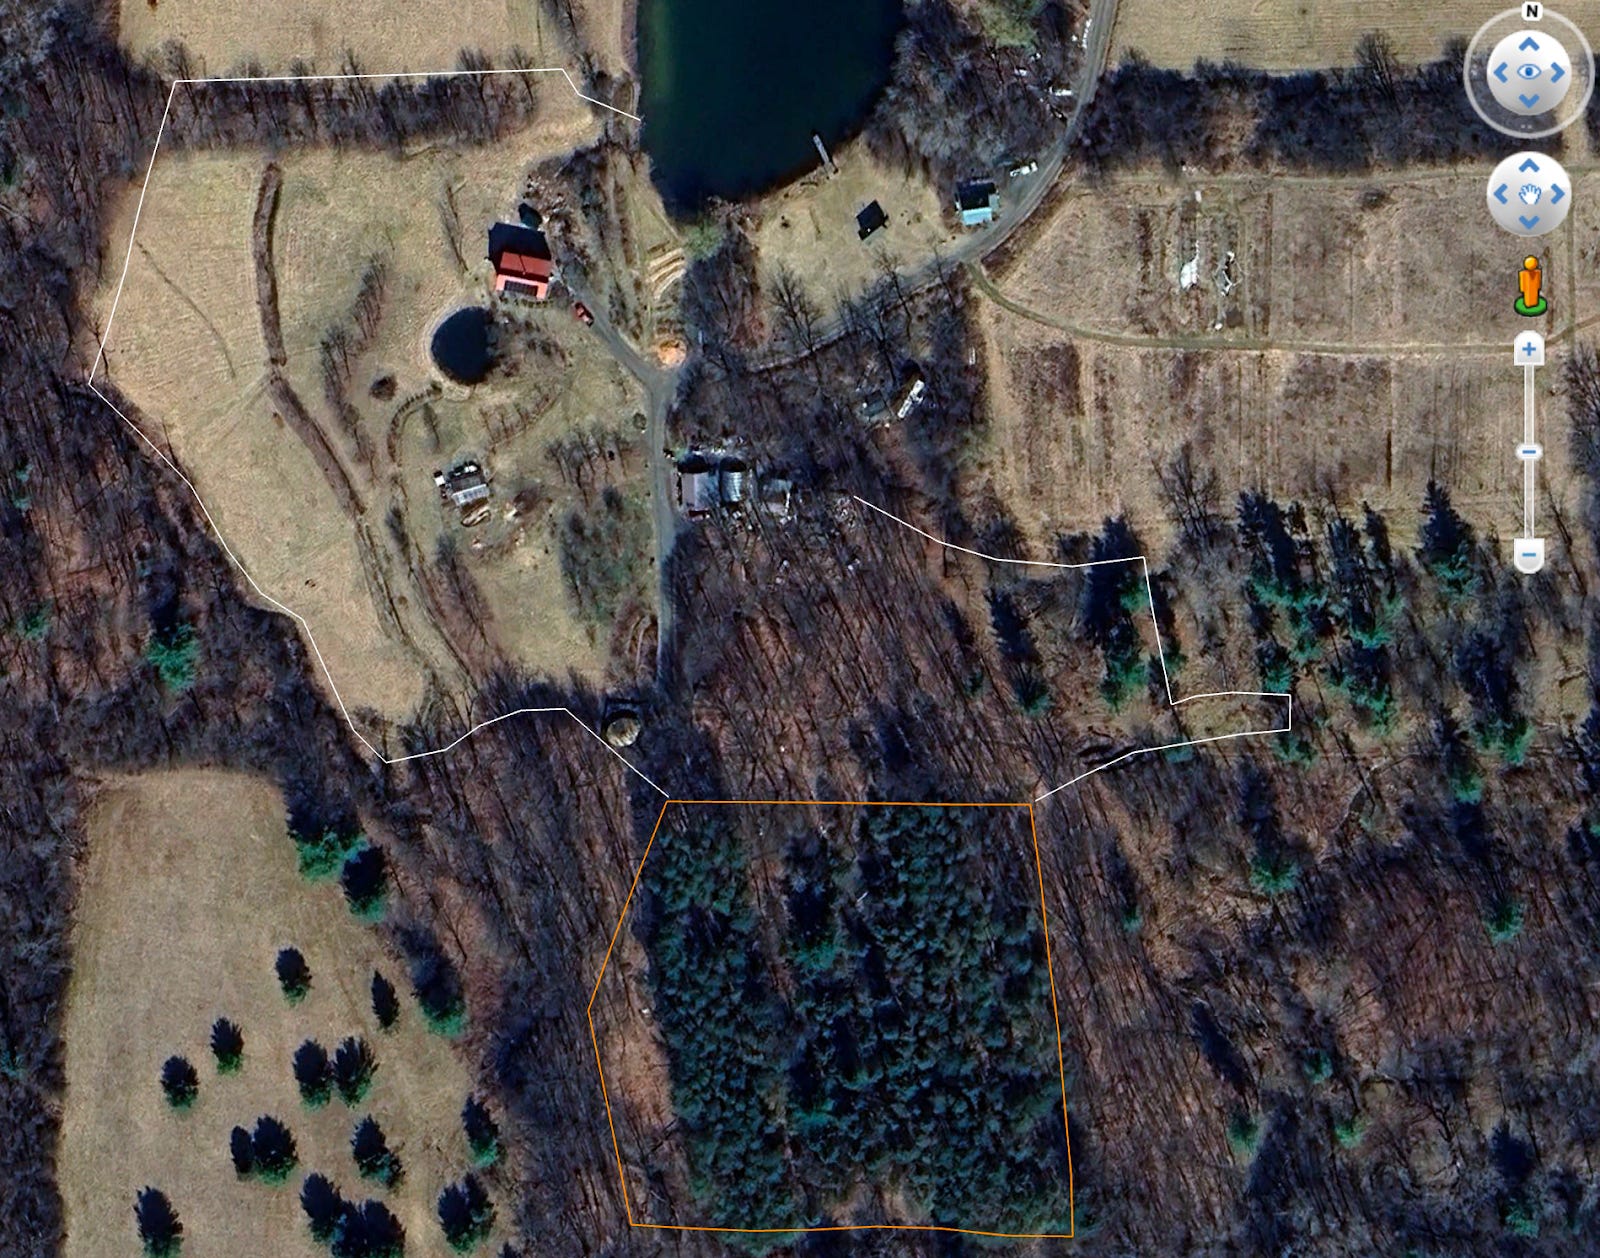
Figure 1.3: White lines depicting the 3D fence installed, tied into existing winter paddock fence (in orange) for continuity and use of the power
For materials, we followed the basic specs laid out by Premier One for a deer fence, except that instead of wooden posts, we used metal T-posts. We also found that some of the tensioning devices were less necessary. Our favorite item was their rope connectors, which are expensive but well worth it as they made maintenance and tensioning very easy. This definitely saved a significant amount of time throughout construction and ongoing maintenance.
In general, to get a 3D fence up and running you need:
Fiberglass rods and insulators
Rope and insulators
Rope connectors
T-posts and hardware (“Slip-Over T-Post Activator”)
A significant cost can be the energizer. An energizer is the main power hub that sends electrical power to the fence. If you already have one, you might not need to buy another.
Regarding the scent caps and “juice,” we didn’t find them particularly necessary or effective, though admittedly we didn’t do a great job of replenishing the scent as directed. Their intended purpose was to attract, scent bait, and train the deer to the fence’s current.
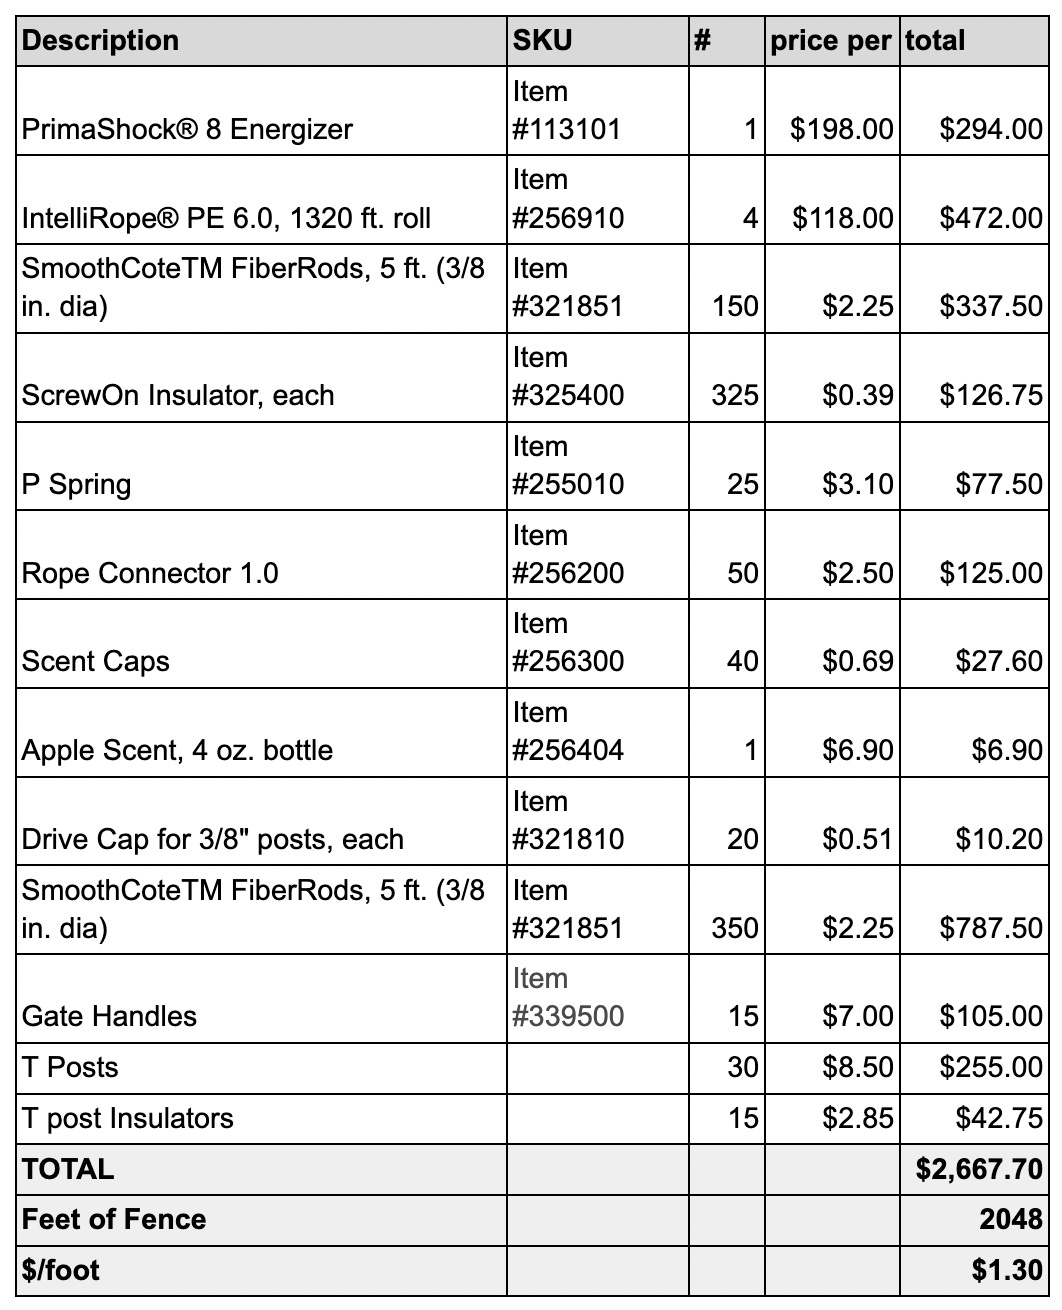
As shown in Table 1.2 below, the materials added up to roughly $1.30 per linear foot.
The most time-consuming part of the project—and one that’s easy to underestimate—was clearing and preparing the fence line. We learned quickly that a 3D fence is only as good as its ability to stay hot, visible, and free of grounding vegetation.
We started by mowing and weed-whacking a 4–6 foot wide path along the entire planned perimeter. In wooded or shrubby areas, this meant removing saplings, blackberry, multiflora rose, and low branches. In open areas, we brush hogged the grass as low as practical. Taking the time to do this thoroughly at the beginning paid off significantly later in reduced maintenance and fewer voltage drops.
Where the fence crossed uneven terrain, dips, or wet areas, we took extra care to identify spots that might require closer post spacing or later adjustment.
We installed T-posts first, using them primarily for corners, gates, and longer straight runs where added rigidity was helpful. Fiberglass posts were then added between T-posts at closer spacing, especially on the inner fence.
Typical spacing:
T-posts: roughly always at corners and gates
Fiberglass posts: every 10 feet on the inner fence, slightly wider spacing on the outer fence and offset to split the difference of the first run.
Corners were one of the most important design considerations. We took time to make corners clean and well-anchored, as loose or sagging corners quickly reduce the psychological barrier the fence is meant to create.
The inner fence went up first. This consisted of two electrified strands:
A lower strand roughly 12 inches off the ground
A top strand at approximately 48 inches
We attached insulators to posts before running rope, which sped things up considerably. The metal rope connectors were especially helpful at gates, corners, and anywhere we anticipated needing to adjust tension over time.
Once the inner fence was complete, we measured out approximately 3 feet and installed the outer fence line. This fence consisted of a single electrified strand at roughly 18 - 24 inches high, splitting the difference of the inner fence. Maintaining consistent spacing between the inner and outer fences was important, as uneven distances seemed to create spots where deer were more willing to test a jump.
In several places, especially near natural deer travel corridors, we erred on the side of slightly wider spacing (closer to 4 feet) to increase the sense of depth and uncertainty.
Gates were installed where we regularly needed access for mowing, planting, and moving equipment. We kept gates as simple as possible, using insulated gate handles and making sure they were easy to re-hook securely onto special insulators made for T-posts with eye hooks for easy attachment. A poorly latched gate is one of the fastest ways to compromise an otherwise solid fence. We found it helpful to mark gates clearly and keep vegetation trimmed extra well around them, as these areas tend to attract both human and animal pressure.
We connected the fence to the existing energizer system, though we did upgrade the unit to generate a higher pulse, since we were increasing the demand, ensuring it had adequate joule output for the total fence length. Proper grounding was critical. We installed multiple ground rods spaced several feet apart in moist soil and periodically checked connections.
For the first several weeks, we monitored the fence closely, checking voltage frequently and walking the perimeter every few days. This was the period when deer were most likely to test the fence. Even without scent baiting, the initial few contacts appeared to be enough to change deer movement patterns noticeably. After the first season, deer pressure inside the protected area dropped dramatically, and we observed clear changes in travel routes around the perimeter, confirmed by our resident hunter.
Our primary goal for managing the fence is to keep the voltage high enough to deter deer from trying to jump over or enter. Fence performance, measured in voltage levels (kV), depends on active upkeep. This is especially important during the dormant winter season when food is less abundant
A core part of the fence maintenance involves measuring and tracking the fence’s voltage levels. While a high score doesn’t necessarily indicate that no maintenance is needed, it can help determine if it is needed to prioritize deeper fence maintenance at any given time. Even if you are reading a high score, there is still a possibility that deferred maintenance items could fail and compromise the entire voltage in the fence.
There are two ways to get a reading on the fence. The first is on the main energizer which will show the power going out to the fence. Make sure the fence is on and look at the energizer to view the score.
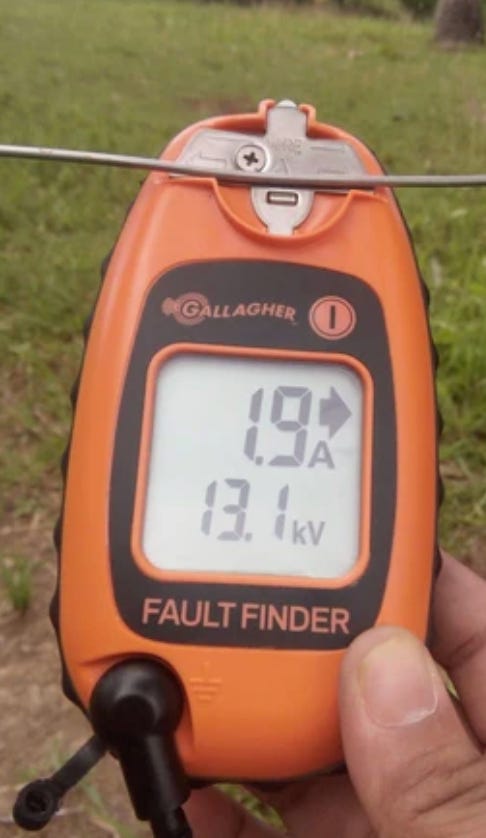
The second is on individual lines on the fence which will require a reader. We like to use the Gallagher Fence Volt / Current Meter and Fault Finder. While this reader is a bit more expensive, it is helpful because it includes a live arrow during the reading to help you identify where there might be a “fault” in the line. A fault is a location in the fence where electricity is leaking out and lowering the fence’s voltage.
To use the reader, plug the test wire into the tester and then insert the grounding rod into the soil. Once the rod is in the soil then you place the hot wire at the top of the tester on the top. Be sure to test each wire as the voltage flow to them each could be different. After measuring, we found it was good practice to note the scores on a spreadsheet.
Since the system contained three fences tied together and fed by the same energy source, this allowed us to isolate various parts of the system to determine where a fault might be. For example, when trying to determine what is bringing down a score, it is helpful to disconnect 1 or 2 of the other fence lines to see if one of those fences is bringing down the total scores. If you think that there may be a fault on the lower fence, you can disconnect the lower fence from The Hub and then measure the voltage again. If the voltage of the main fence increases, then that is indicating that there is a problem in the lower fence.
Fence readings are shown in kilovolts (kV). Our goal is to keep the kV above at least 8, with the following thresholds:
Below 7kV: The fence is nearly ineffective and prompt action is needed.
Between 7kV and 8kV: Shocking power is low and action is needed
8kV: Serviceable for the moment but action is needed
Between 9kV or 10kV: Solid score but there still may be minor items bringing down the score
Above 10kV: Excellent!
It’s important to know that a single grounding point, like one broken rebar or t-post insulator can ground out the entire system and make the whole fence ineffective. Metal touching metal or a whole line on the ground can drastically lower your score, often to a 4 - 5 kV reading.
Other possible and common reasons for poor readings that can ground out a line include:
Vegetation growing up and touching fence lines
Fallen trees and branches on ropes or wires
Fiber glass stakes that shift and need repositioning. This is important to check after big rain events, windy storms, or freeze/thaw events
Missing connectors, damaged or cracked insulators
Lines grounding out on rebar or metal staples
Sagging lines that need to be tightened
Loose fittings, especially at gates
The primary power source is not correctly feeding the energizer
The rope is touching a tree or ground
The current coming from the main fence is not high to begin with
From April 1st to November 15th: Total time spent 40-50 hours
Average hours a week: 1-1.5
Weekly Voltage Measuring
Time Estimate: 20 minutes
This involves looking at the main energizer voltage reading as well as measuring specific lines in various points in the fence. To get a true reading of a particular fence’s line, it can be helpful to detach the other fences from the main fence. As discussed above, this allows you to see which parts might be lowering the score. For example, when measuring the voltage of the upper spur line that’s connected to The Hub, it was often helpful to disconnect the lower fence before measuring.
Bi-weekly perimeter walk + flagging
Time Estimate: 60 minutes
This involves walking the entire fence system to observe what is actually happening on the ground. First turn off the energizer so you don’t get shocked.
The swiftness of the perimeter walk and attention to all details and connection points will depend on the voltage score you are currently seeing.
If your fence score reading is above 9kV, you can walk fairly quickly to observe and mark any potential or active maintenance items. In this scenario, you may be checking for fallen trees, minor overgrown vegetation, or fiber glass stakes that are loose. This type of perimeter walk is more so about making sure nothing is about to fail. A common example of this is a large tree that has died but has yet to actually fall to the ground. Be sure to bring some sort of marking/flagging material like tape or flags to mark any area that needs minor maintenance or where potential future events may cause a larger grounding out. By marking these points, you have identified areas to continue to monitor or fix at a later date.
If your fence reading is below 8kV, you are instead walking with a greater attention to each detail to try and diagnose where a larger fault is occuring. In this scenario, it can be helpful to first have the fence on and use a reader with a “fault finder” feature that can help you locate where a fault might be. As noted above, metal touching metal is one of the most common reasons a voltage score is drastically lowered.
Seasonal Tune Up
Time Estimate: 5 hours, 2-3 times per year
During this larger tune up, this is the opportunity to fix deferred maintenance areas and potential future issues that have been previously identified. Important times to complete large scale tune ups are right before winter, right after winter, and late spring / early summer where grass and vegetative growth is in full swing.
During large scale tune ups, we checked every stake to make sure it was secure and pounded back into the ground if that was needed. This is also the time to mow or weed whack vegetation that is creeping up and touching the fence lines. When pounding a fiberglass stake in with a mallet, be sure to place a “drive cap” on the top of the stake to make sure you don’t damage the stake itself.
The Post Winter Tune Up Process
Tools Needed: Bucket for storing materials, insulators, drive cap, rubber mallet, philips head screwdriver, bright colored tagging material, extra gate handles, silver clips for weaving and tightening rope, handheld electric current tester
Prepare a bucket with all your supplies
Check the current for a baseline reading by grounding the probe into the ground and touching the other piece to the fence
Turn off the system (for us this was done by toggling the up arrow until the black circle outline was completely open)
Walk the alley way of the fence (the space between the two lines)
Goal: Make sure the lines are all tight, parallel, and the geometry stays consistent (3 feet between two fences with one fences having a high and low line and the other fence having a medium height line)
If the stakes aren’t stable, push them back in the ground with your hands
If they need a new hole, place the driver cap on top of the stake and pound the stake with the rubber mallet
About 10 pounds should be sufficient. You will be able to feel when the stake is not going any deeper.
**Don’t pound too hard because the stakes are fiberglass and could break
Check the insulator clips and make sure they are tight by turning the knob to the right
Remove any branches or anything that is touching the lines
Ensure the lines are not touching any trees
Every 5-10 posts look back to see the bigger picture and fence structure to ensure it looks good and is geometrically balanced
Test and tighten the rope with your screwdriver when you reach a node with the silver clips
If any area is of concern, place a bright colored flag to identify issues for future problem solving
Test the current again through various field readings and at the energizer
Record the updated voltage scores
Re-arm the system
Revisit flagged areas over the coming weeks to make larger adjustments or monitor to see if anything else has failed or has been compromised
On Vegetation Management
We found that weed whacking was important to do just after the spring flush, sometime around late May or early June when the grass was still relatively tender. This helped control vegetation for a few months. One clump of grass or a small tree branch is unlikely to impact your score but dozens of feet of grass encroaching and enveloping your line will most certainly lower your voltage. Waiting a few extra weeks to manage vegetation proved to make the whole system much more labor intensive to manage, as the grasses hardened off with lignins. Timing really matters so it’s better to get out ahead of it during the spring flush.
After the main growth of the summer, it was then time to manage vegetation again. For this management session, we often chose to use a tractor with a brush hog attachment. This allowed us to cover more ground and stop extra “weedy” plants from going to seed - especially problematic plants like thistles and cow parsnip. This is especially important as it will help reduce maintenance needs in future years.
It is important to note that mowing will involve removing the rope strands to gain access, which involves unhooking the insulators, rolling up the lines, and then unrolling and reattaching them after mowing was complete. It also means a lot of back and forth on the tractor to weave in and out of the stakes. While mowing is more time intensive than using a weed whacker because of this extra step of removing and then reassembling the fence, it was very helpful in knocking back a majority of the grounding vegetation.
Data Collection
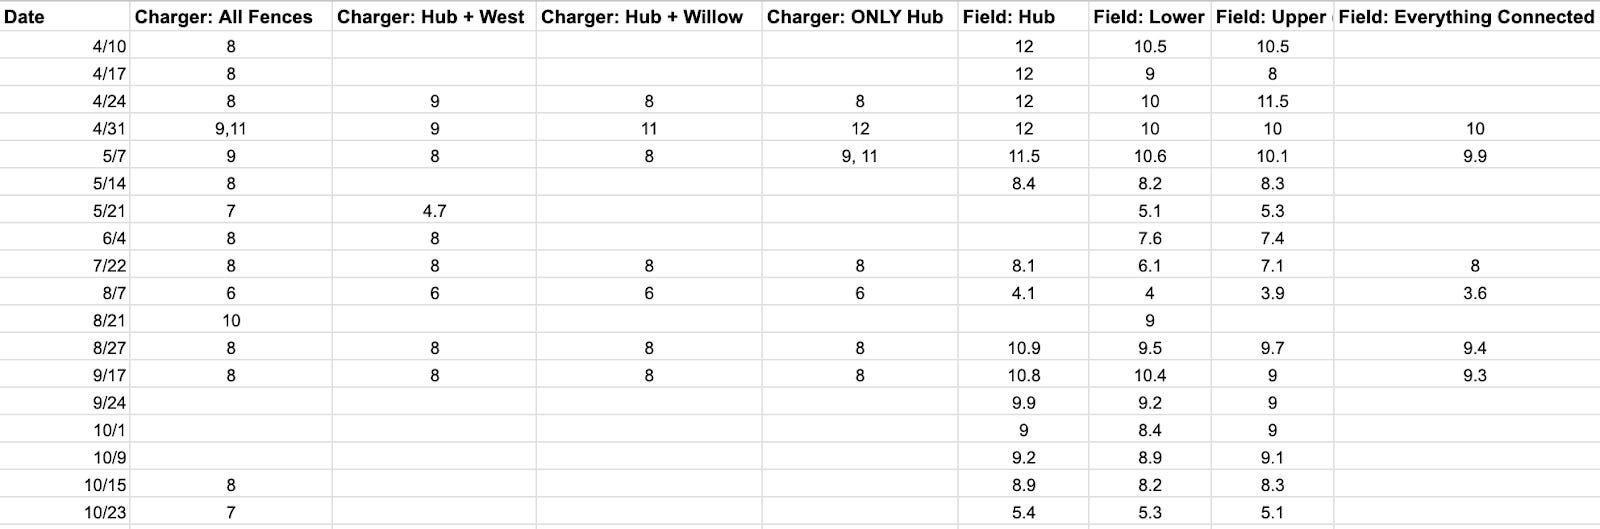
In 2025, we kept track of fence scores to see if any trends emerged. It is helpful to have different columns for different parts of the fence as scores can change depending on which fences are attached during score reading.
“Charger” indicates the score that is read on the energizer/charger.
“Field” indicates a score that is taken from the field with the handheld reader.
Ultimately we feel that tracking scores throughout the season created an additional step that was not necessarily required for success. That said, having a spreadsheet was helpful for keeping us accountable to regularly checking and monitoring the scores. In the end, the most important thing is to build checking the scores into your weekly routine so you know how much maintenance should be prioritized at any given time.
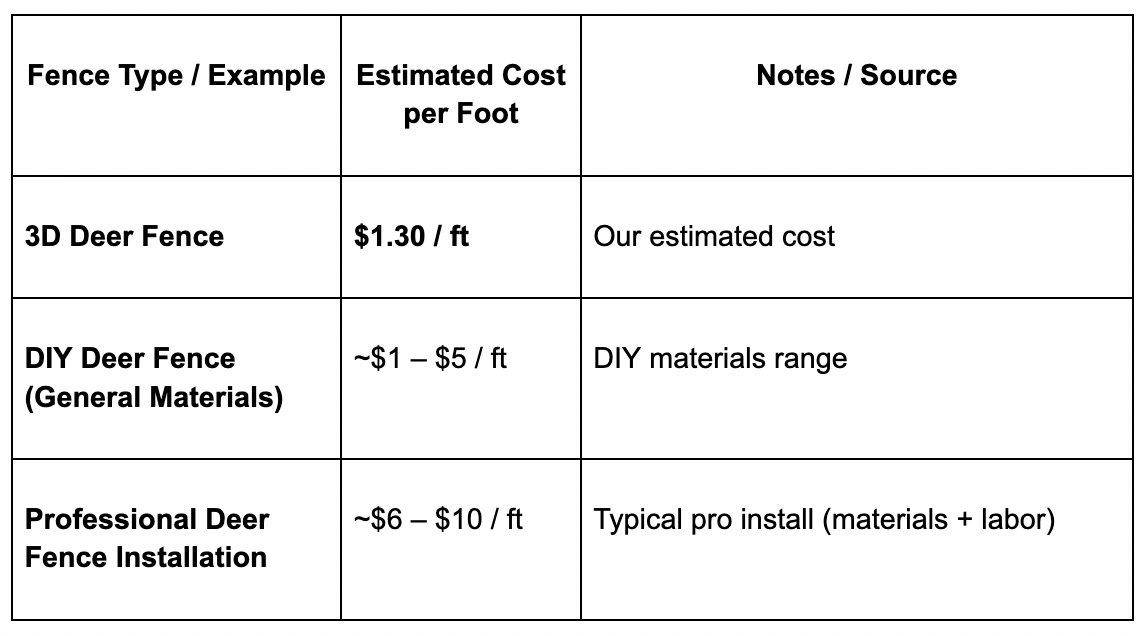
While fence maintenance can be tedious work, the total time commitment is reasonable given the cost savings of the fence when compared to installing a traditional deer fence. (Figure 1.5) In theory, the system is also not permanent, since eventually all the trees we are aiming to establish will be above browse height. This means that we could also move and reinstall the fence at a new location if we are establishing trees there.
Over three seasons, the fence felt “worth it” not just in dollars, but in reduced emotional wear-and-tear of seeing whole patches of young trees repeatedly set back. The 3D fence shifted us from constant reactive replacement to periodic upkeep. Keeping up with minor maintenance and completing a little bit each week is very helpful. It can be overwhelming if there are weeks or months of deferred maintenance
In practice, the difference between “easy upkeep” and “overwhelming” is often just one storm event plus unchecked vegetation. The fence doesn’t usually fail gradually—it tends to fail at one weak point. If you don’t have time that day or week to prioritize maintenance, it is still important to measure your scores to see how pressing the need for maintenance is.
Treating voltage readings like a smoke detector is the fastest way to know whether you’re in “fine for now,” “needs attention,” or “drop everything” territory. Even a 10–15 minute check can prevent a multi-hour repair later.
Maintenance in wooded areas is more complex given the amount of potential for trees to interfere with management. In pastures, the main item to maintain is vegetation growth. Wooded edges introduce “random events” (limbs, windthrow, snow load, freeze/thaw stake movement) while open ground introduces “predictable pressure” (grass growth and line contact). Knowing which sections of your perimeter behave which way helps prioritize walks—some segments need vigilance after storms; others mostly need mowing schedules.
Including decimal points in your score tracking is helpful as 8.1 and 8.9 have different implications for deer shock potential This is especially useful when you’re trying to notice slow decline over time. A drop from 9.6 → 9.1 → 8.7 is often telling you “vegetation is building up” or “a connector is loosening,” even before you feel like anything is visibly wrong.
Most failures were single-point failures. One grounded segment, one metal-to-metal contact, one gate not seated right, or one fallen branch can pull the whole system down—especially when fences are tied together through the hub.
Overall, we found that at a certain scale, it is more efficient to protect a whole planting zone rather than focusing on individual trees.
A 3D fence is effective if deer pressure is low to moderate. That said, it can still be effective under higher pressure if (a) deer travel patterns can be guided around a site, (b) voltage is consistently high, and (c) you are willing to do routine checks. The more “trapped” deer feel (no alternate route, or a lot of runway for a jump), the more likely they are to test the system.
Changing patterns of behavior: A 3D fence is a deterrent, not a fortress. Its success depends on high voltage + consistent geometry + deer psychology (depth confusion). If any one of those weakens (sag, narrowing, low kV), the system becomes more “jumpable.” Geometry matters as much as voltage. The 3-foot spacing between fences and keeping lines parallel is part of what makes deer hesitate. When stakes lean and the “alley” narrows, you’ve essentially created a “normal” jump.
Deer behavior is adaptive. A 3D fence performs best when it supports an existing “decision” deer already want to make (travel an edge, follow a corridor, avoid open exposure), rather than forcing them to do something unnatural. If you can align the fence with edges, streams, hedgerows, woods lines, and existing movement corridors, you’re working with behavior rather than against it. Once deer find a “safe” entry/exit, they repeat it. But the reverse is also true: once a spot is unpleasant (hot wire + awkward landing), they tend to abandon it—especially if you respond quickly after first evidence.
Planning for inspections as a normal part of the growing season rhythm—similar to irrigation checks or greenhouse walk-throughs, is essential. The goal is not to make the fence “perfect,” but to prevent small issues from becoming major vulnerabilities. Build the fence schedule around the reality that spring flush and late-summer regrowth are the two biggest vegetation pressure windows. Expect that the first 4–6 weeks after installation (or after major repairs) require more frequent checks—this is when deer test out the fence most and when you’re still refining geometry.
A simple routine that worked for us:
Weekly: check charger reading + one or two field readings (10–20 minutes)
Bi-weekly: fast perimeter walk with flagging tape to mark issues (45–60 minutes)
Seasonally (2–3x): tune-up day that fixes deferred issues (3-5 hours)
When deer pressure is observed, take action ASAP to address it. In one instance, a corner of the fence became an easy access for deer since they could get a running start and hop the fence. We addressed this by adding an additional loop of fence to the system in October 2024, as well as felling a bunch of trees and stacking thorny brush to discourage a good landing spot beyond the perimeter fence. This seems to have helped as the evidence of deer in the site was eliminated in the following weeks.
Even with everything, we also found it useful to assume that some browsing will happen and to design plantings accordingly: plant willows/poplar in densities and patterns that can tolerate a little nibbling, and keep the most sensitive species (like chestnut or certain fruit/nut) in the most protected interior zones.
In theory, over time the work becomes less critical, as more plantings get above the browse height of deer and become established. “Above browse height” is the shifting finish line that makes the work feel worth it. Once a large percentage of the planting is reliably out of the danger zone, the fence can become less “emergency critical” and more “insurance.” Until then, plan on keeping the fence in your seasonal workload!
No posts
Comments
Nothing yet. Say the first thing.
Sign in to join the conversation.