
Reminder: I’m offering a limited-time 50% discount on the annual plan:
Once you claim it, the discount will be applied forever.
Now, with only $5/month, you will have access to:
200+ deep-dive data engineering articles
practice-spark: 65 LeetCode-style problems to practice Spark SQL/DataFrame
learn-spark/dbt/airflow: CLI tools to master Spark/dbt/Airflow
If you’re a Vietnamese user, please DM me for an upgrade due to payment issues
Parquet is the most important file format in data engineering.
Its columnar (hybrid) format and self-contained nature make it work so well for analytical workloads.
Learning Parquet matters not only because it’s one of the most widely adopted file formats in data engineering, but also because you can apply Parquet’s fundamentals to nearly all analytical storage systems: from how data is organized and encoded to how metadata plays an important role in query performance.
That said, I realized it can be a bit challenging for beginners to learn about Parquet, especially without a detailed visualization of its internals.
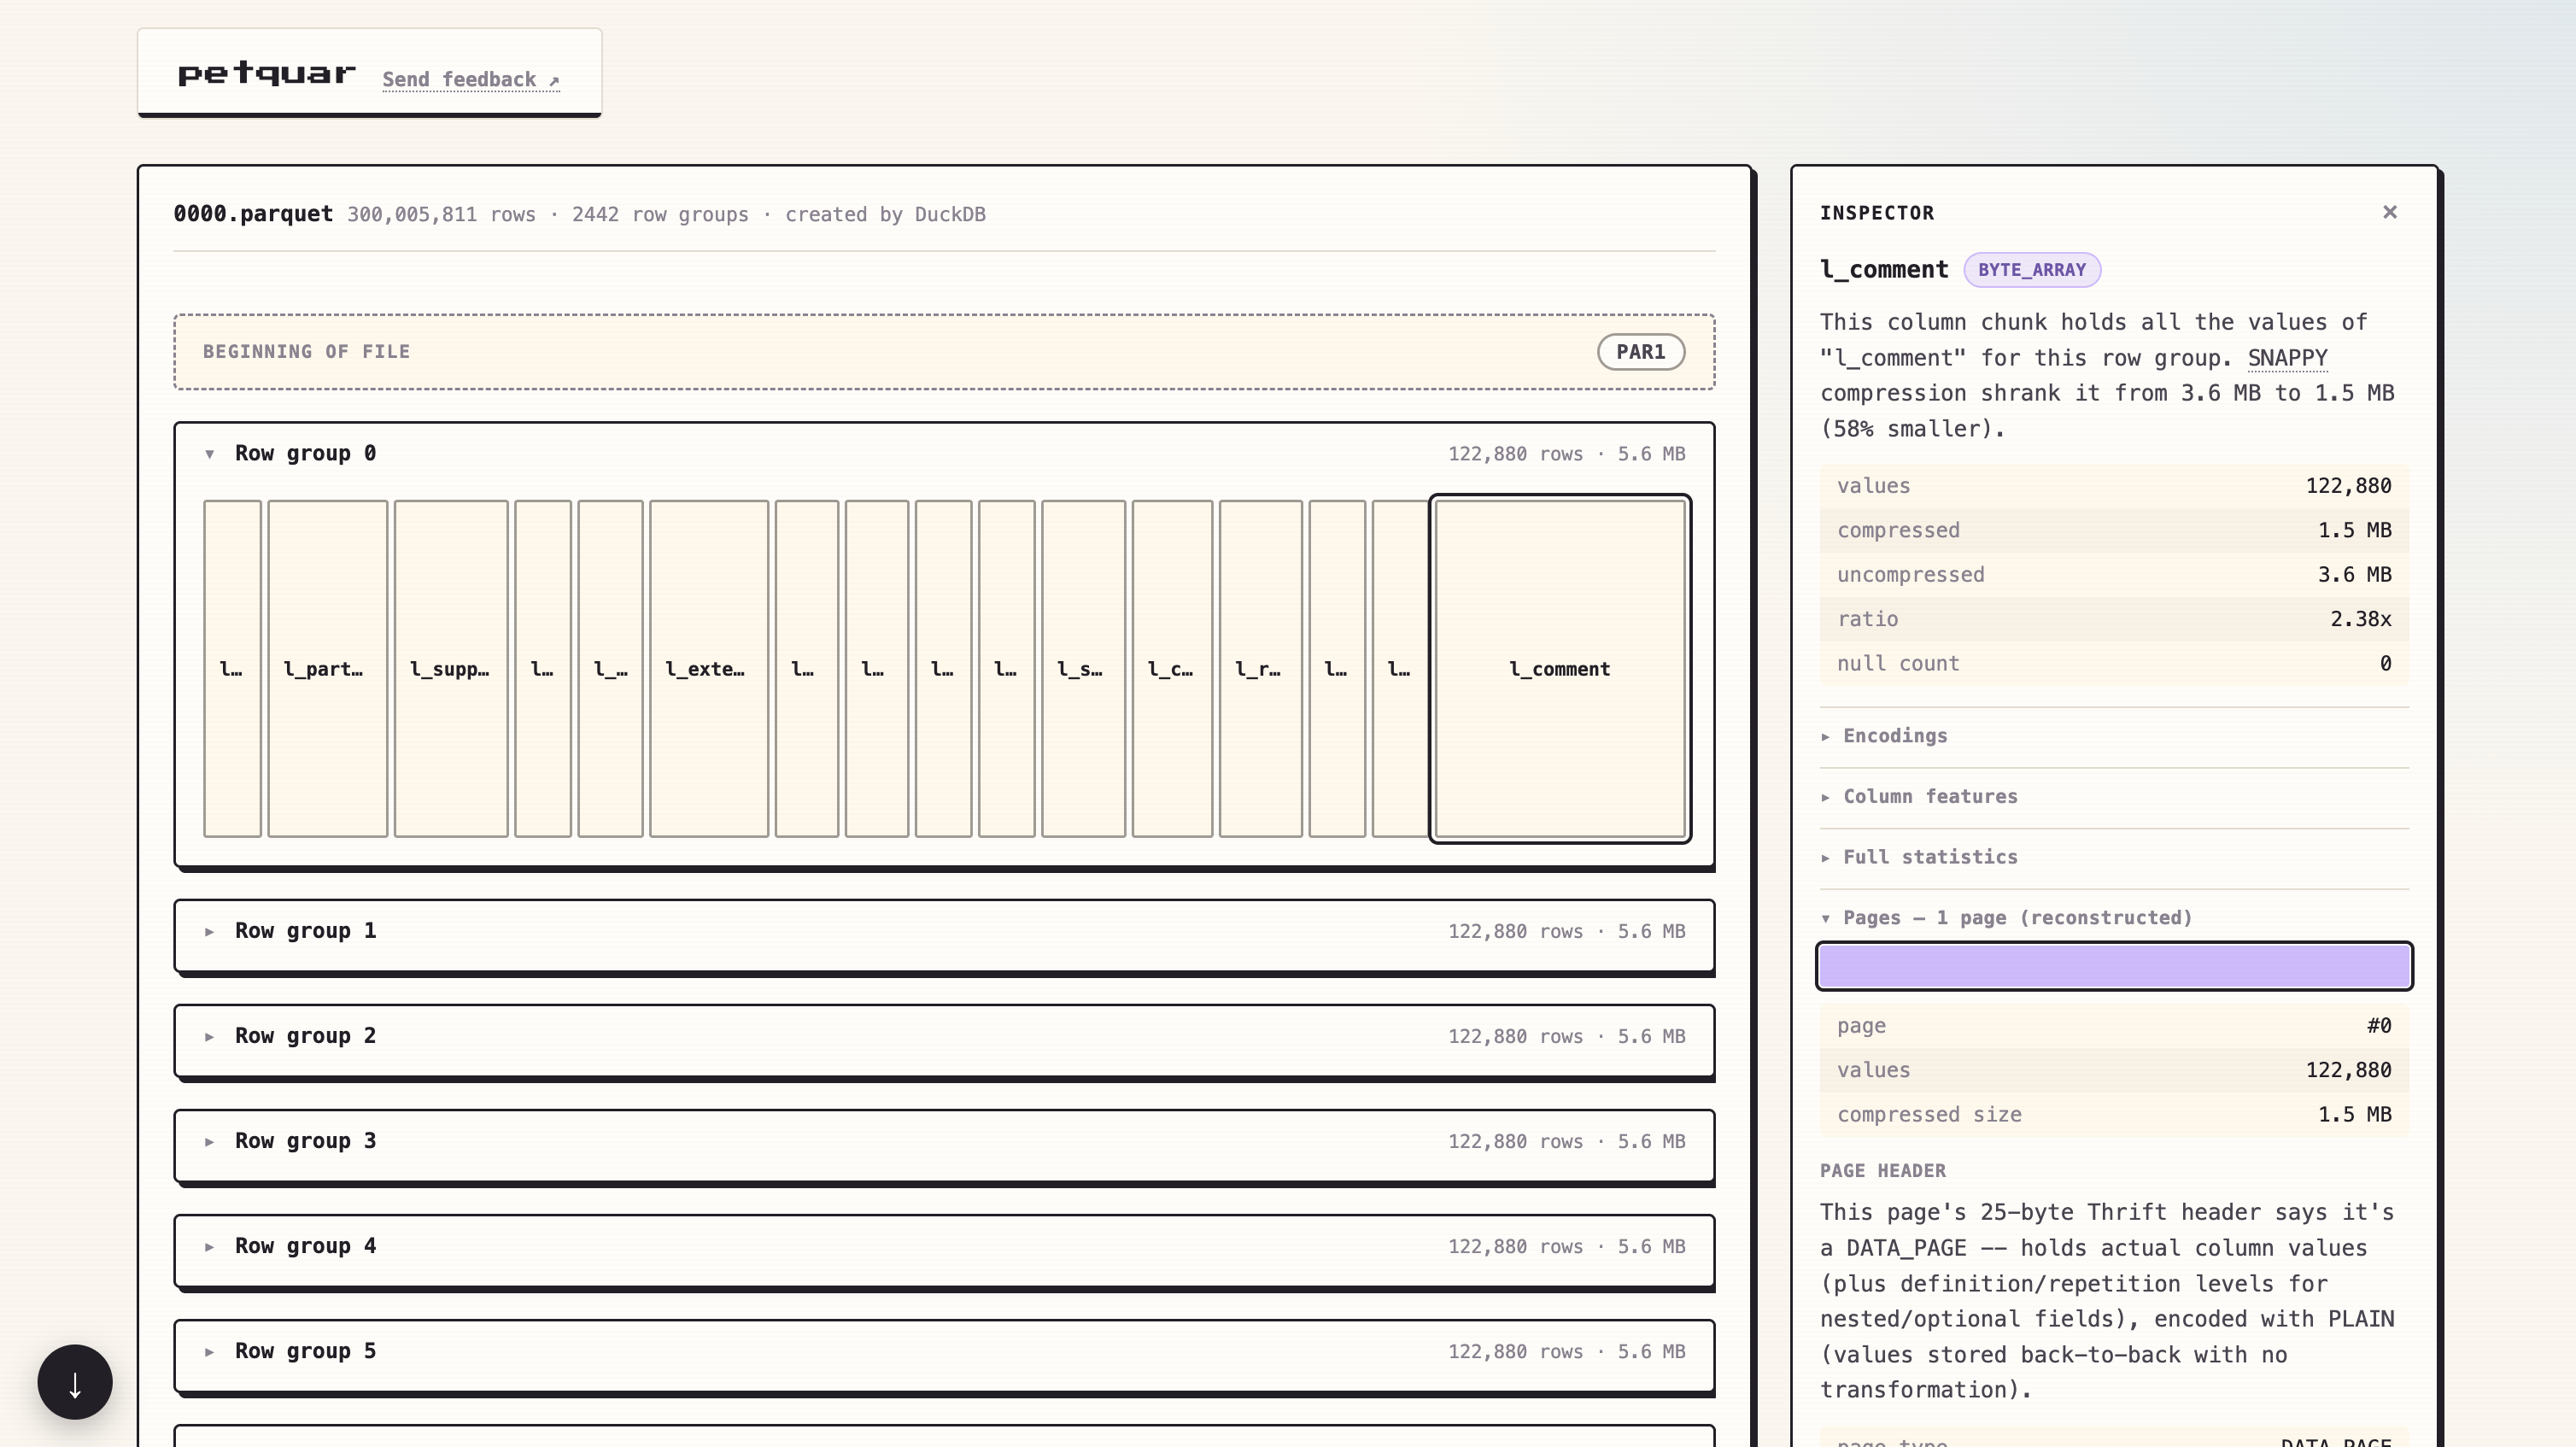
I created a tool (with Claude) to help you visualize any Parquet file.
It’s totally free.
Just:
And:
All the source code available here: GitHub repo.
It will then open a new browser tab with that Parquet file’s internals. The UI includes:
The beginning and end of the file, including the magic numbers
Row group cards that visualize the file’s row groups
Inside each row group are the column chunks
A row group’s size (shown once expanded) and a column chunk’s size are proportional to their real, compressed size on disk
Clicking a row group or column chunk opens an Inspector panel with a plain-language explanation and the raw facts, so you can see exactly what’s inside the file.
Column chunk information covers encoding, whether a bloom filter is present, and min/max statistics -- and drills down to the page level too, showing the number of pages plus each page’s encoding and min/max statistics.
The schema (every column’s name, type, and nullability) is available from the FileMetadata block.
All of this information is parsed by Rust arrow-rs.
So, give it a try and see if it helps you.
Don’t hesitate to send feedback (the link next to the “petquar” logo, top left) so I can improve it further.
Reminder: I’m offering a limited-time 50% discount on the annual plan:
Once you claim it, the discount will be applied forever.
Now, with only $5/month, you will have access to:
200+ deep-dive data engineering articles
practice-spark: 65 LeetCode-style problems to practice Spark SQL/DataFrame
learn-spark/dbt/airflow: CLI tools to master Spark/dbt/Airflow
If you’re a Vietnamese user, please DM me for an upgrade due to payment issues
No posts
Comments
Nothing yet. Say the first thing.
Sign in to join the conversation.