
(Followers should subscribe for free to get all posts by email.)
1. Most titles require qualifications. In this case, the first is to specify that I am referring to a short-term horizon, specifically until the end of August. Second, whereas the statement about the ECB is a prediction with a high degree of subjective probability, the statement about the FED is a mix of a firm normative view and a partial prediction. Third, in principle, I do not expect a major and prolonged spike in inflation.
Naturally, the consequences of the US/Israel war with Iran are impossible to foresee in all their aspects. Certainly, energy costs will rise, at least temporarily, and its upward pressure on inflation should prevent the FED from considering further rate cuts, especially when inflation is already well above the FED’s 2% target. I predict that, even after Warsh is appointed, the FOMC will not have a majority in favour of cuts. Inflation outcomes should guide the decisions. Regarding the ECB, with inflation at its most recent readings of 1.7% and 1.9%, respectively, in January and February, it has room to wait before determining where inflation might be heading, and whether second-round effects might occur.
Even during significant supply shocks caused by external price spikes, monetary policy should not implement large hikes immediately but rather wait for some time. “Seeing through” the initial inflation increase caused by a supply shock, when inflation is unavoidable, is the correct approach. The goal is to maintain stable expectations and limit second-round effects. If inflation persists and feedback effects strengthen it, then gradual rate increases would be appropriate to manage it. It is true that wars and commodity price spikes are associated with all major episodes of inflation in advanced economies. (see chart)
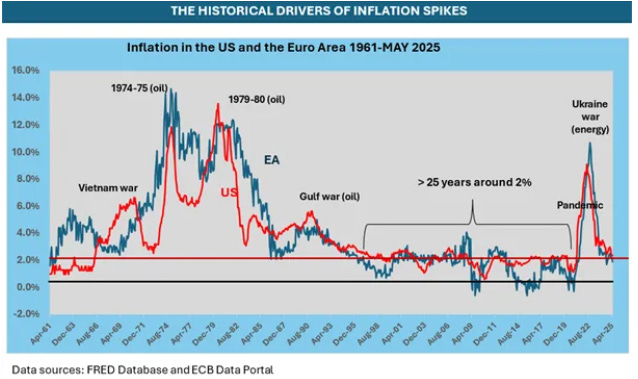
A cursory look suggests that all those episodes were always temporary, albeit of different durations, because cost increases, without the accommodation of macroeconomic policies, would have to be repeated each year to feed inflation, directly inducing a fall in demand, and would likely lead to the ending of the cost-push cycle within a few years.
Nevertheless, as the following chart for the US illustrates, in the past, oil price spikes with their stagflation effects generated GDP recessions, but not in 2021-2025:
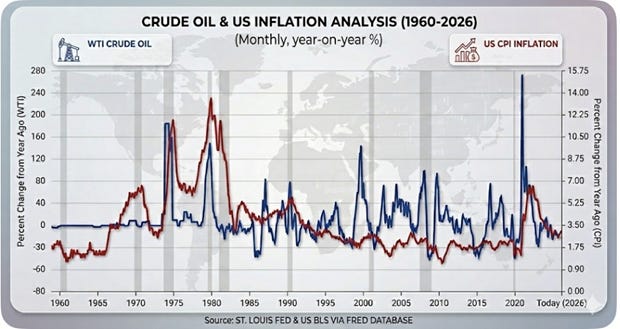
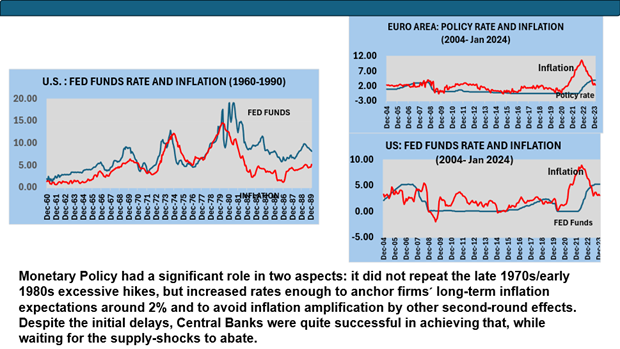
Aside from the fact that the wage-price spiral typical of the 1960s and 1970s no longer exists due to the decline of trade unions and collective bargaining in advanced capitalist economies, the other reason explaining why a recession did not occur during the recent inflationary period was the prudent behaviour of central banks in respecting the principles of adjustment to a supply shock-triggered inflation. (see my post “A FEW CONCERNS ABOUT THE ECB’S NEW MONETARY FRAMEWORK” at https://vconstancio.substack.com/p/a-few-concerns-about-the-ecbs-new?r=62v8e )
Compare the behaviour of policy interest rates this time with the Volcker excesses of 1979-1982:
2. Assessing the possible dimension of the crisis.
So far, the current oil price shock has been quite significant, but not severe when we consider the evolution of prices over the past few years. In that respect, we are still far from reaching the peak of energy prices in 2022. Consider the following table of market price developments since the beginning of the war.
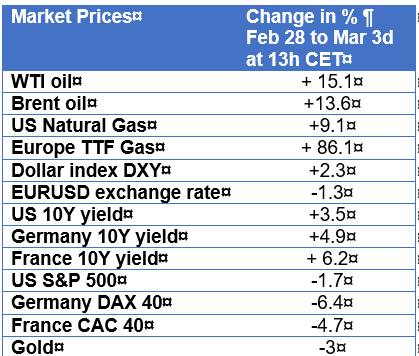
All energy product prices rose, but the increase in natural gas prices in Europe stands out. The following chart shows the different evolution of natural gas prices in the US, a big producer, and Europe, a sizable importer (prices in dollars per MMBtu). Notice the peak of European gas prices in 2022.
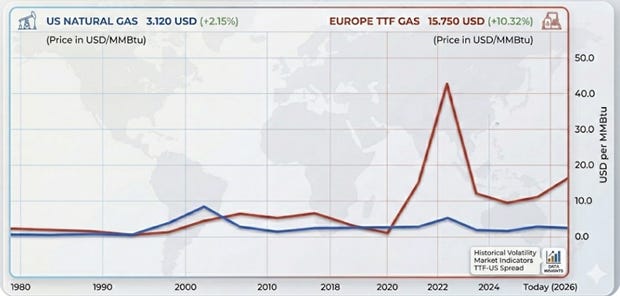
The peak in European TTF prices in 2022 was due to the Russian invasion of Ukraine and European sanctions. Now, the spike in TTF prices may be slightly exaggerated, but the point is that Europe imports 15% of its natural gas from Qatar, which has shut down production due to Iranian attacks.
It is natural to assume that oil and natural gas prices should be linked in terms of energy content and that the price difference between the US and Europe should not exist. However, contrary to oil, the natural gas market is regional rather than global. Historically, the European gas market was dominated by “Oil-Indexed” contracts (linked to Brent oil prices with a 6- to 9-month lag). However, since 2010, Europe has rapidly shifted to “Hub Pricing” (TTF). Currently, TTF is mainly influenced by its own supply and demand factors (storage levels, Norwegian pipeline flows, and LNG arrivals). Oil only has an impact during periods of extreme volatility.
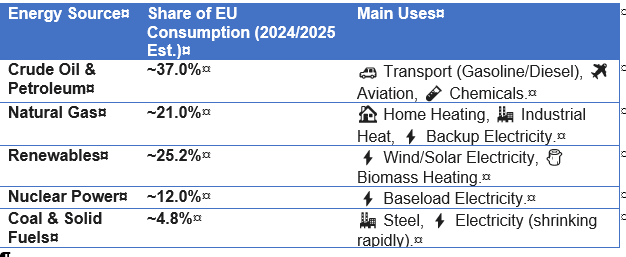
The increase in the price of natural gas in Europe is quite relevant because 21% of European energy consumption is from natural gas:
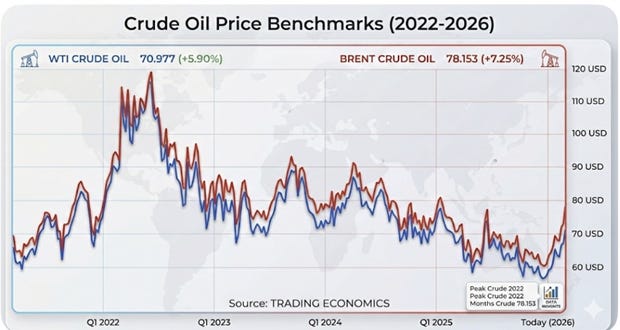
Regarding oil, US WTI and Europe’s Brent oil prices rose by around 15.1% and 13.6%, respectively, after an initial 13% rise on Sunday. The market knows that Iran’s oil production accounts for only 3.2% of the world’s total and believes that the practical closure of the Strait of Hormuz will not last long. The Middle East produces about 30% of the world’s total, consumes locally, and exports part of its production via pipelines, thereby supplying the world through the Strait of Hormuz with 20% of total oil production. The next graph shows the destination country for that 20% of oil.
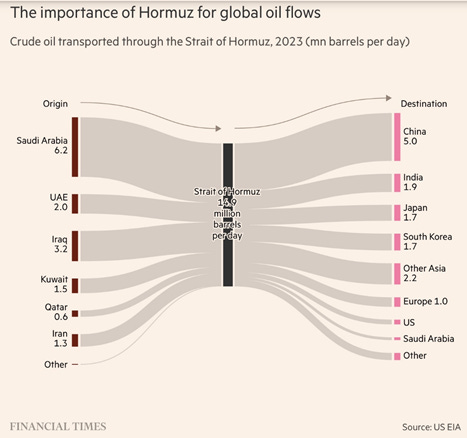
The small amount going to Europe or the US does not mean both are safe regarding oil prices, because the oil market is global and what happens in one location affects prices everywhere, based on quality differences. The following chart shows this by comparing US WTI oil prices with European Brent. Brent is usually a little more expensive than WTI. The chart shows how far away the price of oil is from the peak in 2022 or even from the 2024 levels
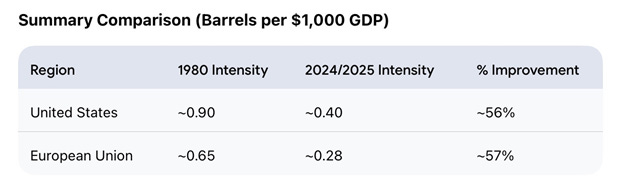
In comparing the impact of the present situation with that of the late 1970s oil crisis, two major differences stand out. The OPEC decided those oil price increases by 300% in 1974 and 100% in 1979 will not happen this time, and the oil quantity content of GDP is nowadays well below what it was back then:
Note: These figures are based on inflation-adjusted GDP. Naturally, we use in total more oil more oil nowadays, but we use far less per dollar of economic value created.
Additionally, it is necessary to consider that energy products in the Euro Area Harmonised Index of Consumer Prices account for between 9% and 10% and approximately 6% in the US.
(Followers should subscribe for free to get all posts by email.)
Conclusions
In principle, the stagflation effects of the expected increase in energy prices will not be historically dramatic this time if the war is settled within a short period of time. However, the war’s consequences may be protracted, forcing monetary policy to gradually increase rates after the summer, conditional on a material increase in inflation in the latter part of the year. As I mentioned in previous posts, the mere possibility of this happening could destabilise the US credit and equity markets, which were counting on several rate cuts during the year, creating significant financial instability. Overstretched equity prices and the AI bubble may trigger a significant correction that everyone has been expecting, after which a US recession would ensue, with spillovers to the world economy.
Comments
Nothing yet. Say the first thing.
Sign in to join the conversation.