
In 2023, a survey was run among 3,925 ME/CFS and Long Covid patients called TREATME. It asked patients which treatments they have tried and how they responded to it. It is by far the biggest survey of its kind. I am really grateful to Martha Eckey, a PharmD and patient herself, for collecting the data and to the Open Medicine Foundation for having helped her to analyze and publish it.
At the time I wasn’t very interested in the results, but I’ve since come to appreciate the severity of publication biases. Those retrospective “we treated x patients with treatment Y without blinding and without controls” only get published if there are positive results! This survey, on the other hand, would have been published regardless of any individual treatment results, making it significantly more trustworthy (although not as good as well-designed RCTs).
Having said that, there are some downsides to the survey.
They rely purely on self-report, and patients have a tendency to rate things positively.
The survey couldn’t have a placebo control. The authors addressed this by choosing oral vitamin C (non-liposomal) as a control.
The survey doesn’t distinguish between temporary side effects and permanent worsenings. This is obviously problematic. (I also can’t fix it with the data available)
They count any improvement (+1) and any worsening (-1) equally to calculate Net Assessment Scores (NAS), even though they designed the survey with a 7-point Likert Scale with minor/moderate/major response rates. This loses important information! I’m much more interested in treatments with large effects than small ones.
I didn’t like their color coding of improvements as red/yellow/white
In 2023, I could have only complained about this. Even though the authors generously shared the shareable part of the data, I couldn’t run statistics on my phone and it would’ve been too much effort given the severity of my disabilities. Nowadays, there’s AI! It took me only a few hours to instruct Claude Opus 4.5 to make the changes I wanted:
I gave the following weights to minor/moderate/major: [1.0, 2.5, 5.0] for improvements and [-1.0, -2.5, -5.0] for worsenings, and 0 for ‘no change’. Formally, statisticians would hate me for this because it’s adding numerical information to ordinal data, but I don’t care. The correlation between results with weights like [1, 2, 3] was pretty high (~.88). Anyway, these values allowed me to calculate average treatment effect and confidence intervals for each treatment.
I changed the control condition to the median effect score1 instead of vitamin C. I wanted to try this approach and it also raises the bar. They had >70 statistically significant positive treatments, my results have ‘only’ 33.
I also included treatments with fewer than 20 reports while the original authors excluded these. I think that’s a fair choice but I was curious about the n = 10-19 range as well.
I used BH-correction for multiple testing just like the original authors did. This is a method that limits the amount of false positives to 5%. It’s a standard method and less conservative than Bonferroni.
Disclaimer: I relied heavily on AI here. While I did some simple spot checks, I didn’t understand all the statistical technicalities. There may be mistakes I haven’t noticed. AI has gotten pretty good but it does make mistakes. For those complaining: I wouldn’t have been able to get this done with higher quality standards. It would just sit in my Google Drive with all my other unfinished drafts. I wrote this myself.
Here’s the top 53 treatments, including all significantly positive results. For context, the scale runs from -5.0 (everyone has major worsenings) to +5.0 (everyone has major improvements). As an example, a score of 1.0 could be achieved by
60% having moderate improvements
20% neutral
20% moderate worsening.
You can look up the exact distribution for each treatment in the colored stacked bar chart.
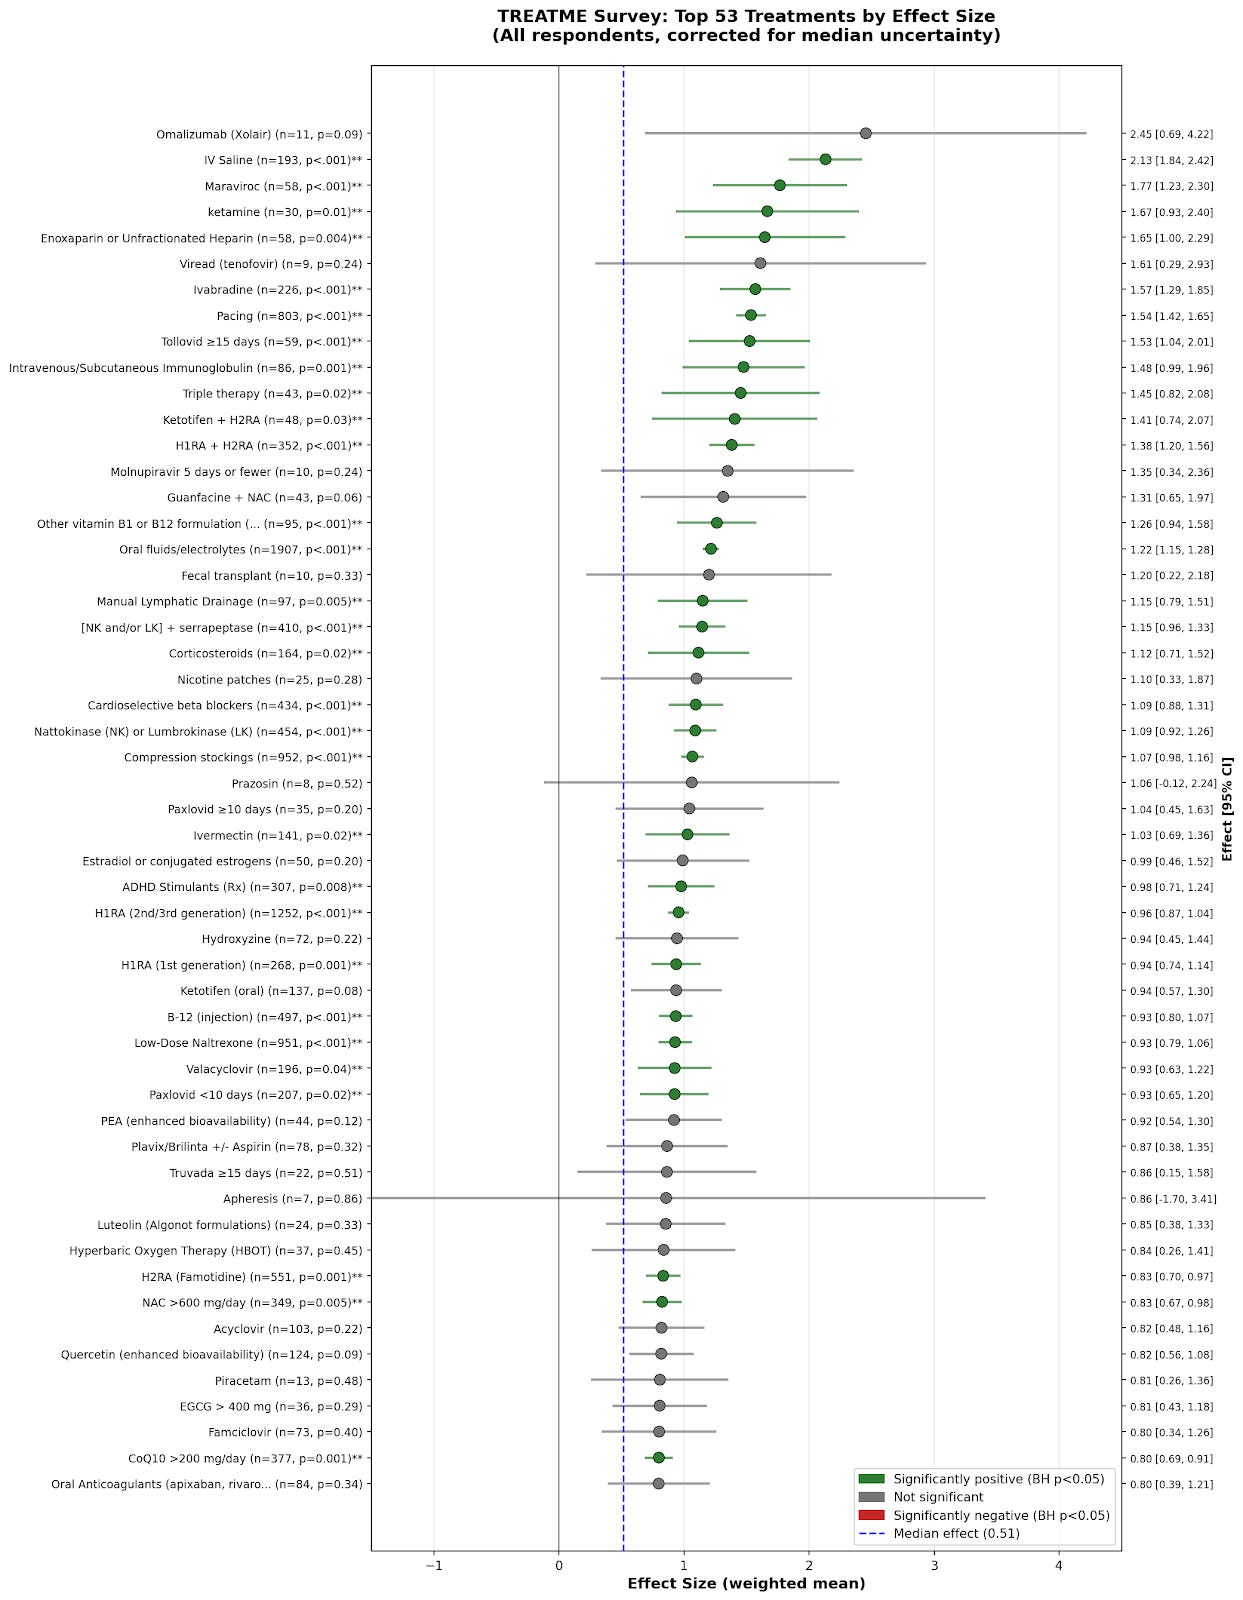
Forest plot of top 53 TREATME results according to my method. H1RA = Histamine 1 Receptor Antagonist. Treatments are sometimes not significant even though they don’t intersect with the control line, but this is because of the BH-correction. All results in forest plot, and spreadsheet.
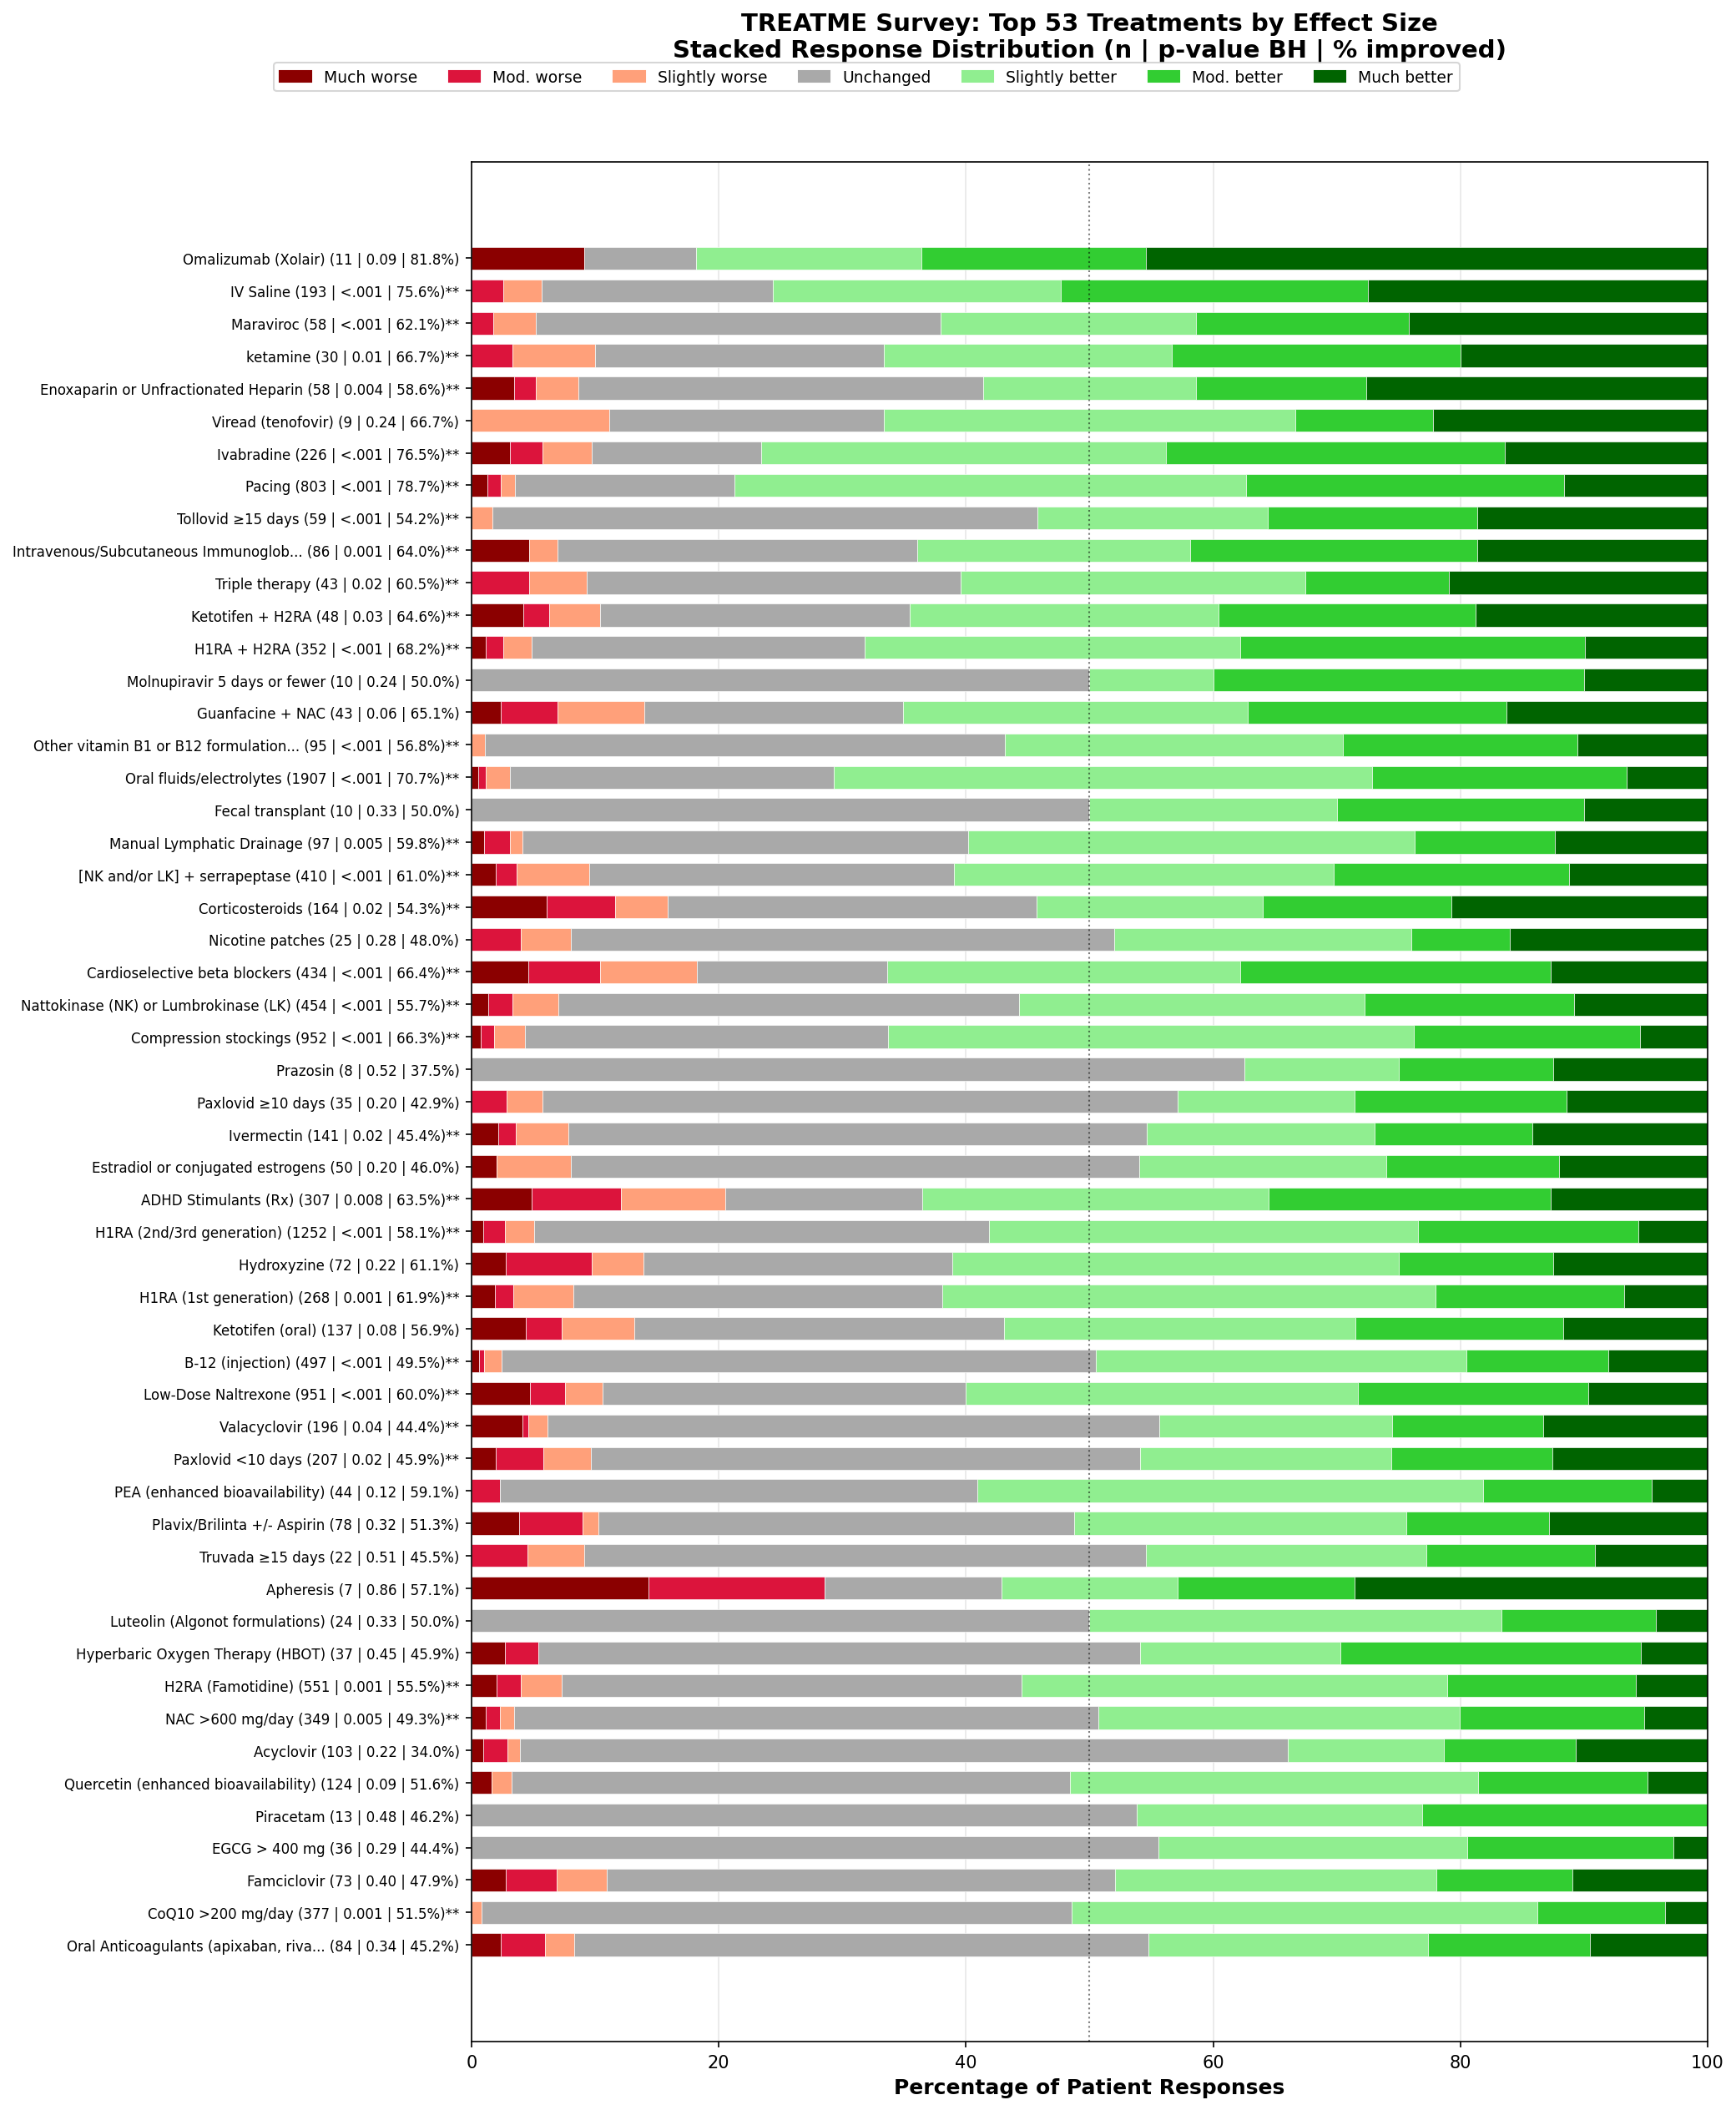
Stacked bar chart of top 53 treatments ranked by effect score. Full list here.
A few things stand out to me.
First, the median effect score is 0.51, which I use as control (vitamin C, the original control, was 0.32). Interestingly, the median effect score for ME/CFS is smaller than for Long COVID (0.44 vs. 0.66, p < .0001). This could be because LC patients are more treatment responsive, or because the LC population has a higher rate of ‘natural recovery’ that they mistakenly attribute to the treatment they took. They weren’t ill as long as the non-LC ME/CFS patients.
Second, my ranking is quite different from the original publication which used Net Assessment Scores. Their top 5 was:
Fluids/electrolytes
Pacing
Compression stockings
Antihistamines
Nattokinase/lumbrokinase
These are all treatments with a large share of minor/moderate responders. These dominated because any improvement was weighted equally.
In my analysis, omalizumab (Xolair/Omlyclo), an anti-IgE monoclonal antibody used to treat allergies, has the number 1 rank with an effect score of 2.45 (0.69 - 4.22), but due to the small sample size (n=11) it’s not statistically significant (p=.09). A subset of LC & ME patients have broad allergic reactions often referred to as Mast Cell Activation Syndrome (MCAS), and presumably these are primarily the ones who benefit from Omalizumab. However, as a recent Twitter/X poll of mine suggests, patients without these symptoms also often benefit from “MCAS meds”. I had AI search for anecdotes online but it found only 7, and all responders had MCAS symptoms:
Major improvement: 2 (29%)
Moderate improvement: 3 (43%)
No change: 1 (14%)
Major worsening: 1 (14%)
A well-designed RCT for Omalizumab (with subtyping for MCAS symptoms) would be very interesting, even though it’s likely that these results are driven by random chance.
(Not sure if ‘show results’ works on Substack)
The top 5 statistically significant treatments (with effect scores, all p ≤ .01) are:
IV Saline (1.84 - 2.14): no trial done, nor ongoing. OMF proposed one but deprioritised it.
Maraviroc (1.23 - 2.30): already being trialed in combination with atorvastatin. Personally I suspect this was inflated by the cultish bias around Dr. Patterson, but who knows.
Ketamine (0.93 - 2.40): only a too small trial ongoing.
Enoxaparine or unfractionated heparin (1.00 - 2.29): no trial past or ongoing, would be interesting if coagulation biomarkers can predict responders.
Ivabradine (1.29 - 1.85): trial ongoing. I wonder if the effect is mainly HR reduction or also effective for broader symptomatology.
The list continues with very gradually declining effect scores, so the cutoff after top 5 is pretty arbitrary. Honestly, these effect scores aren’t bad, and there are plenty of drugs approved for other medications with effect scores like these or smaller.
In general, the results are stronger for hard-to-attain treatments. The difference between treatments that require presence at a hospital/clinic and at-home treatments is significant. This could be because those treatments are more effective, but also because patients are more inclined to report positively once they’ve put in a lot of effort to get something. In placebo research, the more serious the route of administration, the larger the placebo effect (which isn’t a real effect, but likely a measurement artefact). However, the difference between prescription meds and supplements is, surprisingly, not significant.
There’s also various splitting going on that was combined in the original publication, such as antihistamine treatments, anticoagulation treatments, Paxlovid. I kept these separate by default, which led to for example Paxlovid> 10 days not reaching significance due to low sample size (n=35).
What the effect scores hide is that some treatments are riskier than others. Here’s the top 20 riskiest treatments, ranked by % worsened:
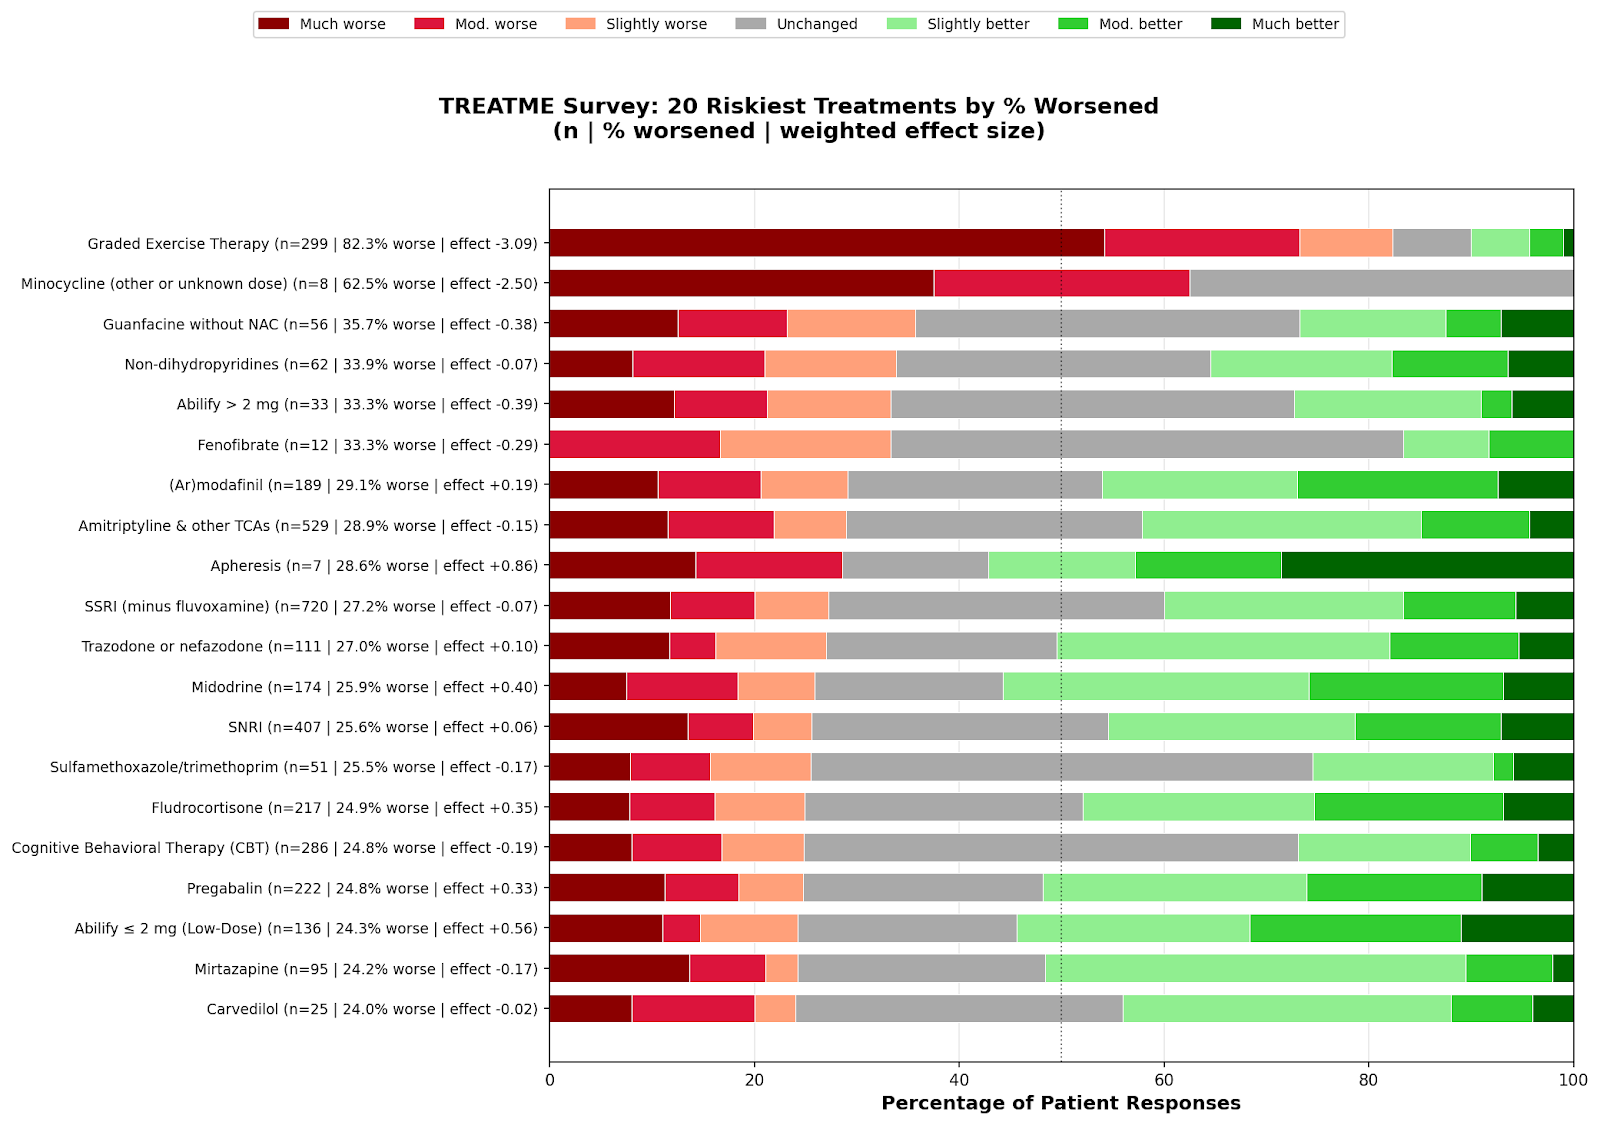
Graded exercise therapy (GET) really jumps out as harmful again, just like in the original analysis. I should note however that this sample selects for those active in online patient communities, and those who recovered early and (think they) benefited from GET would be less likely to take this survey.2
Also, please note that minocycline at a different dose had a better score.
To my surprise, corticosteroids didn’t make it into this list: it has only 16% worsening, and even has a significantly positive effect score of 0.71 - 1.52! (This includes the negative effects)
In hindsight I should’ve left out treatments with n < 10 like apheresis because they’re too noisy, but I’ve got limited spoons
Personally, I avoid risky treatments when possible - as a long-term strategy you’re bound to get burned if you keep doing them.
I want to thank Martha Eckey again for collecting this wonderful dataset. I hope we will see more well-designed RCTs for the top treatments I identified here that don’t have a proper RCT planned yet. However, I’m unsure whether any will hold up, and I would explicitly encourage researchers to also trial medications not on this list. Overall, even though I definitely welcome more observational research, I believe we mostly need more trials.
I developed ME/CFS in 2020, possibly from a covid infection. I aspire to write about underappreciated ways to tackle our disease(s), based on reason and evidence. I am on Twitter as @PatientPersists. Everything written with significant brain fog and limited spoons.
Subscribe for more!
Again, statisticians might balk at this because the median isn't completely independent and this slightly inflates z-values. I had AI apply a correction though by using a larger standard error: SE_corrected = √(SE_treatment² + SE_median²), which makes the test slightly more conservative and the p-values more honest.
There are probably more ways in which this survey selected for a certain type of respondent which could've shaped results - that's hard to prevent.
No posts
Comments
Nothing yet. Say the first thing.
Sign in to join the conversation.