
You started with 100% of your company.
You raised a pre-seed. Then maybe a top-up. Perhaps a small bridge. All on SAFEs — clean, fast, no valuation drama.
Wow, you still feel like a majority owner.
Then your first priced round closes.
And someone slides a cap table across the table.
Boom - You own 51%. Not the 70% you mentally assumed. Not the 65% you scribbled on a napkin. Fifty-one. And that’s before the Series A option pool refresh.
This is not a rare horror story. This is the default outcome for founders who never modelled their dilution before it happened.
→ Before we get into the math — run this first.
Founder Ownership Forecaster by The VC Lens — 9 questions, industry-adjusted dilution math, shows you exactly where your ownership lands at Seed and Series A. No login required
Why SAFE rounds feel harmless…until they’re not
The three things eating your equity (and which one founders always forget)
A real worked example: how 90% becomes 42%
What the industry benchmarks actually say
The number you need to protect before you raise again
FAQs
A SAFE (Simple Agreement for Future Equity) is a promise.
You take the money now. The investor gets shares later when you raise a priced round.
Nothing changes on your cap table today. No new ownership percentages. Everything looks the same.
This is exactly the problem in dilution context.
Because the dilution is invisible right up. One founder described it well: “You sign, the cash arrives, and nothing visible changes on your ownership. Then eighteen months later, all of those quiet little agreements convert at once and you discover you own less of your business than you planned.” SaaS CEO
Most founders raise 2–3 SAFE rounds before a priced round. Each feels small and clean in isolation. Together, they can silently lock in 25–35% of the company before a single VC cheque has landed.
When your first priced round closes, three dilution events happen — sometimes all at once.
① The SAFE stack converts.
Every SAFE you’ve ever signed converts into equity at the priced round. If you raised $2.25M across three SAFEs with caps of $5M, $8M, and $12M — those investors now collectively own ~27.7% of your company before the new investor writes a single cheque.
② The new investor takes their share.
A standard Seed round of $3M at a $12M pre-money valuation gives the new investor 20% of the company. That’s not 20% of what you have left. It’s 20% of the total, after SAFEs have already converted.
③ The option pool gets refreshed. Pre-money.
Here is the one founders always forget.
Investors will ask for a 10–15% ESOP pool at Seed. They’ll ask for it to be created before the round closes, which means it dilutes you, not them. If you already have a 10% pool, they may ask it to be topped up to 15%.
That refresh comes out of your share. Not theirs.
Run these three events together on a typical cap table, and the founder who felt like a 75% owner is now looking at 52–57%. And that’s considered healthy by industry standards.
Let’s follow a real scenario through the Founder Ownership Forecaster by The VC Lens.
The setup:
B2B SaaS company, North America
2 co-founders, starting with 90% combined ownership
10% ESOP already carved out
Pre-seed SAFE stack: $750K across $5M–$8M caps
Seed round: $3M at $12M pre-money
Series A (planned): $10M at $35M pre-money
Hiring plan: 3 engineers, 1 PM, 1 designer over next 18 months
What the tool calculated:
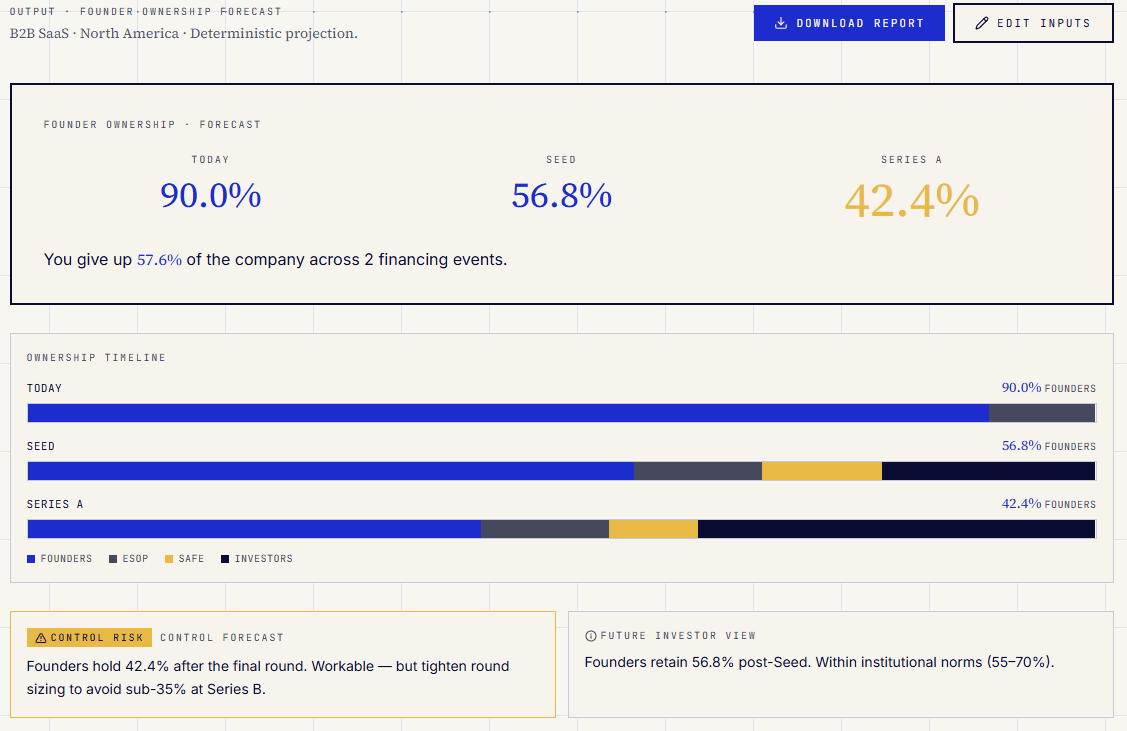
Total given up across 2 rounds: 57.6%
That’s not an edge case. That’s a standard B2B SaaS journey with completely normal round sizes and normal dilution at every stage.
The Seed drop alone from 90% to 56.8%…happens because three things hit simultaneously: SAFE conversion (11.3% to SAFE holders), new investor shares (20%), and the ESOP top-up (12% pool after refresh).
You didn’t do anything wrong. You just didn’t model it.
The Founder Ownership Forecaster benchmarks your numbers against what’s normal for your sector and geography. Here’s what B2B SaaS founders in North America should expect:
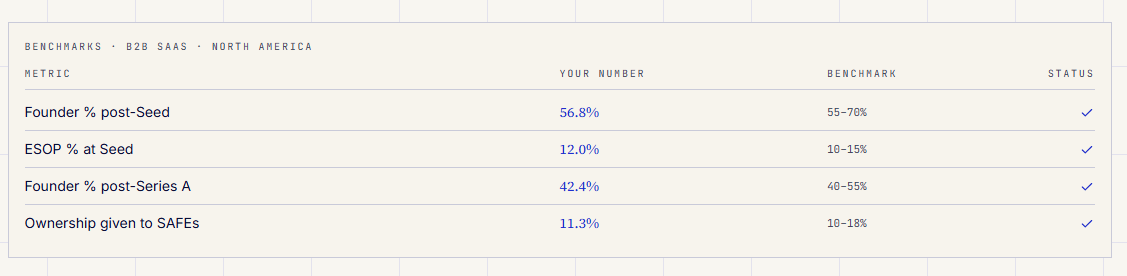
The benchmark is clear: investors expect founders to hold more than 55% post-Seed and the tool flags anything heading below 35% at Series A as a “Control Risk.” Drop below those thresholds and downstream investors start asking uncomfortable questions about whether enough equity remains to incentivise the founding team.
Only 1 in 5 founding teams at VC-backed startups own 50%+ after Series A. The median founding team ownership after Series A is 36.6%. After Series B it’s 23.5%. By Series D, the average founding team holds 10.9%.
You’re not being taken advantage of. This is how the math works. The question is whether you see it coming.
There is a number that matters more than your valuation.
It’s not your MRR or ARR. It’s your post-money founder ownership percentage — because every downstream investor will look at it before they decide whether to lead your next round.
A widely cited benchmark from Rebel Fund’s 2025 guidance: stay under 18% cumulative dilution through your Seed round
Most founders breach this before they’ve raised their first $1M.
The fix is not to stop raising. It’s to model it before you sign — not the morning after you close.
Across multiple SAFE scenarios, seemingly small differences in caps and discounts move founder ownership by 5–10+ percentage points by Series A. That’s the difference between a healthy cap table and one that quietly undermines your Series B.
→ If you’ve read this far and you’re thinking “I just want to see my own numbers” — this is exactly what the tool is built for.
Founder Ownership Forecaster — 9 questions, see your Seed and Series A ownership in minutes →
Industry-adjusted. Geography-adjusted.
Q: If SAFEs don’t change anything today, why does the cap matter so much?
The cap determines how many shares your SAFE investors receive when they convert. A $5M cap on a $500K SAFE = the investor gets 10% of the company. A $10M cap on the same $500K = 5%. The lower the cap, the more expensive that early capital becomes at the point of conversion. Stack three low-cap SAFEs, and you’ve pre-sold a significant stake at very low prices — often without realising it until the priced round spreadsheet arrives.
Q: What’s the difference between pre-money and post-money SAFEs?
A post-money SAFE locks in the investor’s ownership percentage at signing. Invest $500K on a $5M post-money cap = exactly 10%, locked in — regardless of how many other SAFEs you raise after them. Pre-money SAFEs calculate ownership relative to the cap table at the time, so the percentage isn’t fixed until the priced round. Post-money SAFEs are now the default (YC’s standard) and are generally more dilutive for founders who raise multiple rounds, because percentages stack.
Q: Can I negotiate SAFE terms after they’re signed?
Once signed, SAFEs are binding contracts. Restructuring them before a priced round requires investor consent and is operationally messy. The window to negotiate is before you sign — which requires knowing the downstream impact on your ownership before you’re in the room.
Q: Is giving up 57% by Series A really normal?
Yes. The median founding team at a VC-backed company retains 36.6% after Series A — meaning they’ve given up roughly 63%. What matters is not the percentage given up in isolation, but whether your remaining stake sits within the healthy benchmark band for your sector, and whether it’s large enough to keep you motivated for the 5–7 years still ahead.
Q: When does low founder ownership become a red flag for investors?
Most institutional investors get uncomfortable when founders hold less than 35% combined post-Series A. Below 25%, it raises a serious question about whether the team has sufficient incentive to continue building. Some VCs won’t lead a round if founders are already below this threshold. The Founder Ownership Forecaster flags this as a “Control Risk” and advises tightening round sizing before Series B to avoid breaching it.
My Unicorn Club is a weekly newsletter for early-stage founders navigating the realities of building and raising. If someone forwarded this to you — subscribe here.
Tool referenced: Founder Ownership Forecaster by The VC Lens — free, 9 questions, open access.
Comments
Nothing yet. Say the first thing.
Sign in to join the conversation.