
Introduction to the Multi-leg Flow Feed
We’ve added a new feed to the Unusual Whales platform: the multi-leg flow feed.
Multi-leg trades were, of course, already flagged on the regular flow feed but we’ve now given them a dedicated feed to provide a more complete view at a glance.
With the options flow feed each line of data represents an individual execution.
When a trader puts on a spread each leg shows up on its own line of data in an otherwise unrelated looking row.
Spotting them, matching them, and doing the calculus on what the trade structure is rests entirely on.
Take this trade from July 30: 1,500 NVDA September 230/240 verticals opened, shown in the new multi-leg flow feed.
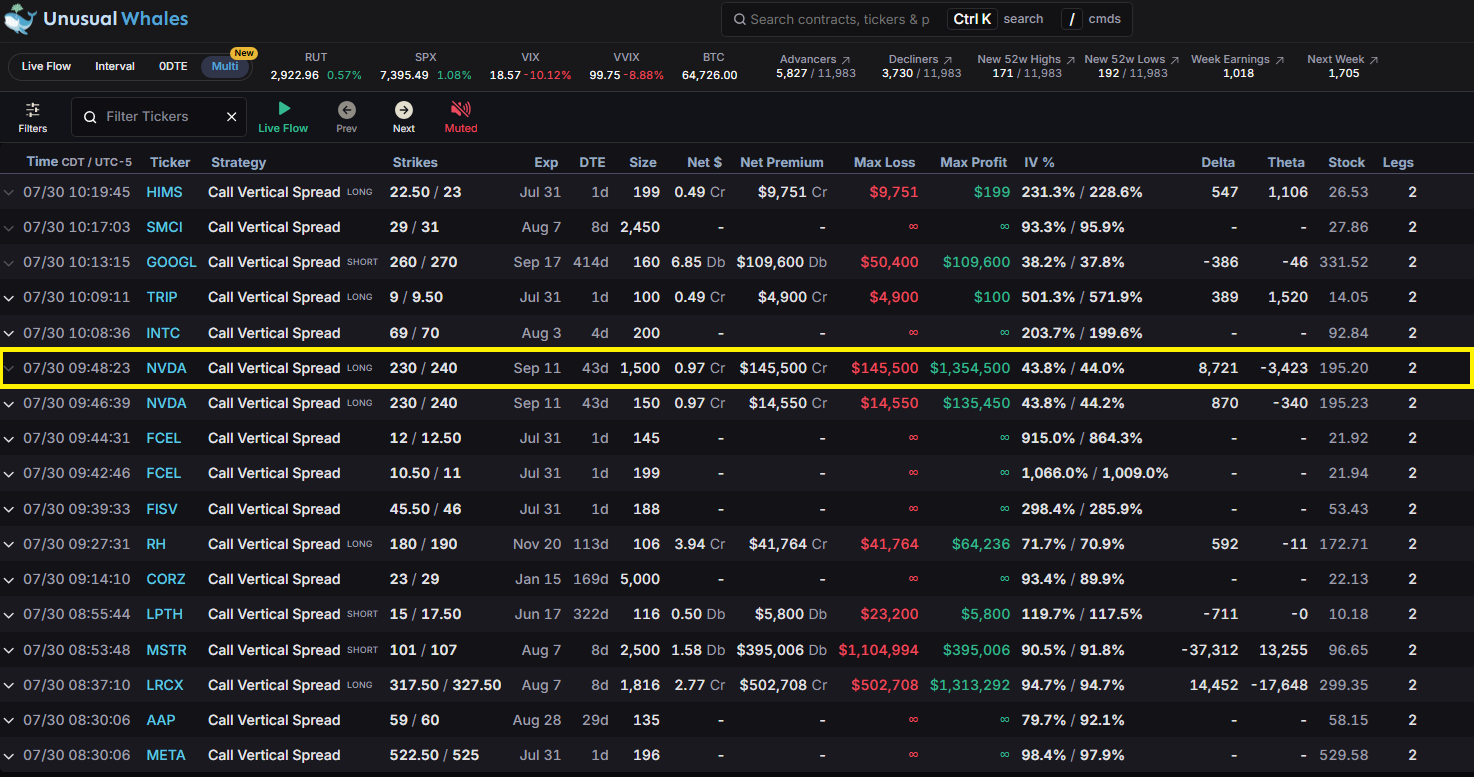
1,500 Sept 230 calls assumed long (given they filled at-or-closer-to-the-ask), and 1,500 Sept 240 calls assumed short (given that they filled at-or-closer-to-the-bid) for what would appear to be a call-debit spread, risking $145,500 to make $1,354,500.
This same activity can be seen in the regular flow feed here. Far less context, and a lot harder to consume all to come to the eventual same conclusion.
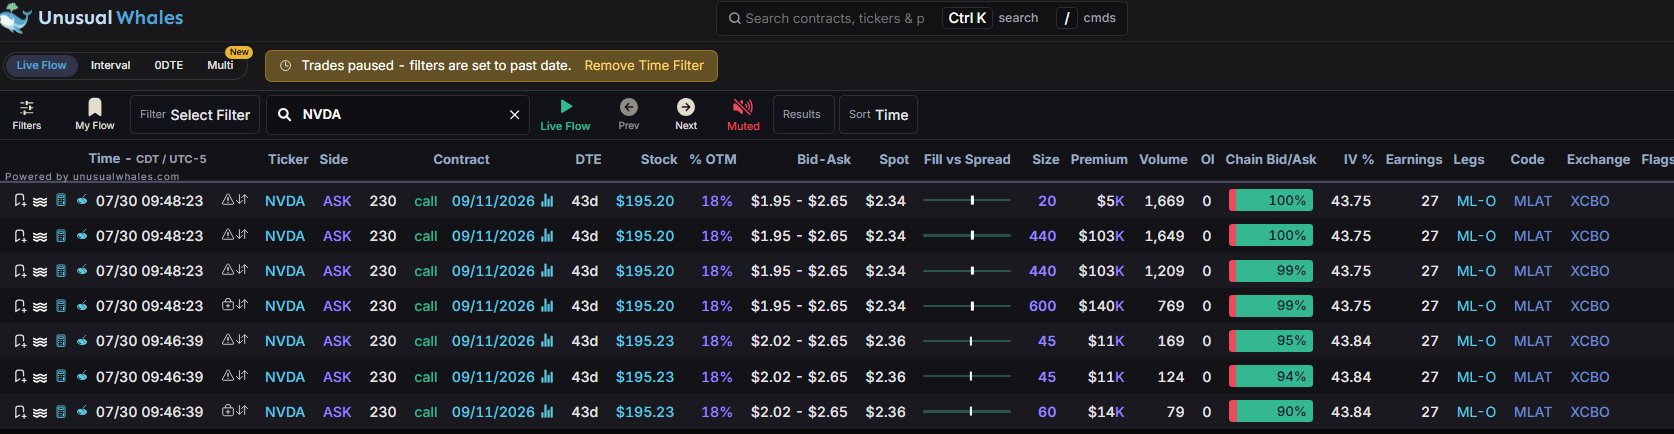
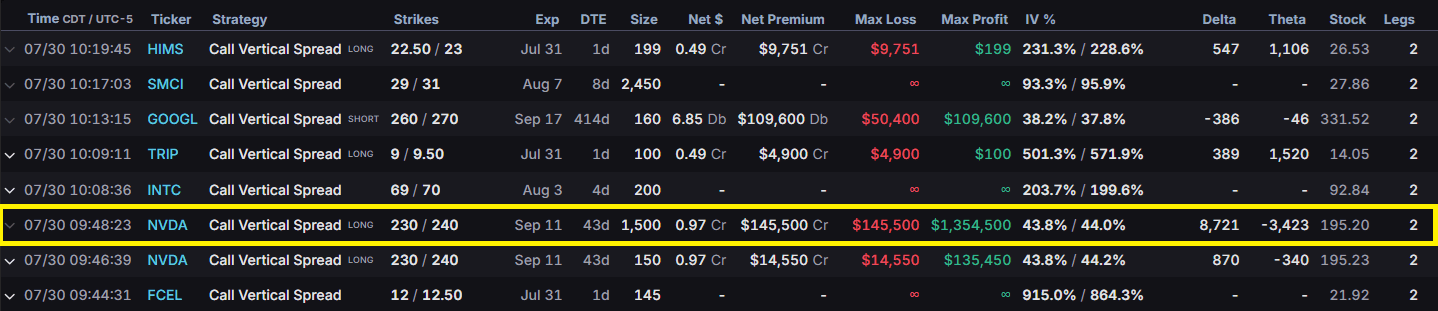
Let’s take a look at some of the data points provided and quickly go over them. Using the same NVDA trade as an example:
Ticker: the underlying stock
Strategy: the type of strategy, along with the assumed ‘direction.’ Direction (short/long) is based simply on bid/ask/fill prices.
Strikes: the strikes involved
Exp: the expiration dates involved (more than one is possible)
DTE: the days until expiration (more than one is possible)
Size: the size of the multi-leg trade (a ratio spread will display the lower value)
Net $: the presumed premium per contract
Net premium: the overall premium of the trade
Max Loss/Profit: the max loss and profit are calculated from the total position, not from one leg. Max profit with a `-` means unlimited
IV %: the implied volatility of the respective contracts/legs
Delta/Theta: the overall net delta and theta of the trade
Stock: the price of the underlying equity at the time of the trade
Legs: the total number of assumed legs
Clicking any row will open more data about the strategy with views you may already be familiar with:
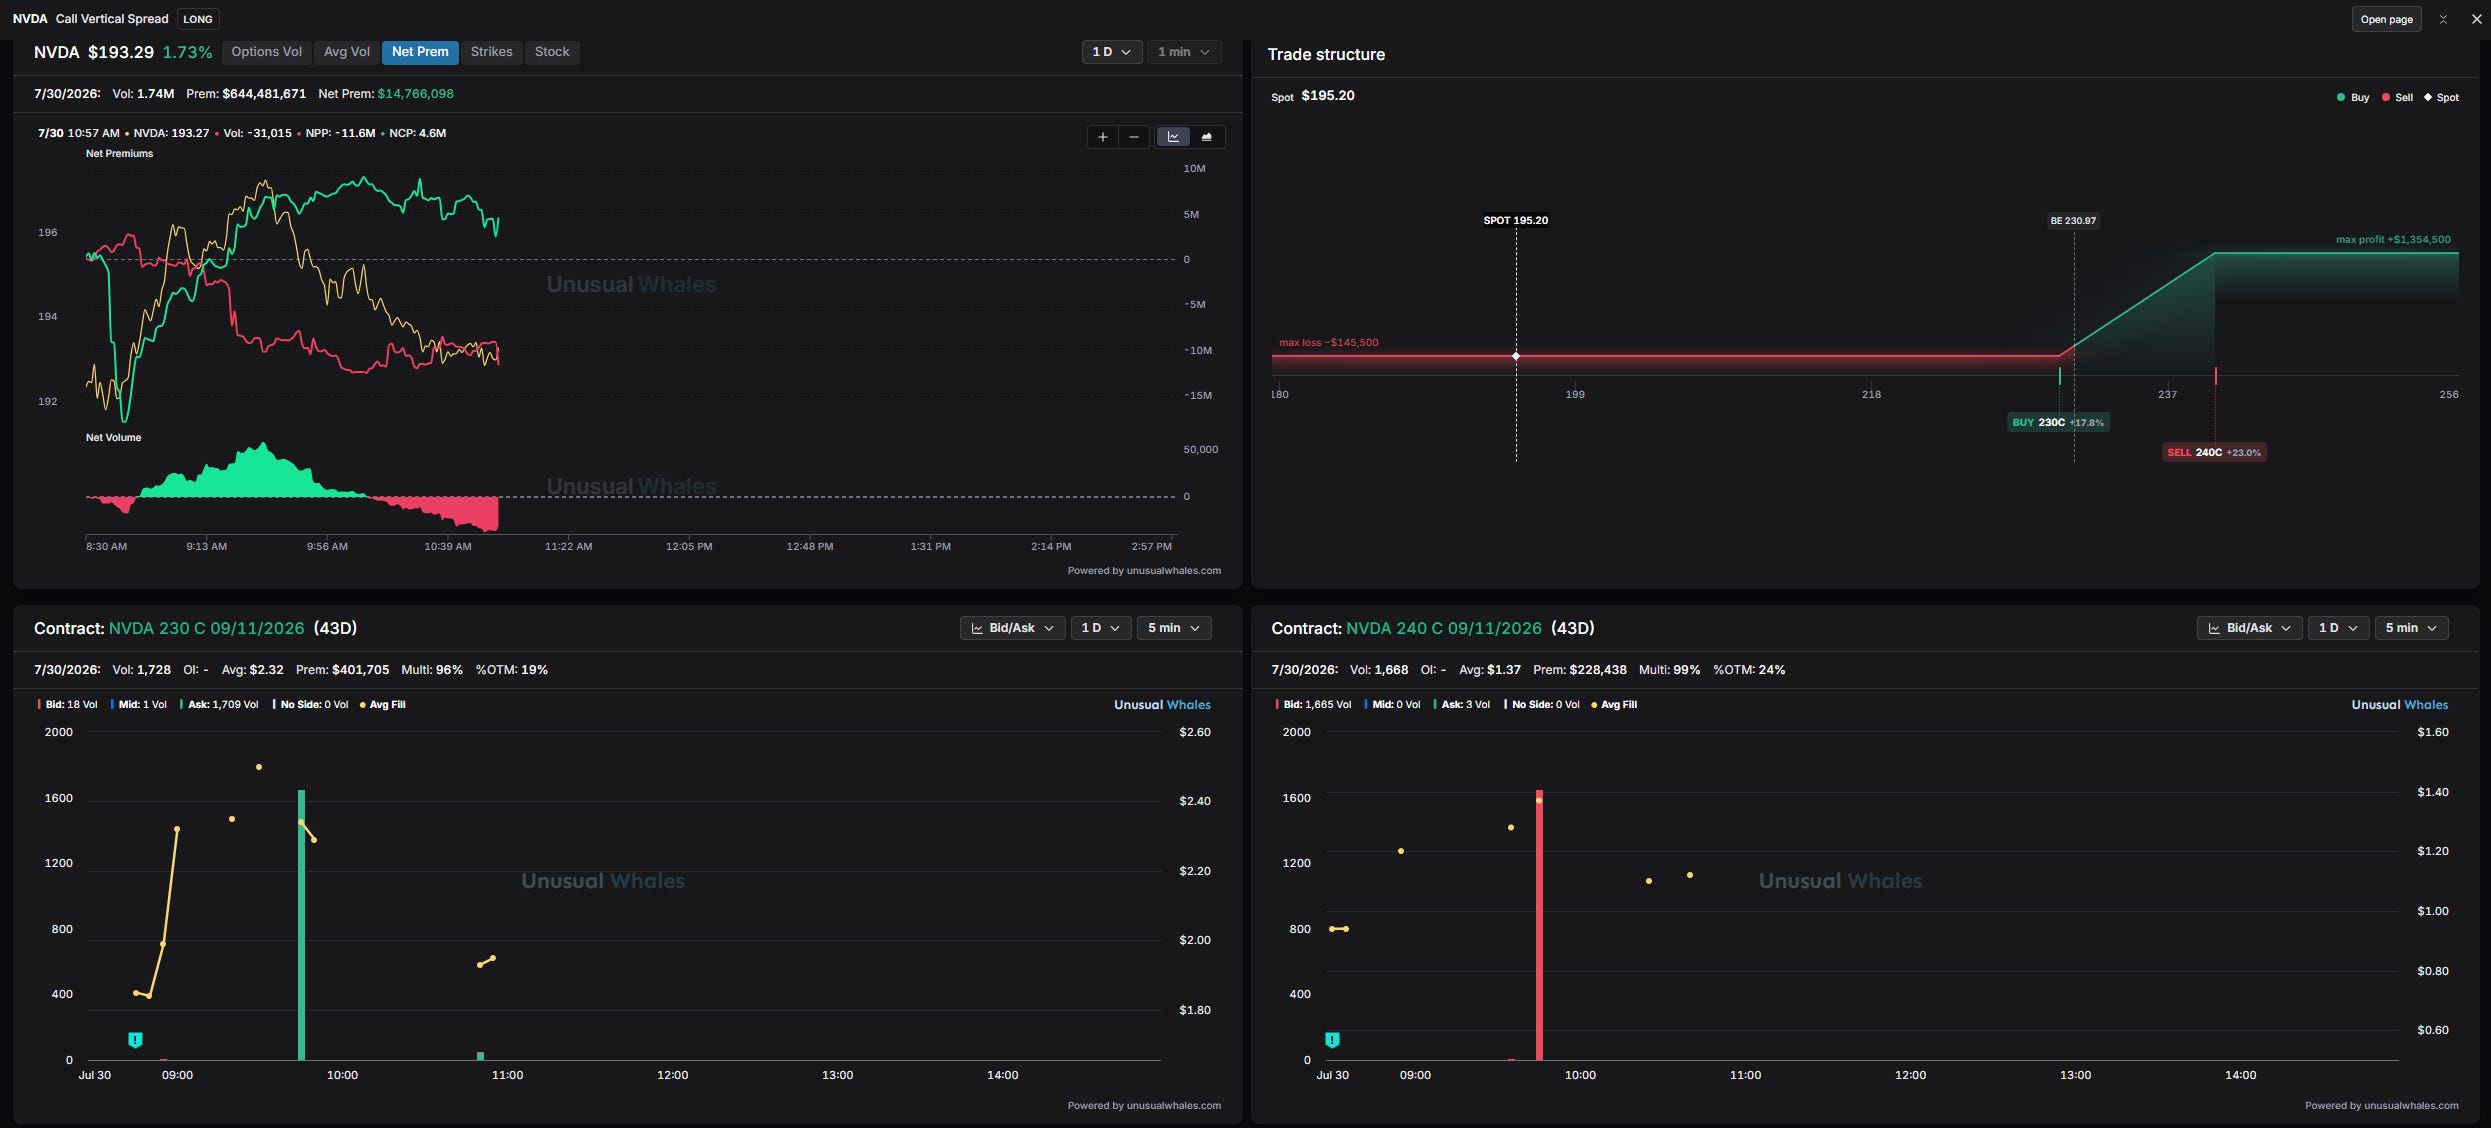
The ticker net premium chart can be seen on the top left (you can change this to view Net Premium, Average Volume, Strikes, Stock, and Options Volume)
To the right a PnL chart of the strategy, showing presumed break evens and profit/loss values.
Underneath you’ll see contract charts for all of the associated legs.
On the bottom a small feed of other trades for that ticker and respective strategy that have taken place today:
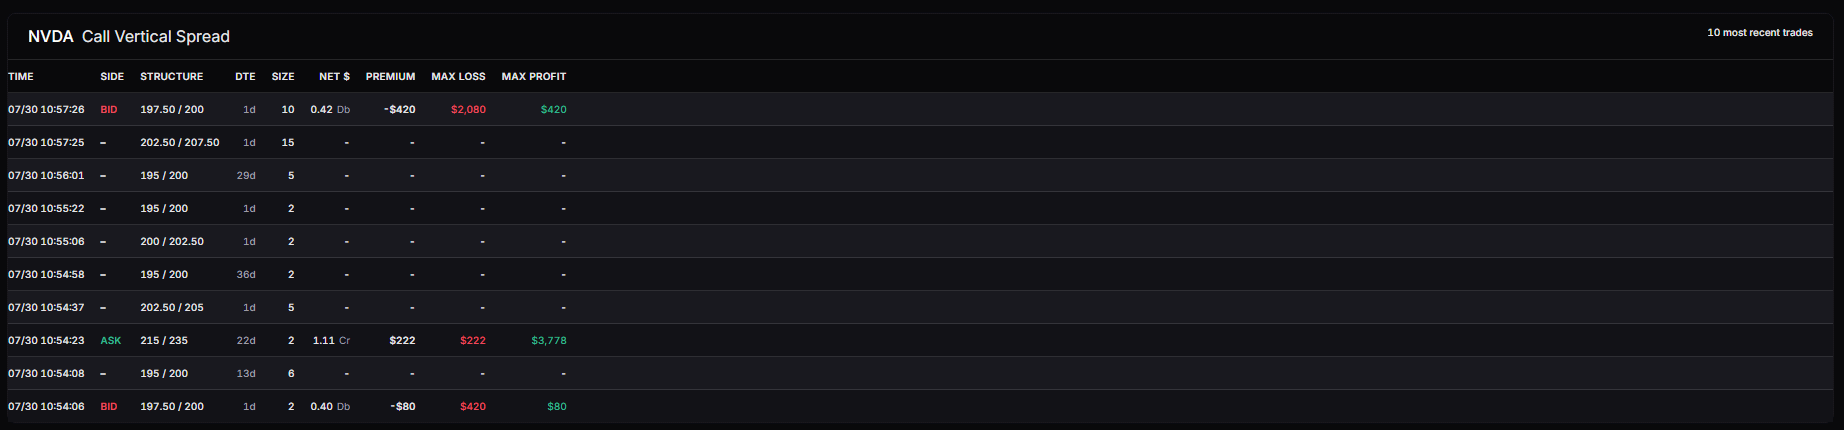
The full filter menu can be found on the left side of the feed.
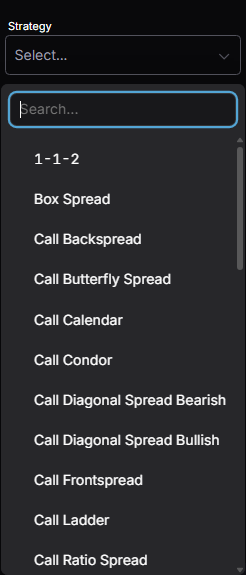
Prominently at the top is a ‘strategy’ filter, which lets you filter for any strategy you’re interested in. More than one can be selected:
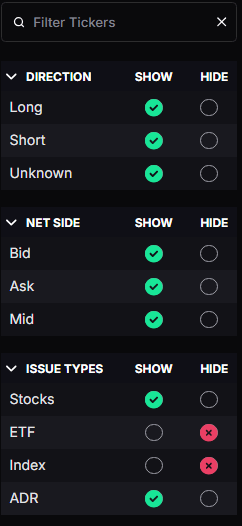
You’ll find other filters you may already be familiar with from the flow feeds.
Like with other flow data the data on the multi-leg flow feed is up for inference: the exchanges don’t send over buy/sell information with the trade data.
Again, like with regular flow reading make sure you’re putting a focus on opening trades. The ‘all opening legs’ filter might be helpful there.
Each filter will generate a unique URL, so once you’ve built a filter you like you can save it to your browser’s bookmarks to access it at anytime.
Any questions? Email support@unusualwhales.com or come by our Discord server
Comments
Nothing yet. Say the first thing.
Sign in to join the conversation.