
If Life Science REITs held an Olympics, Alexandria would be the 1992 U.S. Dream Team: Jordan, Magic Johnson, and Bird all on one roster.
Yet today, this elite franchise trades 75% off its 2022 all-time high, caught in a brutal “Biotech Winter.” At $45 per share, the market prices in permanent damage.
We see something else: irreplaceable class A life science campuses (blocks next to MIT, UCSF, and UCSD) trading at ~40% of replacement cost, with 55-140% upside to conservative normalized valuation.
We stress-test two biggest bear fears (forever biotech winter and value-destructive management), walk through the crown-jewel assets, and reveal a powerful bonus most investors miss.
Welcome to the Dream Team of life science REITs - Alexandria.
Alexandria ARE 0.00%↑ owns 36Mn Rentable SqFt (RSF) across 339 life science properties in top innovation hubs (Boston, San Francisco, and San Diego).
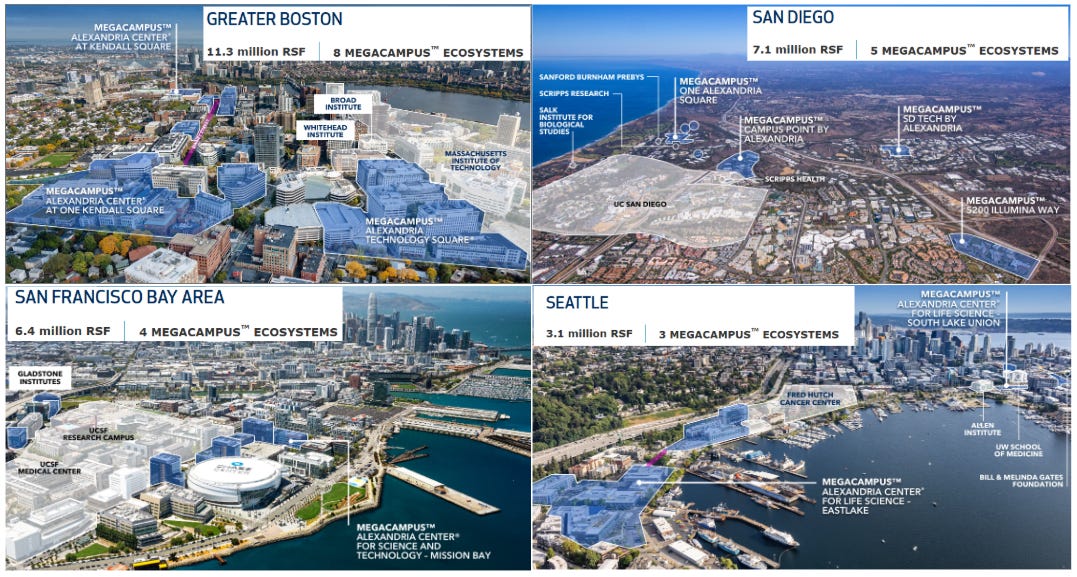
The portfolio features high-spec buildings in prime locations with strong-credit tenants, delivering high 90% occupancy and steady rent growth for years.
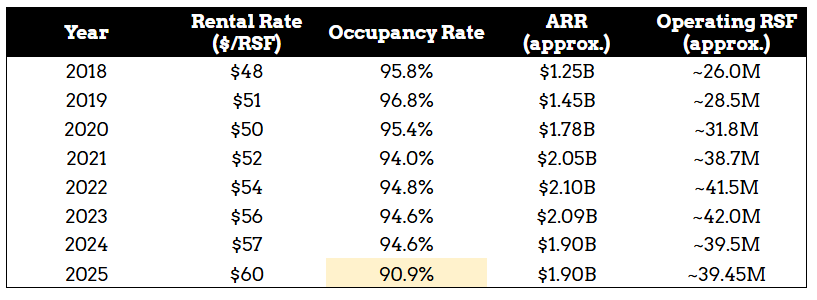
However, since 2023, the life science sector has faced headwinds from policy uncertainty, funding constraints, and oversupply. As a result, ARE has seen higher vacancy, softer leasing, and rents increasing below inflation, with current Annual Rental Revenue (ARR) at ~$1.9 billion. The table below illustrates the trend.
The stock reflects this pain: down ~63% since Jan 2020 and ~75% from its Jan 2022 ATH. Today it trades at ~$45/share ($8Bn market cap, $20Bn EV). At its peak in Jan 22, it had a $40 Bn market cap and a $50 Bn EV.
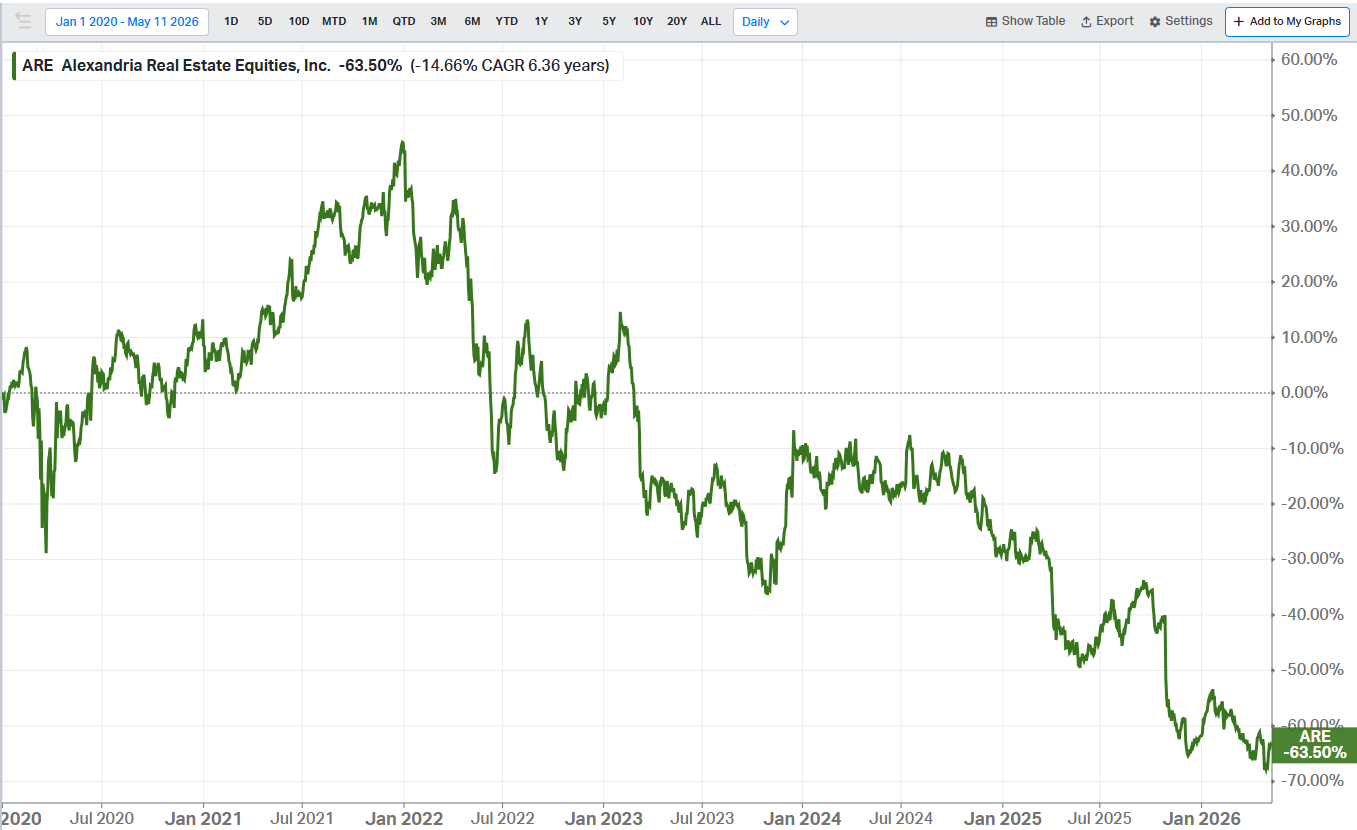
The market verdict is harsh, but not without cause.
Three forces hit simultaneously: a biotech funding winter, a hostile policy environment, and a self-inflicted overbuilding hangover.
Let us take a look.
Headwind 1 - The Biotech Funding Winter: Dedicated biotech VC funds collapsed from $30.8B in 2021 to $11.7B in 2024: fewer funds, fewer startups, fewer leases. ARE’s occupancy fell from 95% in 2022 to 87.7% by Q1 2026.
Two mitigants. First, 53% of ARE’s revenue comes from large pharma anchors: Biogen, Novartis, AstraZeneca, unaffected by the VC cycle. Second, early-stage biotech is thawing: VC deal value jumped 70.9% from Q2 to Q3 2025. But funding recovery lags lease signings by 18–36 months. The floor is forming, but the full recovery takes time.
Headwind 2 - Government Policy: In its leaked FY26 budget proposal, the Trump administration proposed cutting NIH’s $48B budget by 44%, to $26.7B, a threat to the biotech startup ecosystem that fills ARE’s building.
It did not happen. In Jan ‘26, Congress passed a bill rejecting the proposed cuts and increasing NIH's base budget to $48.7B, a $415M increase over 2025.
Researchers were rattled by freezes and cancellations of already-awarded grants and long delays in new awards, despite Congress having appropriated the funds. A startup waiting on a frozen grant cannot sign a lease in the meantime. The headline risk is gone, but the hangover takes time to clear.
Headwind 3 - self-inflicted overbuilding: During the Y20–21 euphoria, ARE grew its development pipeline to over 5.6 million RSF. It was not alone; developers across key markets broke ground in lockstep. Lab space supply grew 7.5x since 2021 even as demand dropped approximately 60% from its peak. Boston-wide lab vacancy hit 30% by late 2025.
ARE was paying over $ 200 M in annual interest on $4.2B in pre- and under-construction assets producing zero NOI.
ARE took $2.2B impairment charges in 2025. The damage is done. The question now is whether its strategic reset, outlined at Investor Day 2025, is real and durable. We will discuss the execution scorecard in a later section.
At $45/share, ARE trades at a compelling discount:
Cap rate: Using 7% and 5.5% cap rates value the stock at $70 and $109 per share.
Replacement cost: Even at 50% of rebuild cost, it would imply $85 per share.
While both estimates present meaningful upside potential (55% - 140%), they remain conservative, AND exclude:
3Mn RSF development pipeline ($2Bn invested and ~2/3 complete)
~$1Bn venture portfolio at cost ($1.5Bn carrying value)
At 3Bn cost, that equates to ~$20/share.
Alexandria’s real edge is unmatched location and quality. Its flagship campuses sit directly adjacent to America’s top research institutions.
Kendall Square @ MIT/Cambridge: The most innovative square mile on earth. Alexandria dominates with a 5.4M RSF Campus. While Greater Boston vacancy hit 30%, Kendall Square has held up significantly better and commands premium rents.
Mission Bay @ UCSF/San Francisco: Prime assets next to UCSF. These trade in a clearly stronger tier than the weak broader market. Recent sales to UCSF at $1,650/sqft highlight the demand.
University Town Center @ UCSD/San Diego: ARE dominates this submarket with 99% occupancy (mid-2025), way above San Diego’s 30% vacancy, backed by long-term deals with top tenants.
There is only one MIT, one UCSF, and one UCSD. The ecosystem advantage is paramount.
Two main concerns dominate the narrative:
Biotech’s Forever Winter: Will prolonged funding pressure, policy risk, and oversupply drive occupancy and rents materially lower, eventually threatening the balance sheet?
Value-Destructive Management: Aggressive expansion during the boom years led to rising leverage and a 45% dividend cut. Will / can management turn around?
We will walk through Alexandria’s key assets, discuss the valuation math, address both bear cases, highlight its downside protection, our position plan, and more.
Among the top 10 American life science research universities (listed below), Alexandria has campuses in 8 of them, with a high concentration in Greater Boston, the San Francisco Bay Area, and San Diego, covering 4 of the top 5.
Harvard University (Boston/Cambridge)
MIT (Boston/Cambridge)
Stanford University (Bay Area)
Johns Hopkins University (Baltimore)
UC San Diego (San Diego)
University of Pennsylvania (Philadelphia) - NO ARE properties
UC San Francisco (Bay Area)
UC Berkeley (Bay Area)
Cornell University (Ithaca, NY + NYC ties) - NO ARE properties
University of Washington (Seattle)
Since 1997, Alexandria has been the dominant private landlord in Kendall Square. Its 5.4M RSF MegaCampus sits directly adjacent to MIT, city block after city block of premium life science real estate. How big is it? Picture a town of 10,000 people, if all fit into ARE’s Kendall Campus, each could own a 540 sq ft apartment!
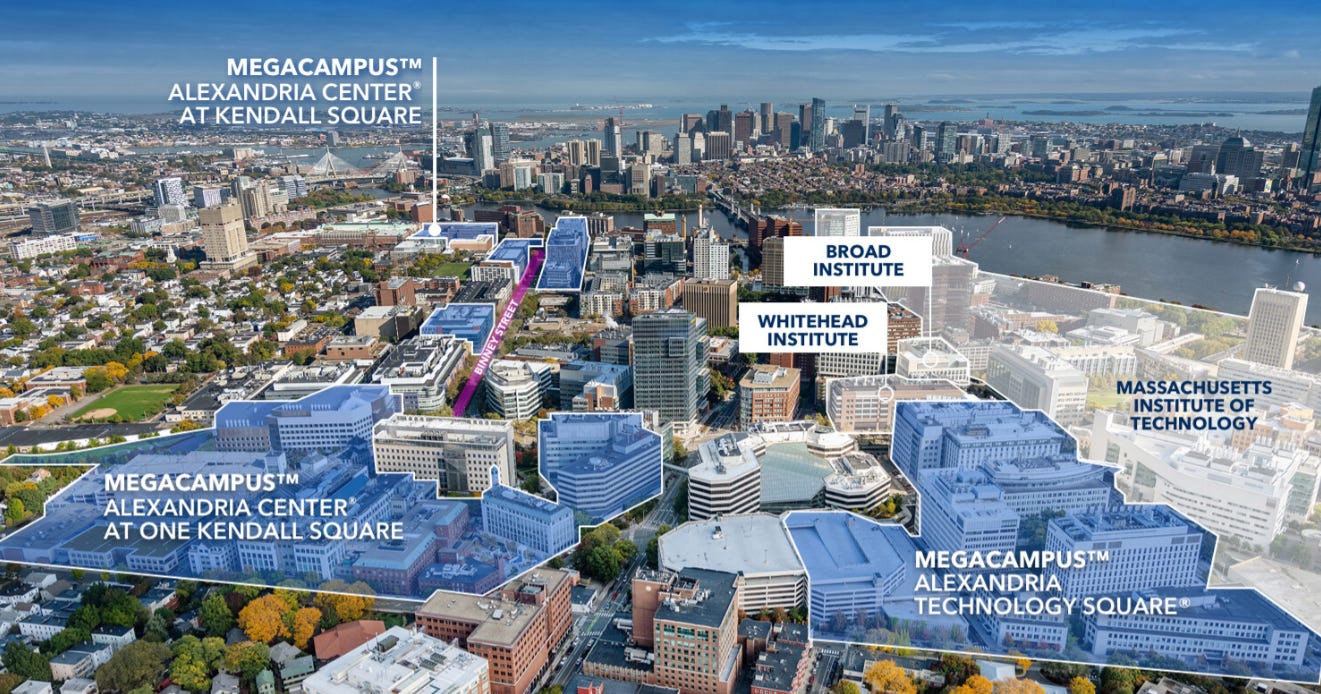
This is ARE’s crown jewel and highest-quality market. While Greater Boston lab vacancy reached 30% by late 2025, East Cambridge / Kendall Square has held up significantly better (20% vacancy) and commands a clear premium:
Market rents in East Cambridge: $95–96/sqft (15.9% above broader Boston)
ARE’s trophy MegaCampus assets command even higher rents
The portfolio is anchored by high-credit tenants including Biogen, Novartis, Genentech, and AstraZeneca. Recent transactions (including non-core asset sales) confirm strong underlying value even in today’s challenging market.
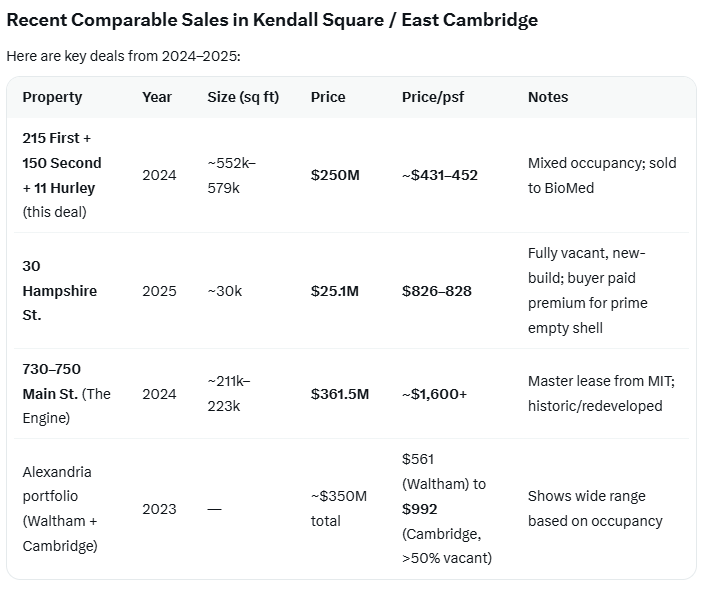
Its center in Kendall Square was recapitalized at $2.3k/sqft (the highest per-square-foot price for any office/lab sale in the US). The neighboring 125 Broadway was sold to Boston Properties for $2.2k/sqft, and Alexandria bought One Kendall Square (OKS) for $1.1k/sqft in 2016.
Some recent comparable sales below:
Mission Bay stands apart from the broader San Francisco market (79% occupancy). Located directly adjacent to UCSF, one of the world’s top biomedical research institutions, ARE’s Class A+ assets operate in a premium tier with stronger demand and higher rents ($80–110/sqft).
In 4Q25, ARE sold two Mission Bay properties (409 & 499 Illinois Street) to UCSF at $1,650/sqft, implying a ~6% cap rate, supporting our valuation framework of 5.5% to 7% cap rate range.
ARE dominates the premier UTC / Campus Point submarket, which stands out from broader San Diego’s weakness.
While San Diego lab vacancy hit 30%, UTC vacancy is lower at 22%, and ARE’s portfolio runs at an exceptional 99% occupancy (mid-2025).
Highlights:
Prime location adjacent to UC San Diego
Class A assets with institutional-grade tenants
In 3Q25, signed a 16-year, 466k RSF build-to-suit lease with Novartis — a long-duration, near-zero credit risk deal that deserves a tighter cap rate
This submarket consistently demonstrates superior stability and demand compared to the rest of San Diego.
While average San Diego life science cap rates have expanded 150 bps from the 2021 peak (4.5–5.0%) to 6.0–6.5% today, Alexandria’s portfolio, with high-credit tenants, long-term leases, and superior occupancy (99% at Campus Point) deserves a tighter cap rate. Our valuation range of 5.5% – 7.0% is conservative. A 7.0% cap rate represents a significant discount to market, while 5.5% remains realistic.
Let us get to the valuation next.
A cap rate (capitalization rate) is a common measure to value commercial Real Estate:
Property Value = Net Operating Income (NOI) / Cap Rate
NOI = ARR – property operating expenses
ARR: Annual Rental Revenue (contractual rent)
For Alexandria, operating expenses are ~10% of ARR, so NOI ≈ 90% of ARR.
Note: We use ARR (instead of total revenue) when modeling NOI, as Revenue includes Tenant Recoveries, which are pass-through costs (taxes, insurance, utilities, etc.) paid by tenants. ARR provides a cleaner basis for estimating NOI. We will explain that in more detail in a later section.
Applying it to ARE:
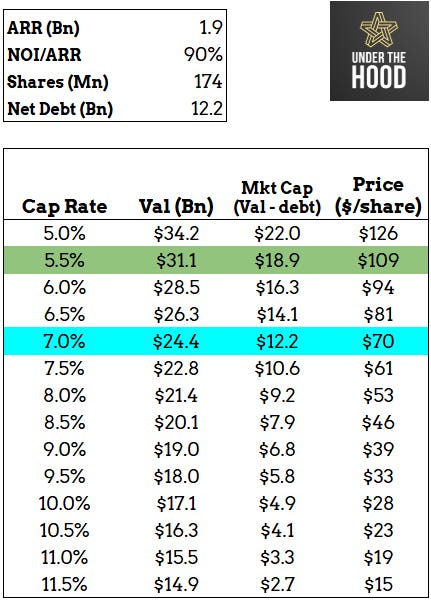
Current ARR = $1.9 billion, NOI ≈ $1.71 billion (ARR x 90%)
Note: ARE’s reported cash NOI for 2025 is $1.98Bn. My $1.7Bn model (ARR*0.9%) understates the true cash NOI by $270Mn. We retain the $1.71Bn figure as a conservative anchor.
Using a cap rate range of 5.5% – 7.0%:
At 7.0% cap rate: $24.4 billion property value (~$70 per share)
At 5.5% cap rate: $31.1 billion property value (~$109 per share)
The review of ARE’s three key markets (Boston, San Francisco, and San Diego) above shows that a 7.0% cap rate is cautious given the asset premium, while 5.5% remains a realistic, moderate rate when normalized.
This gives a fair value range of roughly $70 – $109 per share.
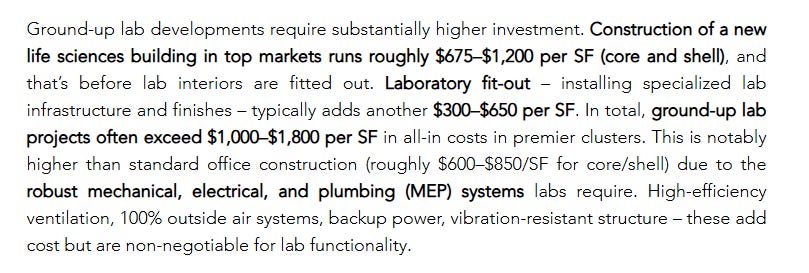
Class A life science buildings are expensive to build. All-in total costs in top markets (Boston, San Francisco, San Diego) typically range from $1,000 to $1,800 per RSF, significantly higher than standard office space.
Key benchmarks:
CBRE 2022 data: $1,000 – $1,800/RSF (costs have risen since)
ARE’s own projects: ~$1,500/RSF (2Mn RSF at $3Bn cost at completion as of 1Q26)
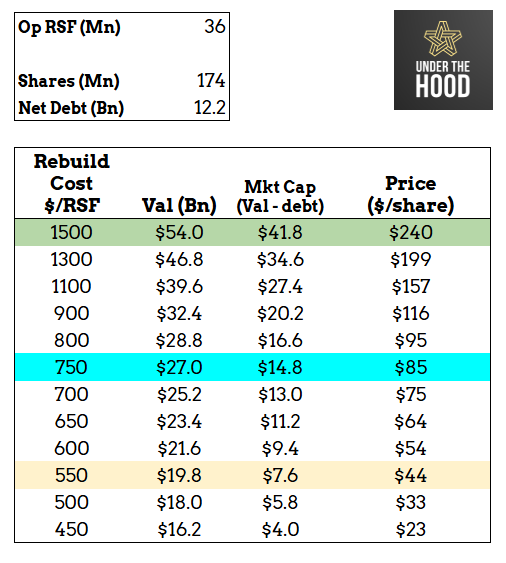
Valuation at replacement cost:
36 million RSF × $1,500 = $54 billion → ~$240/share (~ARE all-time high levels)
At 50% of replacement cost: $85/share
At today’s price, the market is valuing ARE at ~$550 per RSF, well below any realistic construction cost, excluding land acqusition.
I stress-tested under 3 “Biotech Forever Winter” scenarios (Bad, Worse, and Worst), assuming prolonged sector headwinds for the next three years.
Even in the Worst Case, assuming 100% of expiring leases are vacated, Alexandria still generates positive free cash flow:
ARR falls ~25% to ~$1.42 billion by 2029
Annual FCF remains ~$500 million
Fully covers all interest and principal payments (~$1.1 billion over 3 years)
Leaves ~$105 million in excess FCF at the trough
In all scenarios, ARE maintains positive free cash flow and comfortably services its debt. Alexandria is more resilient than the market currently believes. These “Forever Winter” headwinds, while looking depressing, once normalized, ARE’s premium assets should re-rate.
3 Scenarios (in 3 years):
Bad: 50% of leases expiring (vacated); 50% renewed at an average 25% discount.
Worse: 70% of leases expiring (vacated); 30% renewed at an average 30% discount.
Worst: 100% of leases expiring (vacated), no renewal!
4.6%, 10.5%, and 10.1% (as % of ARR) leases will expire from 2026 to 2028. (as of 1Q26 supplemental info)
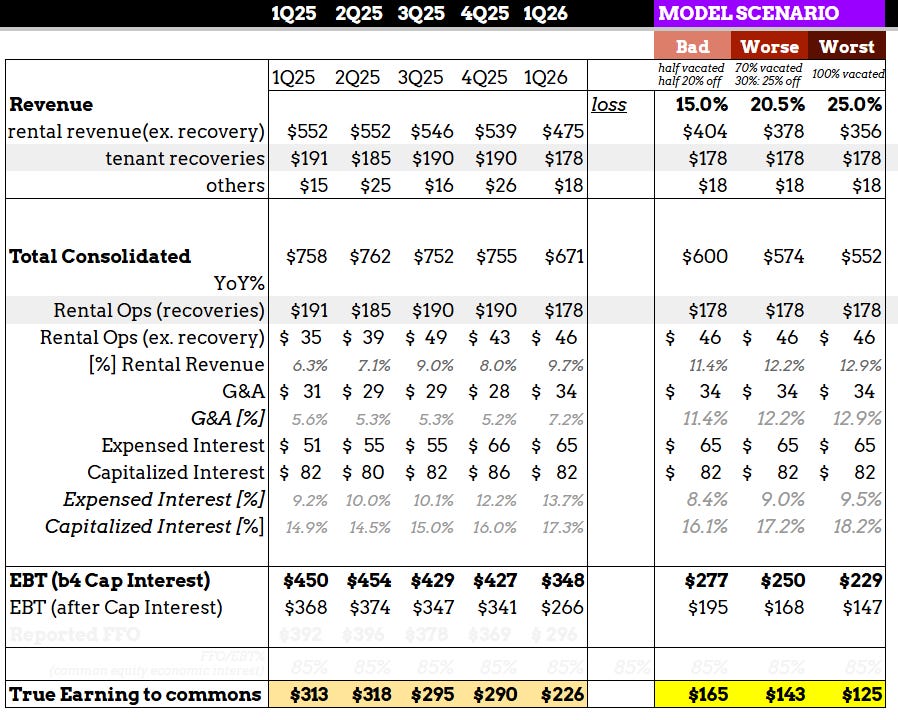
Declining Rate: 1Q26 reported 15% discount in the lease rate at renewal. The “Bad” scenario assumes the decline trend continues for 3 more years and models 15%, 25%, and 30% discount rates for 2026, 2027, and 2028, resulting in an average 25% discount at renewal over the next 3 years.
25% ~= (4.6% 15% + 10.5% * 25% + 10.1% * 30%) / (4.6% + 10.5% + 10.1%)
2025 has a renewal rate at 74% (2.5Mn renewed out of 3.4Mn expiring), consistent with the historical average of 75%-80%. The “Bad” scenario assumes the renewal rate continues to decline to 50%; the “Worse” scenario, to 70%; and the “Worst” scenario, pushed to the extreme, to 100% vacated.
Even in the “Worst” scenario, where all of its next 3-year expiring leases are vacated, its ARR (EoY’28) drops to $1.42Bn (from $1.9Bn). It remains profitable and generates ~$125Mn in FCF/quarter, ~$0.5Bn per year.
The stress test confirms that Alexandria is protected by its high-quality, cash-generating assets and a thoughtfully staggered lease expiration schedule, giving it substantial resilience against severe, prolonged headwinds.
The biggest risk to the “distressed quality assets at a discount” thesis is value-destructive management. Alexandria’s past actions warrant close review.
Background: During the 2020–2023 post-COVID boom, management aggressively expanded, growing the development pipeline to over 5.6 million RSF and pushing total operating + under-construction space above 45 million RSF.
This over-expansion coincided with the sector’s sharp downturn (funding winter + oversupply), resulting in:
Occupancy dropped from ~95% to 87.7% (1Q26)
Leverage rose to 6.8x net debt/EBITDA
45% dividend cut in December 2025
This forced the strategic reset on Investor Day 2025. Plans are:
Non-core asset Disposition: targeting $2.9B of non-core asset sales
Reduce CapEx: by $300M+
Reduce capitalized interest: from $335M in 2025 to $250M
Lower leverage: to 5.6x - 6.2x by 4Q26 (from 6.8x in Q1 2026)
Reduce G&A: sustain ~50% $51M saved in 2025
Focus on Occupancy Recovery: prioritize recovery over new development
Progress Reality-Check
Management has largely delivered on its 2025 Investor Day reset plan in 4Q25 and 1Q26, meeting or exceeding most targets. The main disappointment has been continued occupancy pressure, primarily driven by the broader market rather than execution shortfalls. Scorecard below:
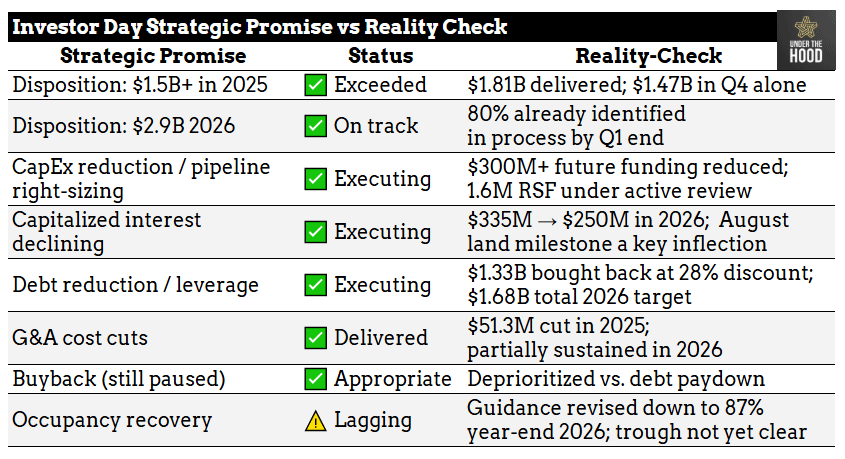
Let us double click on the declining occupancy rate and disposition:
On Occupancy:
4Q25: FY2026 guidance 87.7% -89.3%, lower than prior expectation, same property NOI projects to decline 7.5-9.5% in 2026. Trough hasn’t yet been reached.
1Q26: FY2026 occupancy guidance (midpoint) revised from 88.5% to 87%. (negatively impacted by vacant assets slated to sell showed leasing interest, and being retained, sensible despite poor optics)
On Disposition:
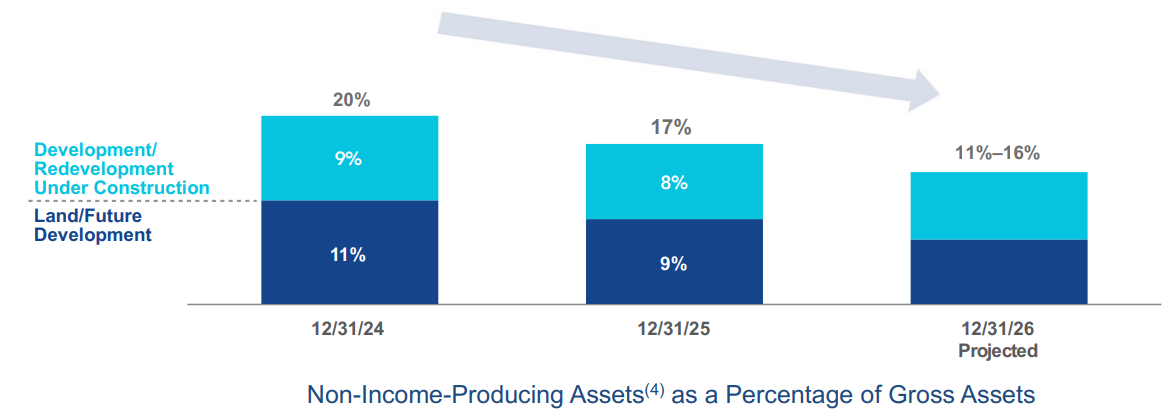
Note the significant progress made on non-income-producing assets disposition (as a % of gross assets from 20% in’24 to 17% in ‘25 to 11-16% in ‘26)
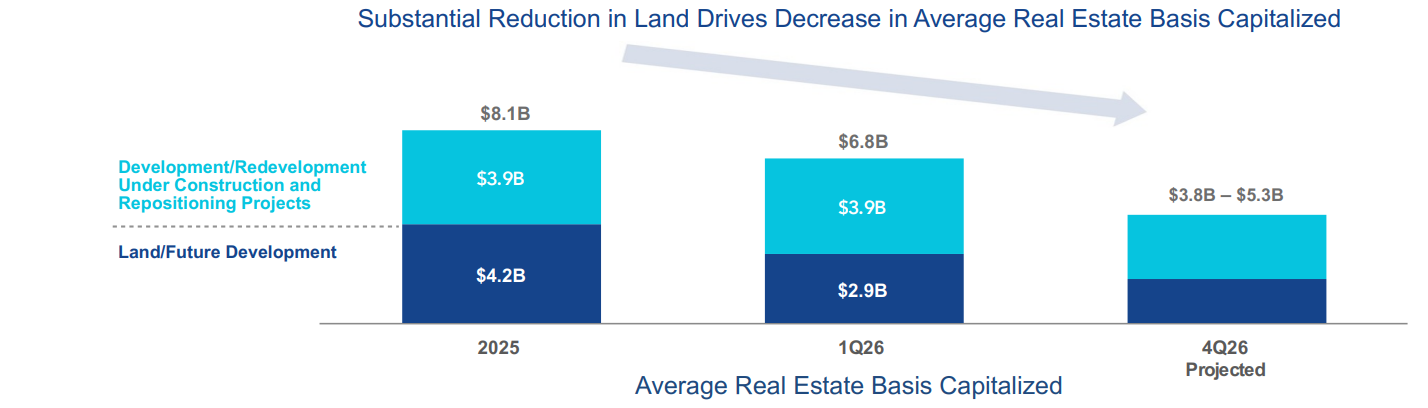
And even more aggressive on land/future development reduction. mid-point target is to sell ~3Bn worth of assets (mostly non-income producing ones).
Overall, management appears committed and is executing the reset in good faith.
At $45/share (~$8Bn market cap, ~$20Bn EV), Alexandria is trading at depressed levels:
Its 35.8Mn RSF is valued at $560/sqft, 30–56% of current rebuild cost ($1,000–$1,800/sqft) for comparable buildings.
Based on LTM NOI of ~$1.7Bn, the portfolio is priced at an 8.5% cap rate, a discount of 200+ bps to current market cap rates in its core markets.
The market is pricing in perpetual decline and worsening occupancy. However, even under a 3-year “absolute winter” scenario, ARE still generates positive free cash flow and comfortably covers all debt obligations.
There is one more thing the market ignores.
That’s ~$16/share in bonus value from its venture portfolio ($7/share) and development pipeline ($9/share) at conservative estimates. Let us briefly discuss it.
Launched in 1996, Alexandria Ventures is ARE’s strategic VC platform in early-stage life science companies. Many later become tenants in ARE’s lab properties, a valuable strategic flywheel.
Portfolio Breakdown (as of EoY’25):
~$0.5 Bn reported at fair value (marked-to-market).
~$1.0 Bn held under equity method or cost basis (privately held companies with limited or no mark-to-market).
Valuation: Taking the $0.5B MtM at face value and applying a 50% discount to the $1.0B illiquid portion yields an adjusted value of ~$1.0Bn.

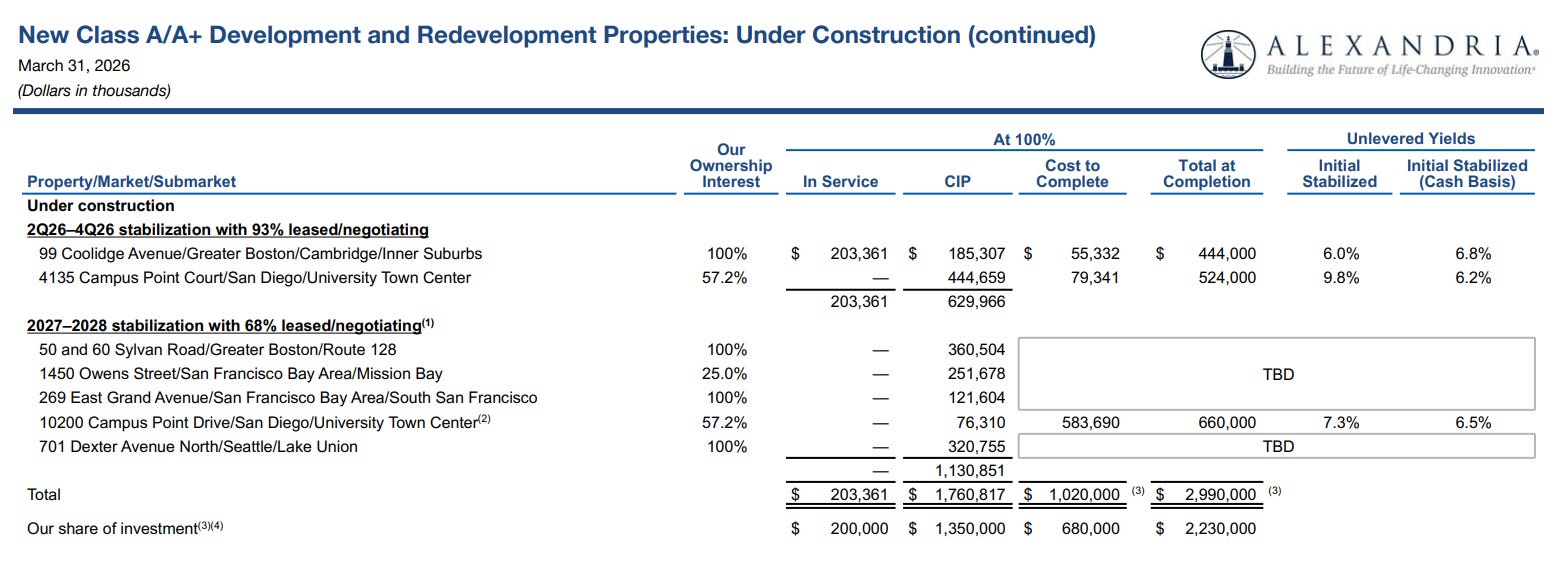
Total Under Construction: 3.5M RSF (reduced from 4.2M RSF in 3Q25)
Breakdown & Valuation:
2026 Deliveries: 0.7M RSF, ($100M to complete, 0.6Bn spent), $75M annualized NOI, 93% pre-leased. At 8% cap rate: ~$0.85Bn value. ($0.75 / 8% - 0.1)
2027–2028 Deliveries: 1.3M RSF, 68% pre-leased, $93M annualized NOI. ($0.9Bn already spent, 0.6Bn to go)
→ At 8% cap rate = 0.5Bn (0.93/8% - 0.6)Assign 0 value to the future pipeline.
Total Estimated Pipeline Value: $1.35Bn
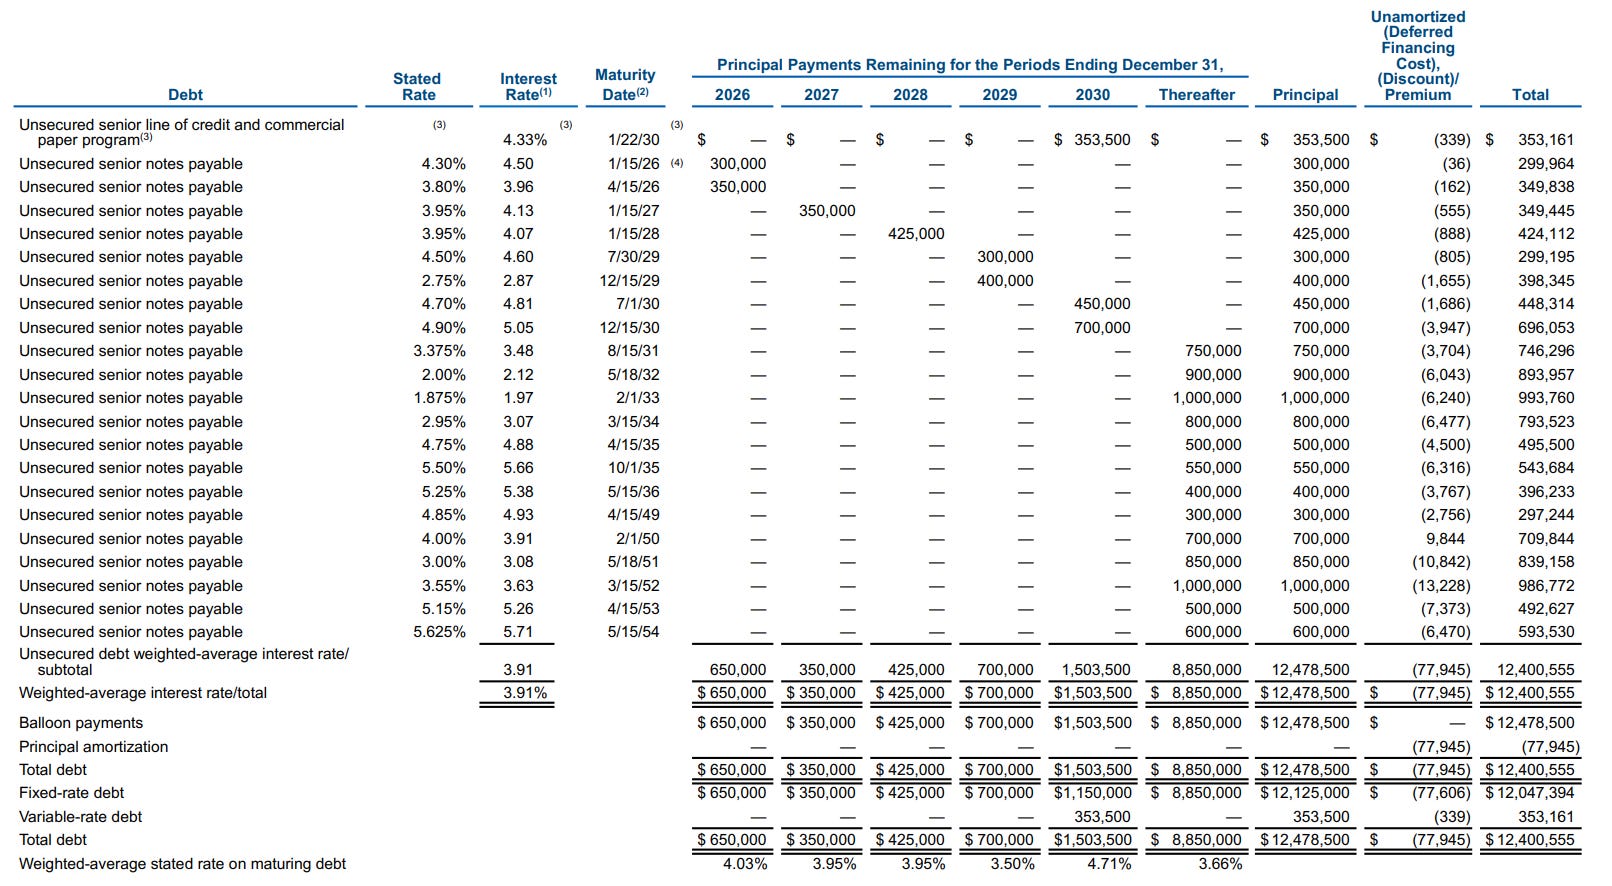
Alexandria’s $20Bn enterprise value includes $12 billion in debt (60% loan-to-value at current depressed pricing). While this appears high on the surface, it is primarily a function of the compressed stock price rather than excessive leverage.
The debt itself is of unusually high quality:
Average remaining term: 12 years (2x the S&P 500 REIT average)
Average interest rate: ~4.0%
Maturities: Well-laddered at $350–700 million per year from 2026–2029
Importantly, these maturities are comfortably covered by free cash flow, even under the conservative stress test outlined earlier.
I’ve built a 3/4 full position (full position = ~5% of portfolio) with an average cost of ~$45/share, purchased between $40 and $50.
I recently added at $40 / share and supplemented the position with a synthetic long options: Buy Jan 2027 $45 Call + Sell Jan 2027 $35 Put at a minimum cost ($30-60 per contract pair), as discussed in the Substack chat on April 29.
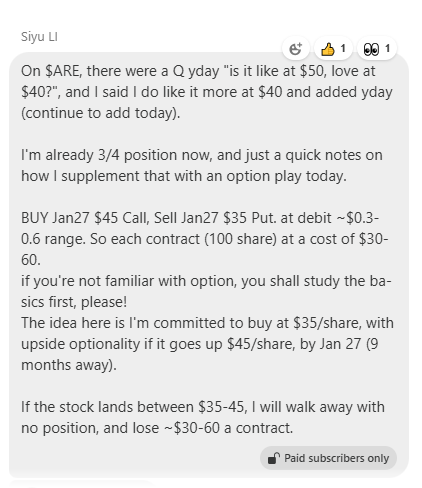
I’m looking to add to the position with an option synthetic long (e.g., buy $50 call, sell $40 put in Jan 27 or 28).
If all headwinds are permanent, ARE at $45 is not cheap.
The NIH budget risk is now materially lower; Congress has spoken.
The biotech funding recovery is underway at the top of the market, with early-stage formation lagging but directionally improving.
The overbuilding hangover is peaking, and ARE’s own pipeline is being right-sized.
None of these resolves overnight. But each has a visible, identifiable path toward normalization.
What the market is pricing incorrectly is the distinction between ARE’s durable anchor tenant base, 53% of revenue, investment-grade, unaffected by the funding winter, and its cyclical early-stage biotech exposure, where all the pain is concentrated, and recovery will come from.
At $45/share, the market is pricing the floor as if it does not exist and the upside as if it never returns. That is the mispricing on which this thesis is built.
There is one more thing, while I don’t have a crystal ball on when recovery arrives, what’s clear is that time is on Alexandria’s side. Its elite assets, staggered leases, and fortress balance sheet position it to weather biotech winters better than peers.
No posts
Comments
Nothing yet. Say the first thing.
Sign in to join the conversation.