
Oil has traded below zero once. Nobody lost a barrel that day.
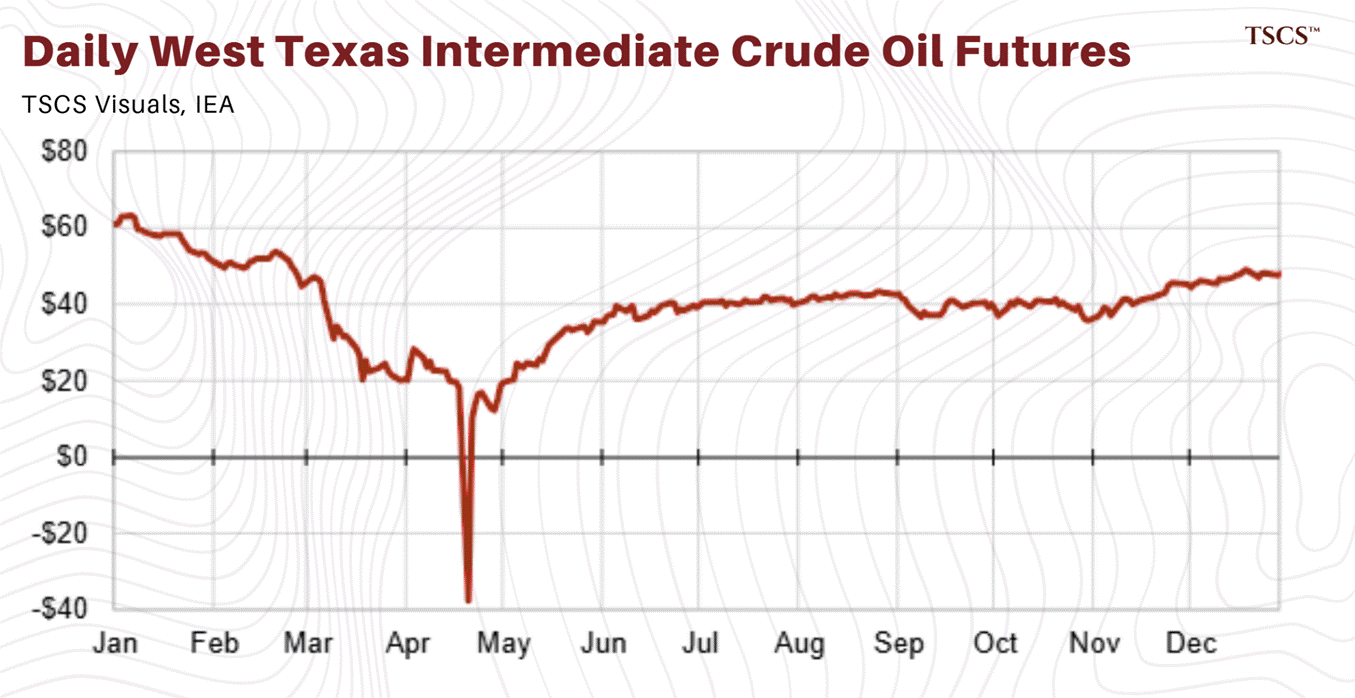
No war started on 20 April 2020. No field flooded, no refinery blew up, no cartel met in Vienna (surprisingly). Supply was what it had been the previous Friday, and demand was the same pandemic-flattened puddle it had been all month. And yet, at settlement that afternoon, oil settled at -$37.63, which is to say that grown professionals were paying strangers nearly $40 a barrel to please take their oil.
You filed that under pandemic weirdness and moved on. Everyone did.
The people who understood what was breaking have been profitting off that realization ever since. In fact, several of them will appear later in this article with 10 figure profit lines.
You might think you understand how the oil market works, but let me fill you in on what you probably don’t know.
You don’t know 76% of the world’s oil supply is water bound, 79.8m bbl/d (barrels a day) out of a 104.4m bbl/d oil market, per EIA.
You don’t know that the largest oil chokepoint on earth isn’t even the Strait of Hormuz. It’s a strait in asia called the Strait of Malacca which carries 23.2m bbl/d (Hormuz does 20.9m bbl/d).
You don’t know that the G7 price ceiling on Russian oil is enforced by insurance paperwork issued out of London. Or that when the insurance contrantracts changed this spring, Washington built a reinsurer worth $40 billion and as of May it had written literally ZERO policies.
You don’t know that the war-risk for a single Hormuz transit went from 0.25% of hull value in Feb to 10% of hull value at its peak, and now sits at 3-8% as I write. To put that into perspective, on a large tanker it would cost $3-8 million per voyage. You have to pay that before the ship moves btw.
You don’t know that the same Russian barrel transiting to India instead of Rotterdam consumes 7x the shipping, because the voyage is 7x longer. This infers (if you haven’t figured it out already) that a sanctions regime can manufacture a tanker bottom without the world changing its consumption habits.
You also (probably) didn’t know that the US Strategic Petroleum Reserve now sits at its lowest level since 1983.
And finally, you definitely didn’t know that the world tanker fleet is simultaneously the oldest it’s been in a long time and is carrying its largest orderbook since 2011. Isn’t that crazy? Both of these things are true at once. Which means the trade many amateurs discovered in 2026 comes with an expiry (which is determined by shipyards in Korea and China). It’s public for anyone who bothers to look.
Nobody looks. Shipping has spent 200 years proving this.
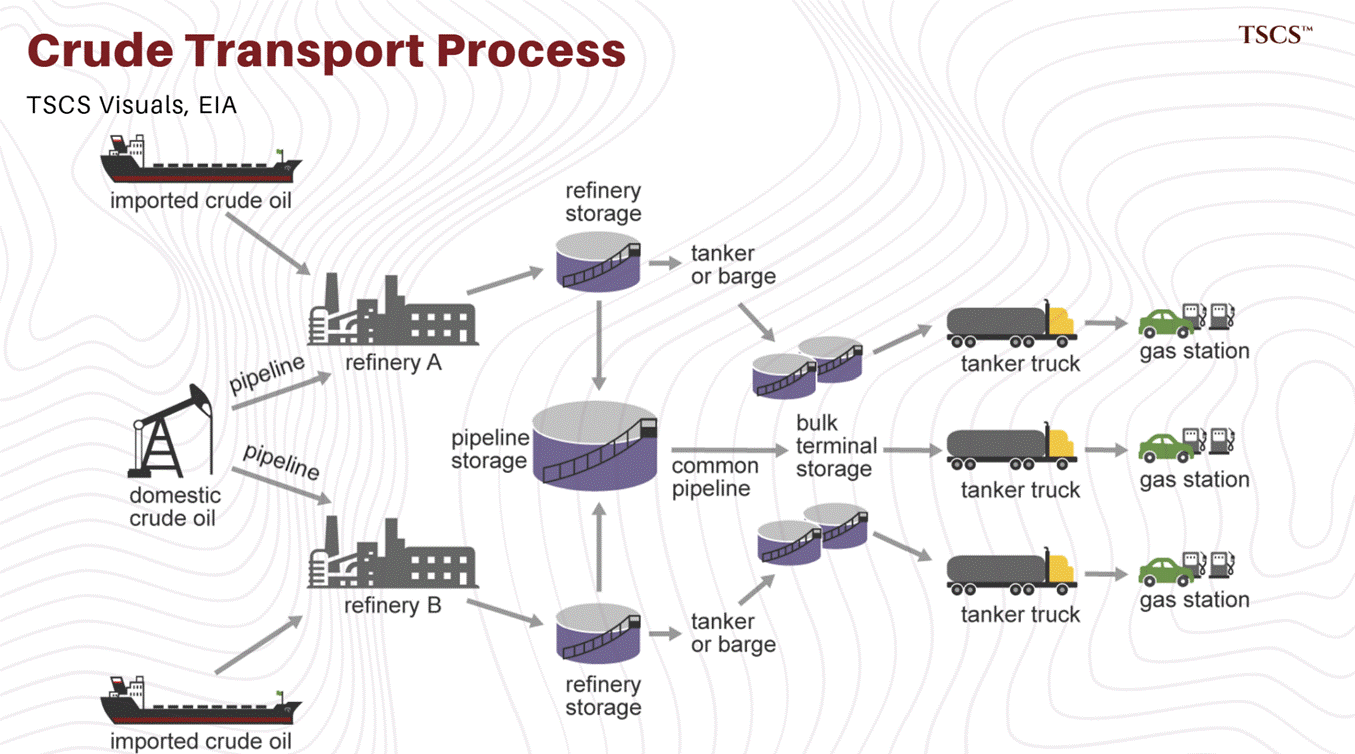
The oil market has an upstream, where barrels are found, and a downstream, where they get usefully consumed in an engine or cracker. Between these two markets sits everything else. The things that move, store insures and trades them. And I think all of it runs on one principle.
In calm markets the middle is essentially a low value margin grabber. It tries its best to collect a fee on volume moved, it bores equity analysts (and myself) to absolute tears, and it’s priced like a bond. I can already feel my hairline receding.
But in dislocated markets, the middle is the whole game. Every dislocation becomes a spread, across space, time, or quality. A spread can only be monetised by whoever controls the ships, tanks and pipes.
Naturally, when the world breaks, people like us try to find where the risk premium lands and how long it stays. In oil, flat price moves first and has the least meaning. It’s the most liquid product on earth. You know, the thing you can sell on a headling at 2 AM. It also forgets things the fastest. If you’ve opened a FT article, you’d know what I’m talking about. Thanks Bessent.
What about the premiums that stay? That’s war-risk insurance, freight and grade differentials. It’s in descending order of stickiness. Iran has been helpful in demonstrating both halves in live conditions.
I made this article with Giacomo Prandelli because the gap between “chokepoints matter,” which everyone now says, and “here’s EXACTLY how a barrel moves, who owns every part, what it costs, how it breaks, what’s tradeable,” is literally the width of the Strait of Malacca. Nobody here can answer it.
This article is free because information should be passed. Everyone deserves to know what the professionals know.
A note on authorship. A few chapters were written with Giacomo Prandelli, who traded commodities out of Switzerland until earlier this year and now works as a commodity analyst and geopolitical strategist at Mazziero Research. He supplied the profit-mechanism ranking, the licence tape and the field reporting inside those chapters. He writes The Merchant’s News, three times a week on commodities, geopolitics, sanctions and the listed companies most exposed to all three. If the trading-house chapters are the part of this you found most useful, that is where the rest of his work lives, and you should subscribe to him there rather than waiting for us to borrow him again.
His sourcing is his own and is marked where it matters. Everything else, including every judgment about what any of it is worth, is ours, and so is every error.
Let’s get started, shall we?
Let’s go back in time to the spring of 2020. We’re all stuck indoors. Planes are sitting like sardines in desert storage, roads are empty, and oil demands has collapsed by 20m bbl/d. Yet, the Saudis locked in a price war with Russia and were flooding the market. Oil is cheap, and its getting cheaper.
This is all true but it still couldn’t explain what happened next.
Its Monday, the 20th of April. Your may WTI contract expires tomorrow. For every day of its life, a futures contract is just some silly number on a screen. On the last day it changes. Whoever still holds it has promised to take 1000 barrels of physical crude at Cushing, Oklahoma. Normally this is fine. You sell, you roll, you never hold it when it becomes physical. The tanks of Oklahoma are someone else’s problem.
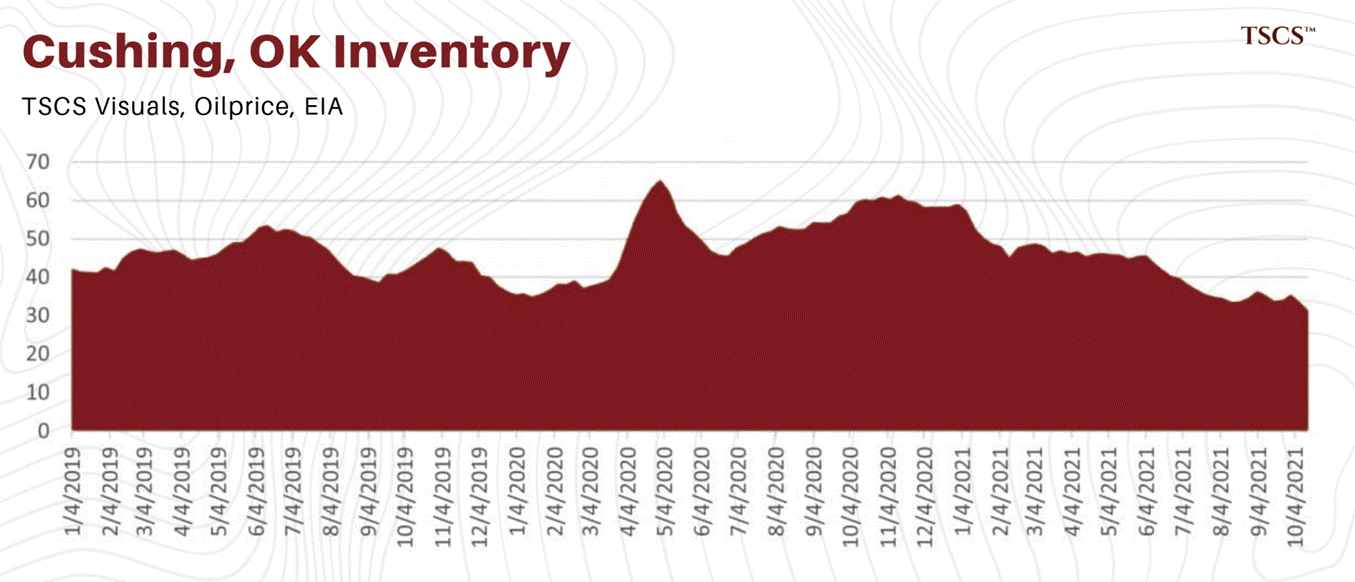
Except Cushing has 76m bbls of working storage, and by 17 April 60m bbls are in. Literally every remaining gallon is leased, commited, or spoken for. And, from the CFTC, open interest in the expiring contract is still way too high with one trading day to go.
This is how a crowd of paper longs and amateurs who’ve never smelled a barrel wakes up. That monday they held promises to recieve physical crude in a town with no fucking room.
At settlement that afternoon, the contract gets priced -$37.63. The FT calls it unprecedented, which I guess is true, and inexplicable, which isn’t. On the other side of all of these trades is someone with tanks, and they’re now being subsidised to do their day job. Nice.
Brent settled that same afternoon positive. Deferred WTI (contracts that are a month or two out) never went negative. The pandemic was global and so was the glut. The negative price was just Oklahoma. Absolutely nothing was wrong with oil.
Oil was fine. The middle was full.
Years before TSCS, I worked at a commodity trading house (remaining unnamed for its own good).
We had our usual desk meetings. When oil went negative the meeting turned, with complete professional seriousness to a rather clean proposal: “Why don’t we just get paid $37 a barrel to take delivery and then just burn it at a landfill?”
What.
The proposal made it exactly as far as HR and to nobody’s surprise she countered it with an offer to fire everyone involved. We didn’t burn any oil. HR wins again.
But there’s a reason I say this. When the middle of the market is overloaded, the economically rational response is a bonfire. The true floor under any deliverable commodity is minus the cost of destroying it. It’s never zero.
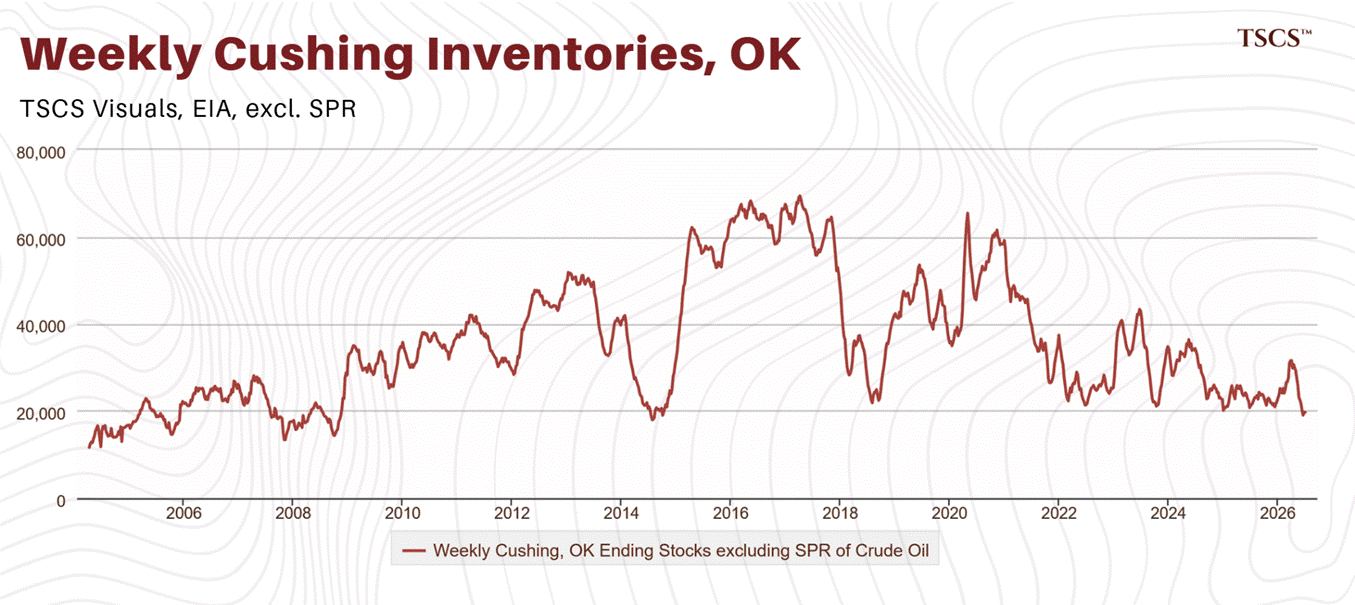
As of June 2026, Cushing sits at 20m bbls. This is very close to the practical minimum operators need for tank bottoms (due to the blending and line fill).
Tank tops break the market, because fullness has to meet a delivery obligation. Tank bottoms don’t do this. They strain it with basis stress, squeeze risk, and operational friction. But both are cliffs for oil.
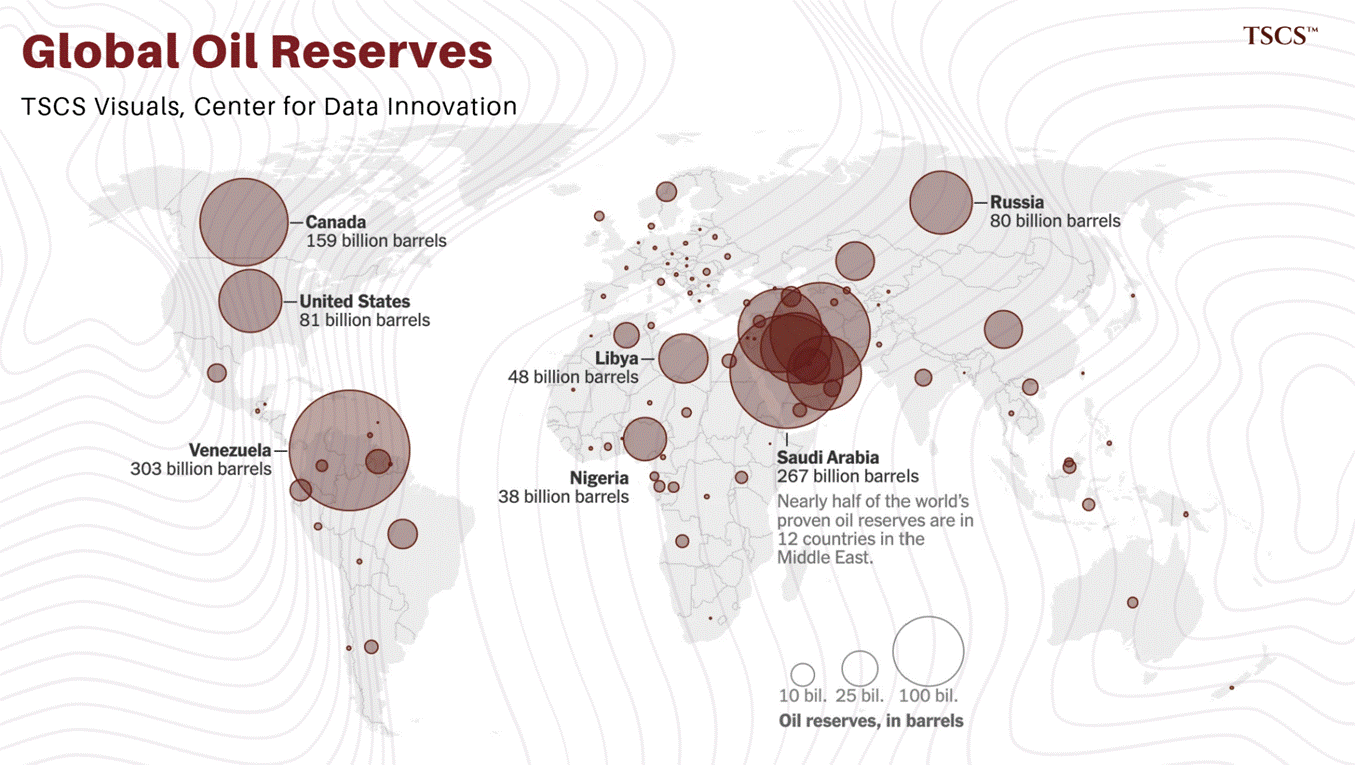
Nearly all of oil’s reserves are in the wrong place.
Geology puts the barrels under the Gulf, West Texas, West Siberia, the Brazilian Presalt and the Atlantic margin.
Demographics put the refiners in eastern China, India, Southeast Asia.
The distance between this is literally why the midstream exists, and the distance is growing: supply growth is now increasingly the Atlantic, Permian, Brazil, Guyana, while demand growth is entirely Asian.
In the first half of 2025 79.8m bbls/d moved as maritime trade. That’s 3/4 barrels that touch salt water (EIA). Pipelines get all that political controversy (you’ll see more in Part 5), but the actual market is on the ocean.
That’s why I spend so much time talking about the ocean. A reader who knows refinery economics cold but hasn’t ever heard of what a Worldscale Flat Rate is, for our purposes, illiterate.
The industry is full of such readers. Several of them run energy funds.
Shipping demand is calculated by barrels x distance. In trade jargon they call this ‘tonne-miles’ because (I know it’s straightforward) a ship moving cargo twice as far is occupied twice as long. And an occupied ship isn’t available to anyone else.
Think about what happened after 2022. A cargo loading at the eastern Baltic and discharging in Rotterdam takes 1,250 nautical miles.
That same cargo, if embargoed out of Europe and rerouted to India’s west coast takes 8,750 miles. According to BIMCO, by 2024 India’s average crude import haul was 25% longer than 2021. Distance beats volume. Always.
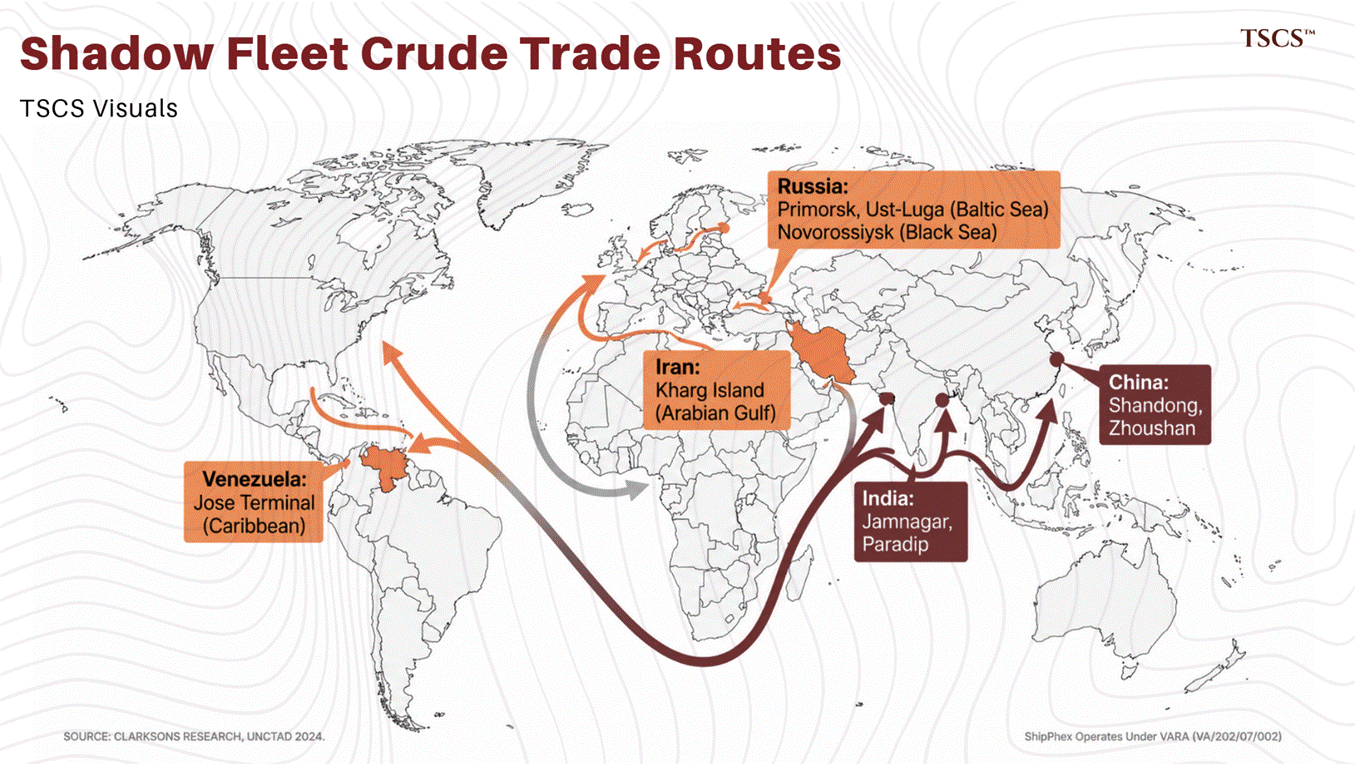
Rerouting can be read as a demand shock with no new demand. The sanction dynamics of 2022-2026 functioned as one of the biggest tanker-employment schemes in history, just because of geometry. Any settlement that lets Russian barrels sail wesst again is the same shock but reversed. All it takes is a signature, but that’s for Part 9. Don’t skip it.
Midstream assets have two ways to earn money. If you confuse them you introduce a rather expensive category error.
The first way is tolling (Iran is quite familiar). It could be anything from a contracted pipeline, a leased tank, or a terminal with take-or-pay commitments. Something like volume x fee (protected by contract) indifferent to the oil price (within reason). This gets valued like infrastructure debt.
The second way is an option. Things like a spot tanker, an uncommitted tank, a flexible trading book, etc. These aren’t worth much in a normal market and are worth anything in a crazy one (such as right now). They serve as a release valve for a physical imbalance. PnL follows suit.
The options have this hidden violence that people raised in a sell-side office can’t believe until they see it.
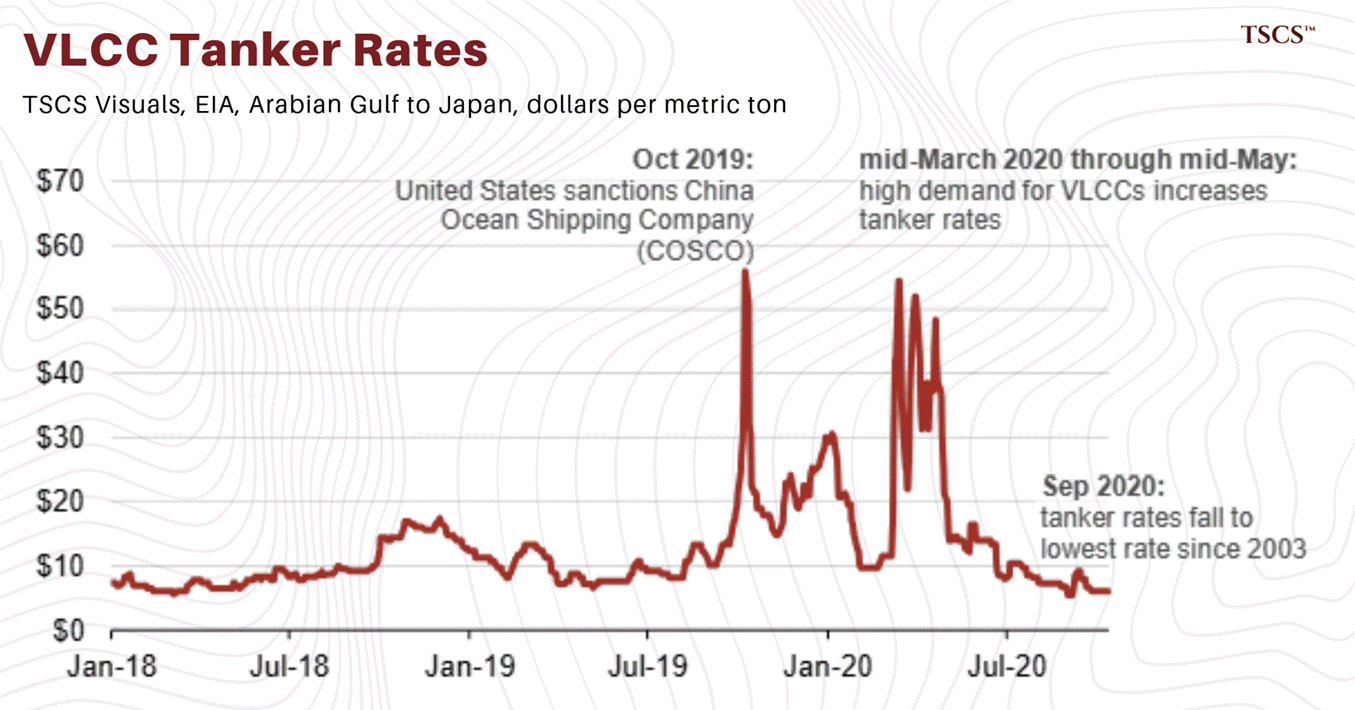
Let me show you: In march 2020, VLCC rates went from $30,000/d to $265,000/d in just a week, then back to $17,000 by august.
We even had a moment this year by the SoH: rates went from $50,000 in January to $206,000 in 26 Feb and then to $600,000 in mid-March. It THEN went back to $470,000 in 23 June… You get the point.
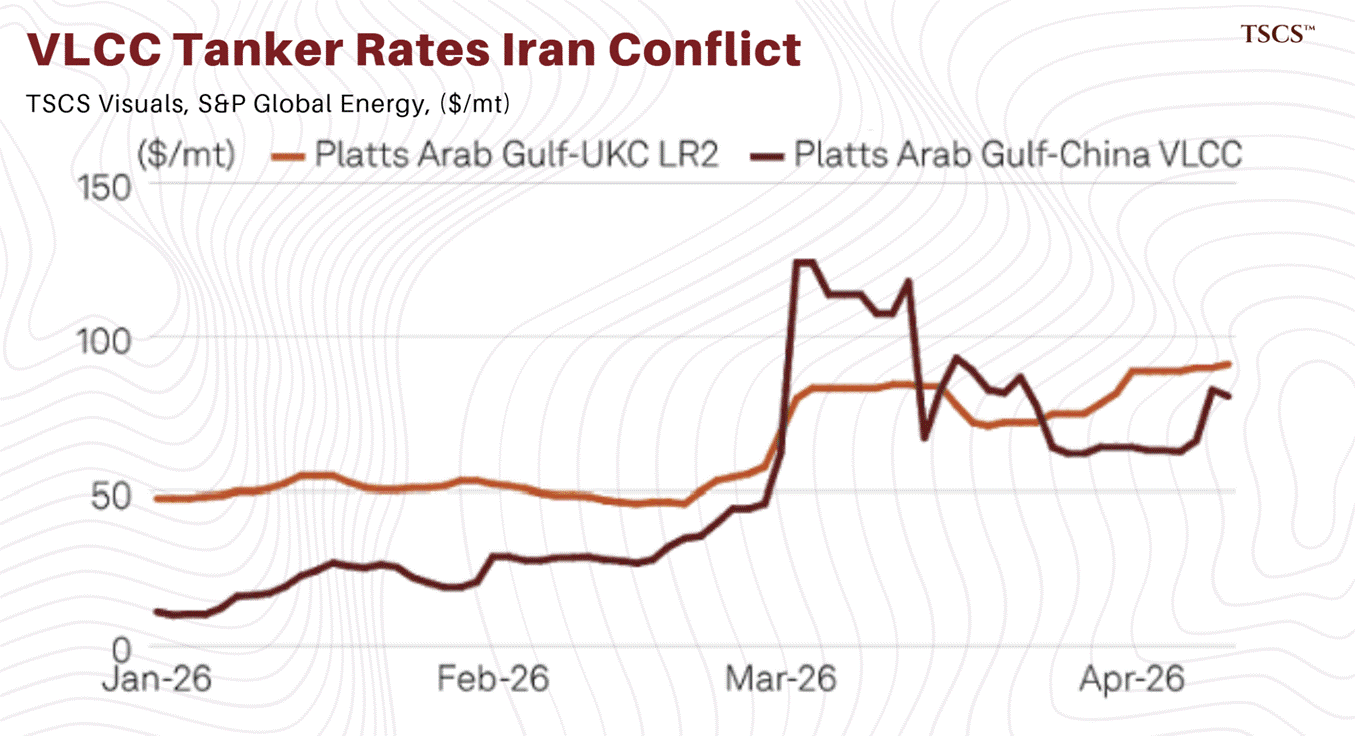
All of this was inside 5 months. I can’t think of many other liquid asset classes that do this as routine behaviour. Functionally speaking, tanker equities are listed call options. That’s why they’re usually cheap at every top and broken at every bottom. A classic trap is buying them off a P/E screen.
Professionaly value them on steel and orderbooks. More in Part 8.
Through both of these spikes, the 12-month time-charter market stayed at/around $110,000/d.
The obvious reading is that markets are pricing events for what they are. But there are atleast 3 other readings. Specifically:
Charterers refusing to lock panic into a year of committed cost
Owners refusing to sell cheap (since convexity makes a crisis valuable)
Or just both sides standing back from something too difficult to price
Part 4 will help you figure out how to discern them. For now, just assume that spot-period gap is a price too.
If you haven’t noticed, I’ve been subconsciously making you circle back to the winners of options. They’re the traders.
Vitol made $15bn of net profit during that 2022 dislocation. Trafigura made $4.09bn in H1 of 2026, literally more than all of 2025.
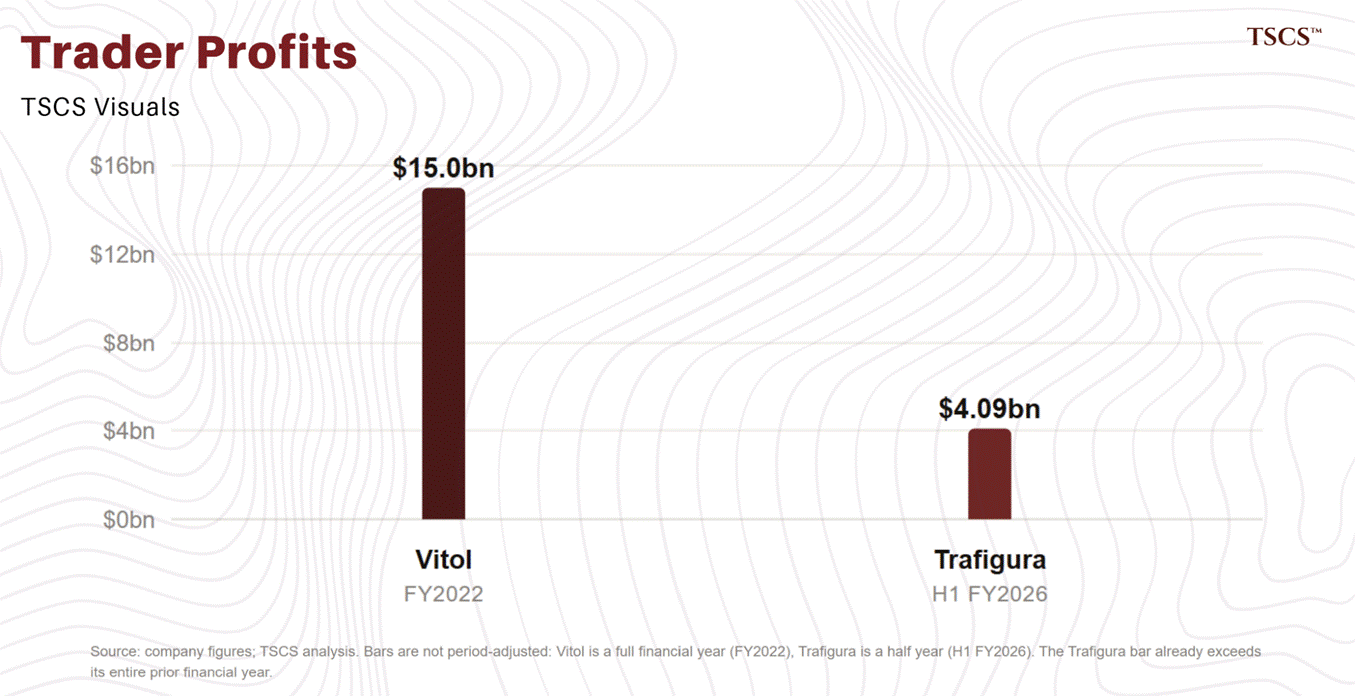
Merchants out-earn the refining arms of the supermajors in these dislocation years. It’s their business model, they spend years when no one is watching buying tanks and optionality.
Every bull case written of tankers (including research you’ve probably read from us) leaned on the same supply-side claim: an old fleet and a thin orderbook.
This was true at the time. Now it’s not, stop relying on it.
Let me atleast give some credit, half of it still stands. The tanker fleet is the oldest in my living professional memory, VLCCs are averaging 13.7 years, and 1/5 of crude fleets are already past 20 years.
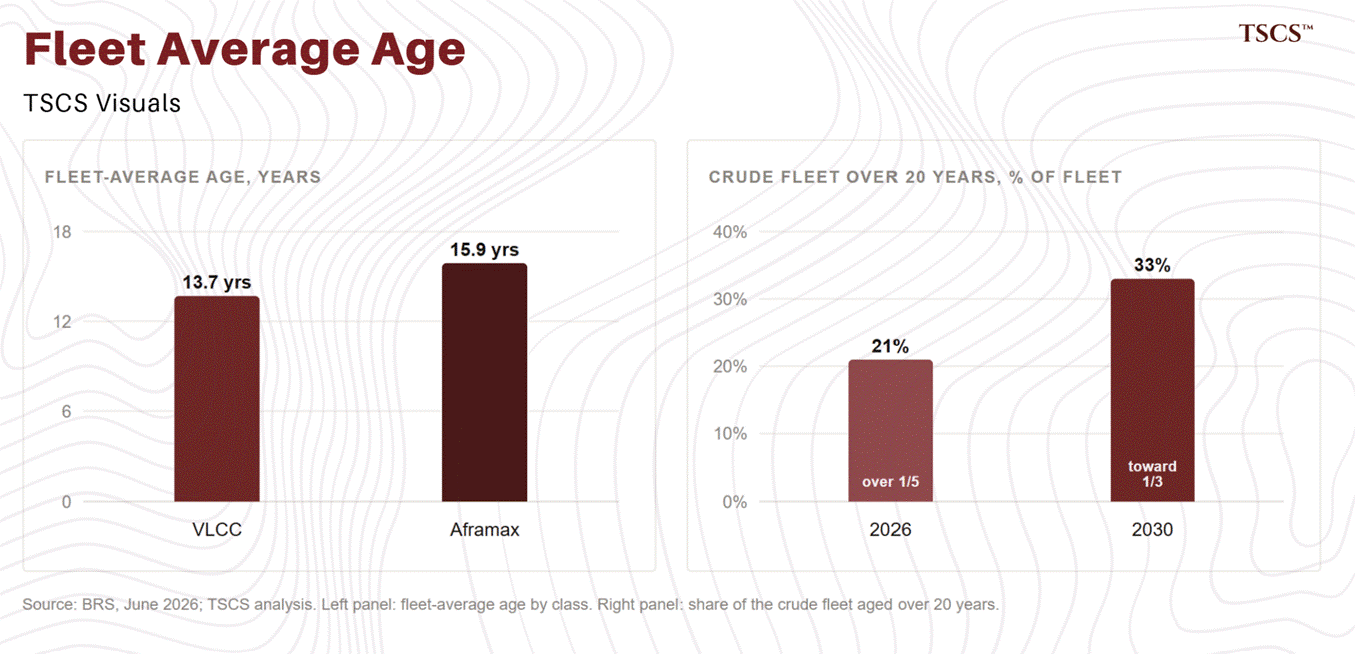
But that orderbook argument hasn’t worked since 2025.
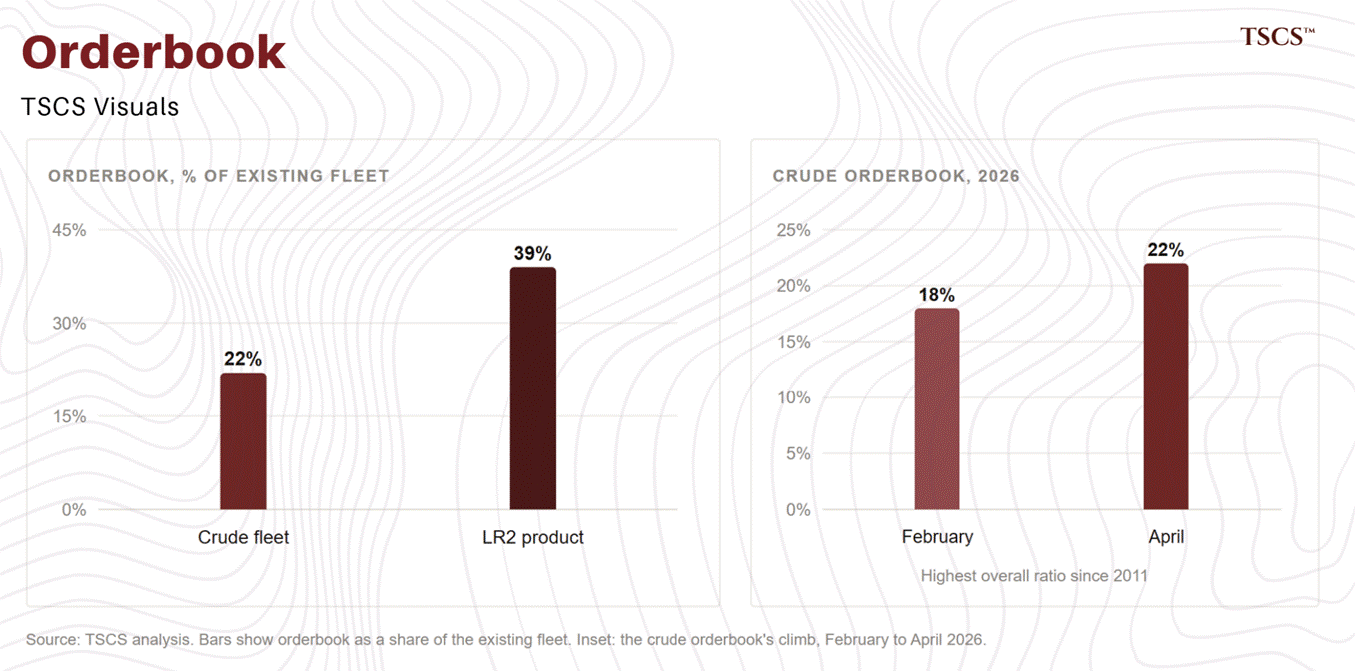
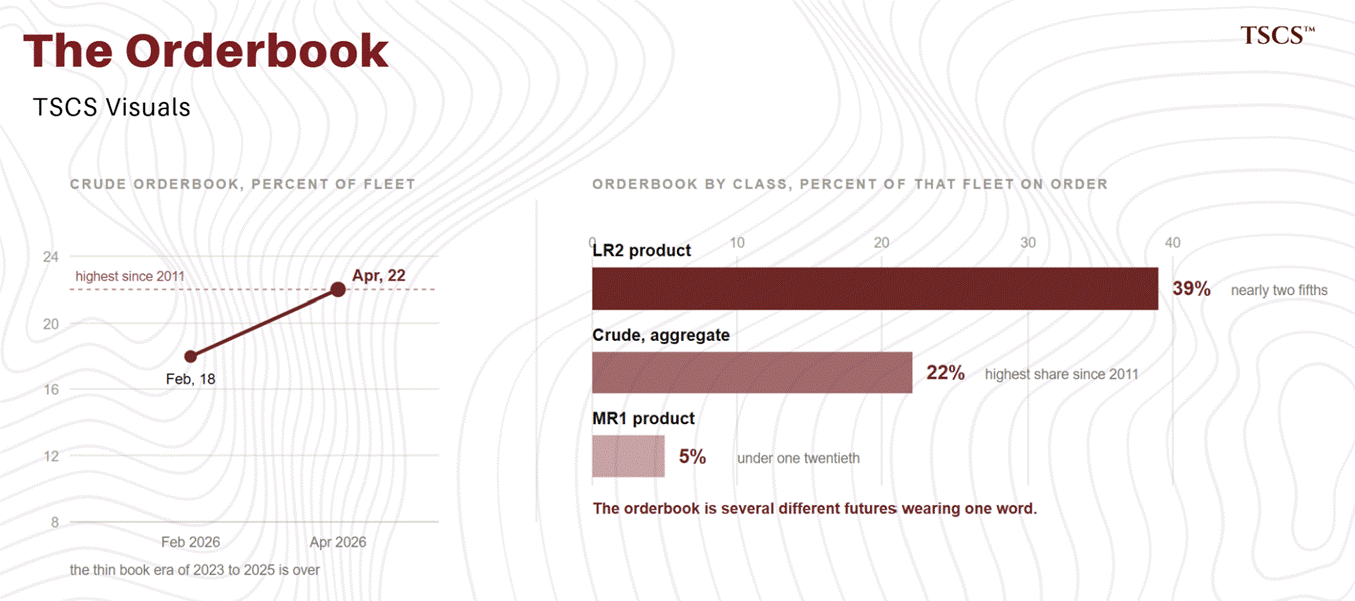
Crude’s book went from 18% of the fleet in Feb to 22% in April, believe it or not that’s the highest since 2011. Even demolition has stopped: not one tanker was dismantled in May. Why? Sanctions. Sanctioned trades pay old ships way too much to give up.
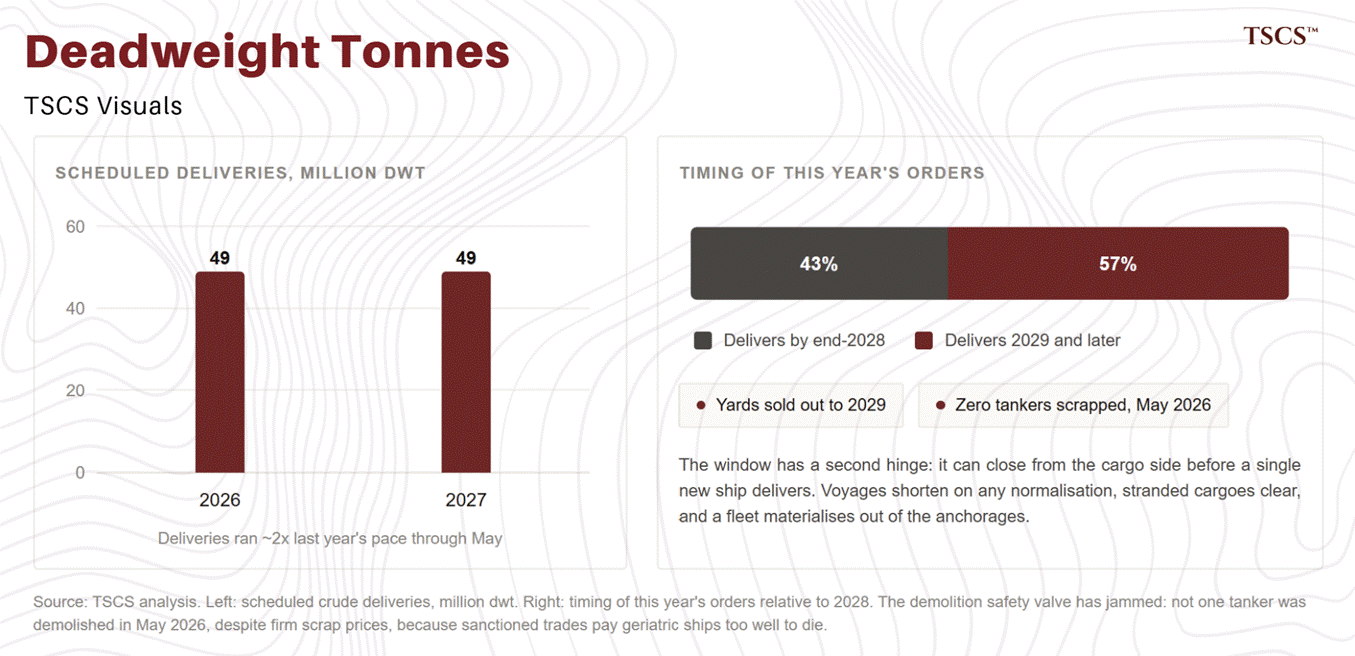
This window also has a second hinge nobody I know prices. Cargo can close it before a new ship comes online. Voyages can shorten on any normalisation. Stranded cargoes can clear. Queues can dissolve.
When you put that together it makes the window more clear. Age, full yards, and war-trade keeps the market like this until 2027 (roughly). After that, ships will arrive on public schedules.
These can certainly be traded, some of the best trades in shipping history were from windows. But beware of the closing dates. I think this one comes from the orderbook for anyone who bothers to look, which if 200 years of cycles teach anything, nobody will.
The market prices spot as everything and leaves the rest in the shadows. If you can get the middle’s direction right everything else will follow.
The inversion between spot and where the event exists on the midstream is why I made this for you. That’s the edge you can take home.
2026 added a situtation history doesn’t have yet: the state is influencing the middle (400m bbls of releases, sanctions waived, $40bn public reinsurer).
You need to watch the middle.
There’s a place in texas where gas has traded negative, multiple times. It’s seen as a local custom of sorts.
Every barrel of oil you’ve seen sits on a ladder of deliverable prices. The same barrel is worth one price if it can reach a benchmark-quality buyer at a major price point, and its worth a lower price if it can only go regional, and lower still if its stuck behind a full pipeline, and nothing if it can’t legally or physically move. This is first principles, and it’s straightforward. I find it good to internalise through writing.
So, in Part 2, every asset you’ll see if going to be part of this system that moves barrels up our aformentioned ladder. Every machine has its own cost and capacity. If you stack them from cheapest you’ll get a cost ladder that obeys one law only: to gravitate toward the cheapest machine that has capacity.
When the cheapest one fills, the differential will widen. This law explains literally every regional price blowout in modern history. Things like Alberta’s $40 discounts and Waha’s negative gas. I think it’s one of the most useful sentences in this primer.
If you’re interested I’d recommend The Crude Chronicles since they do long-run data.
I’ll now be touring the assets. For each machine we’ll look at: what it does, what it costs in kind, who runs it, and what breaks.
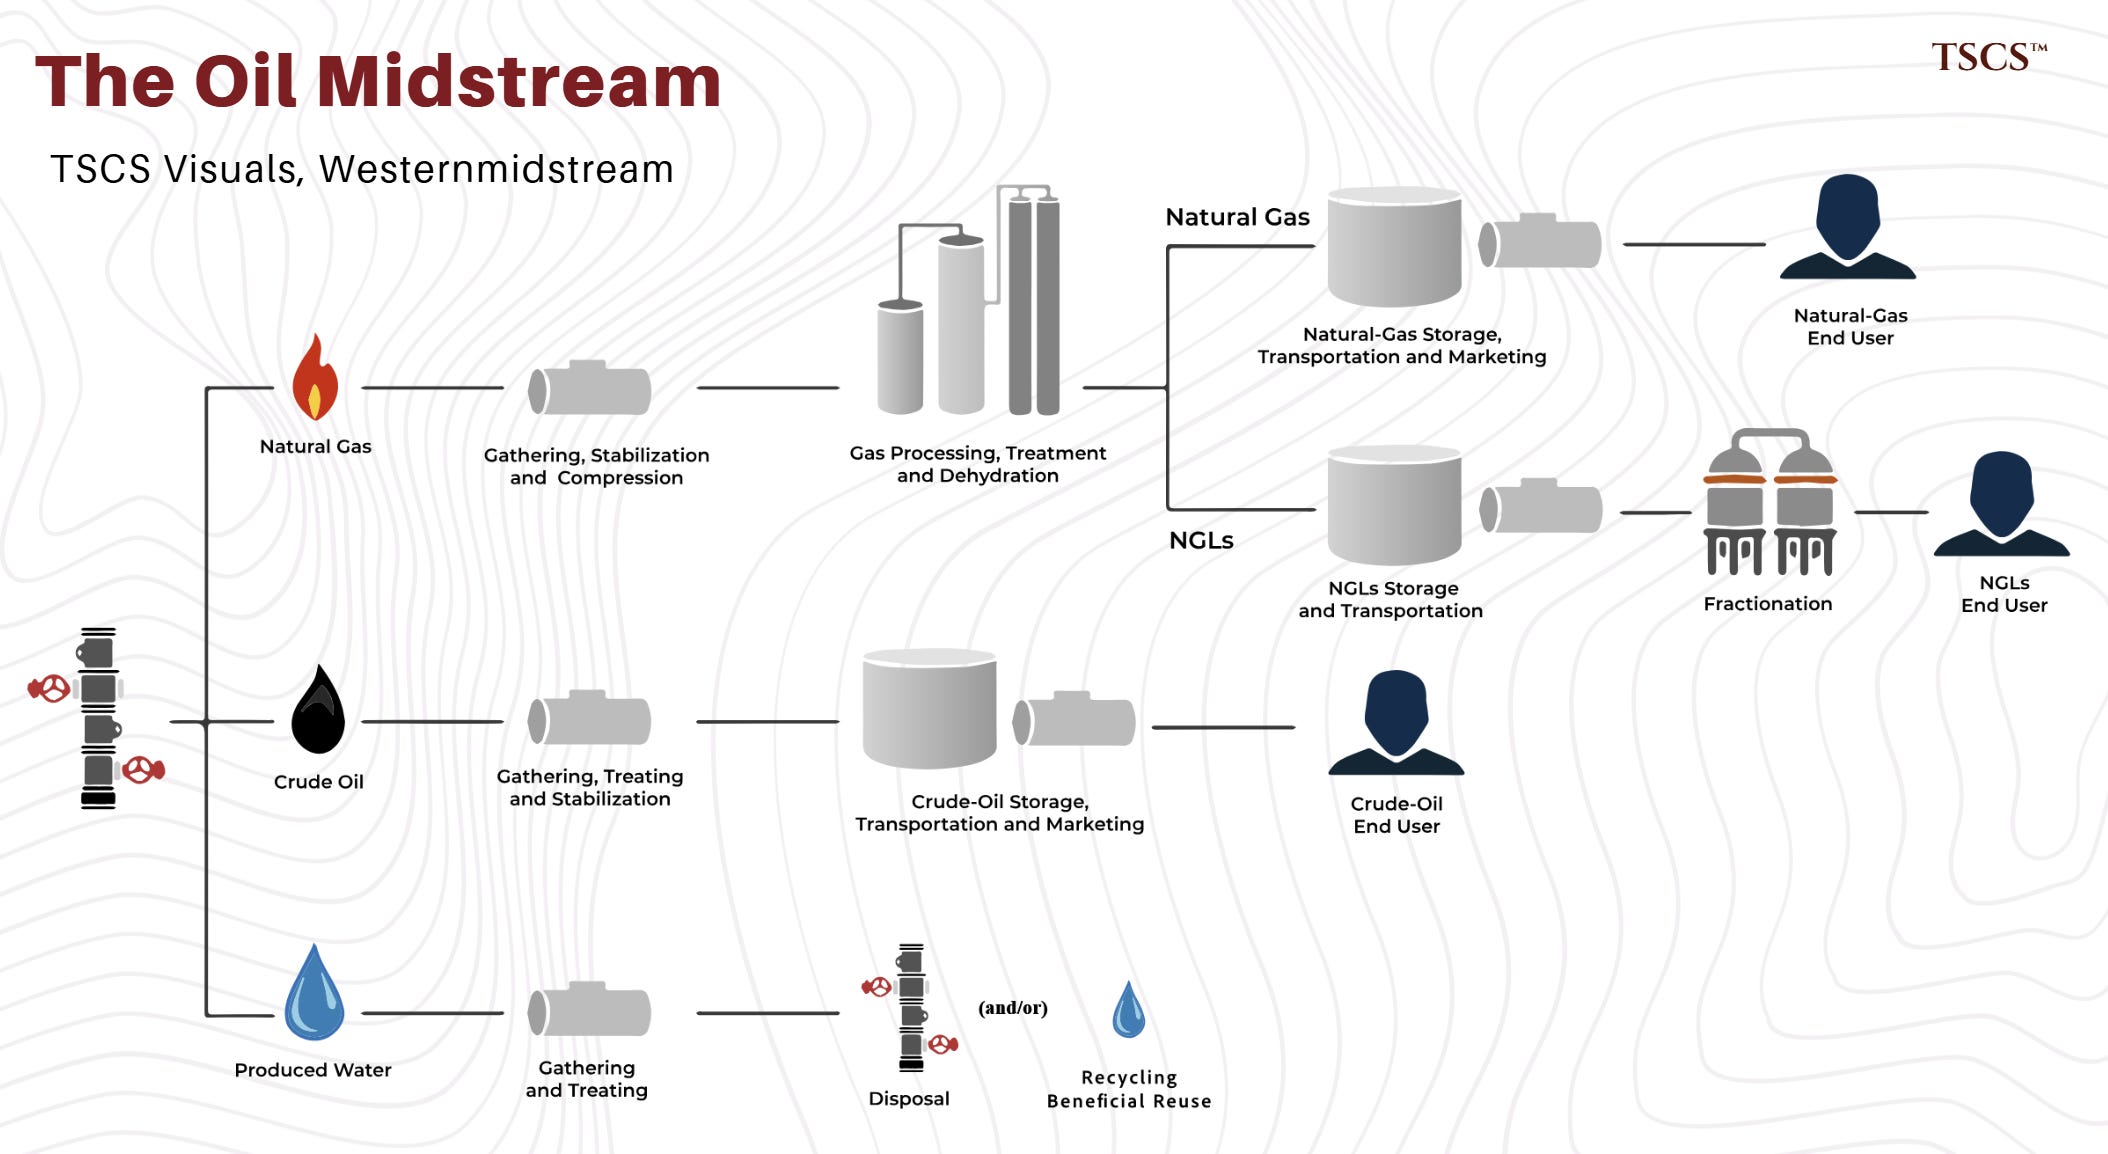
Oil begins as an emulsion. When a wellhead spits out this viscous liquid, it’s a mixture with water, gas and sediment. The first midstream act is the separation of it.
Gathering lines feed field separators and treaters. These turn this ugly emulsion into a stabilised, pipeline-spec crude and raw gas stream.
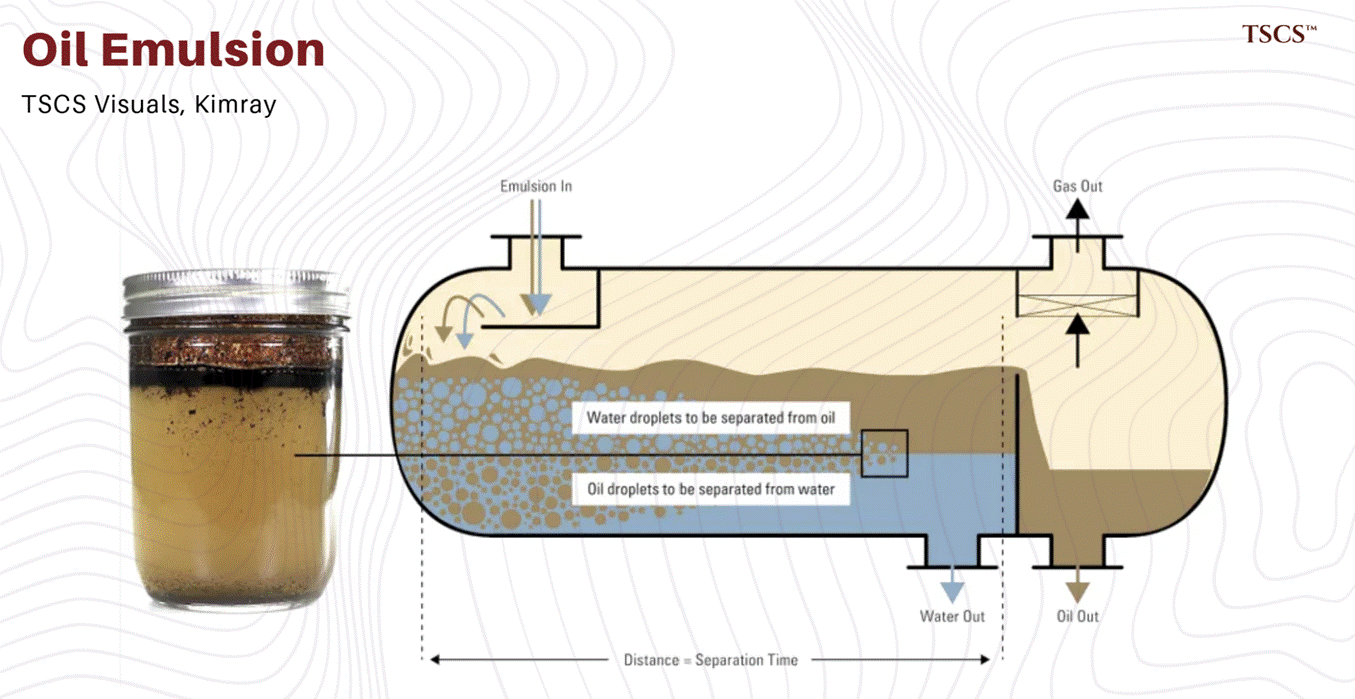
Gas goes to processing plants that take out the liquids like ethane, propane, butane, and nat gasoline. These then travel as a mixed stream to fractionators (above all at Mont Belvieu in Texas) where they get split into purity products that are stored in salt caverns.
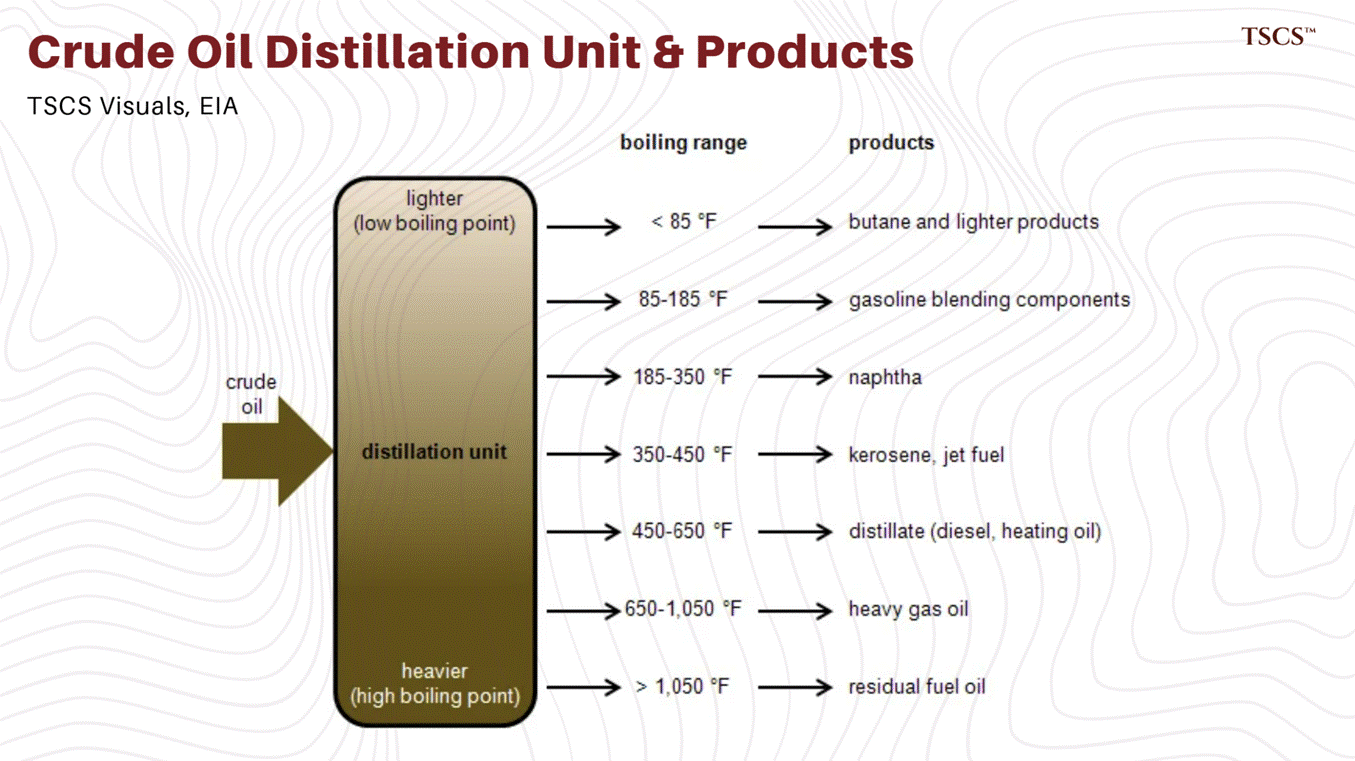
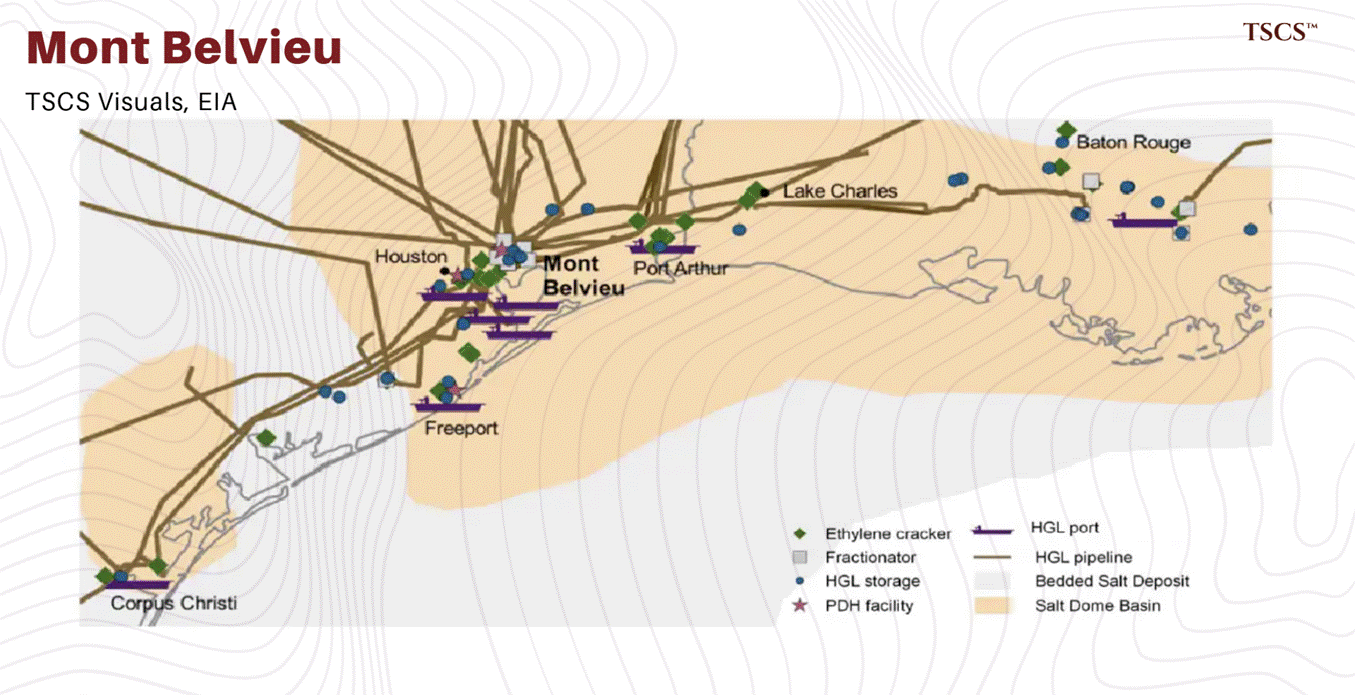
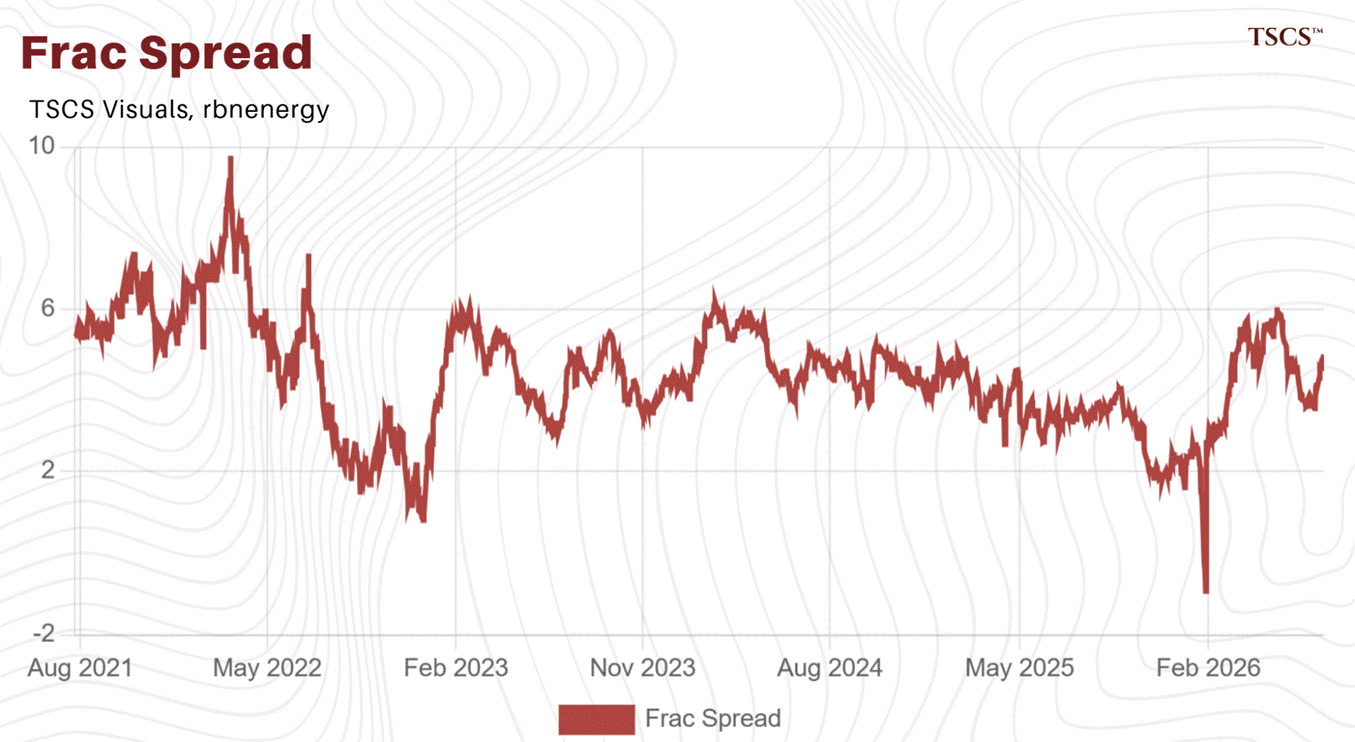
Whether ethane is worth extracting at all is usually a daily price decision (they look at the frac spread and decide if its worthy). If the spread is too low, ethane simply stays in the gas stream and gets burned off. Most analysts can’t manage the career flexibility ethane has.
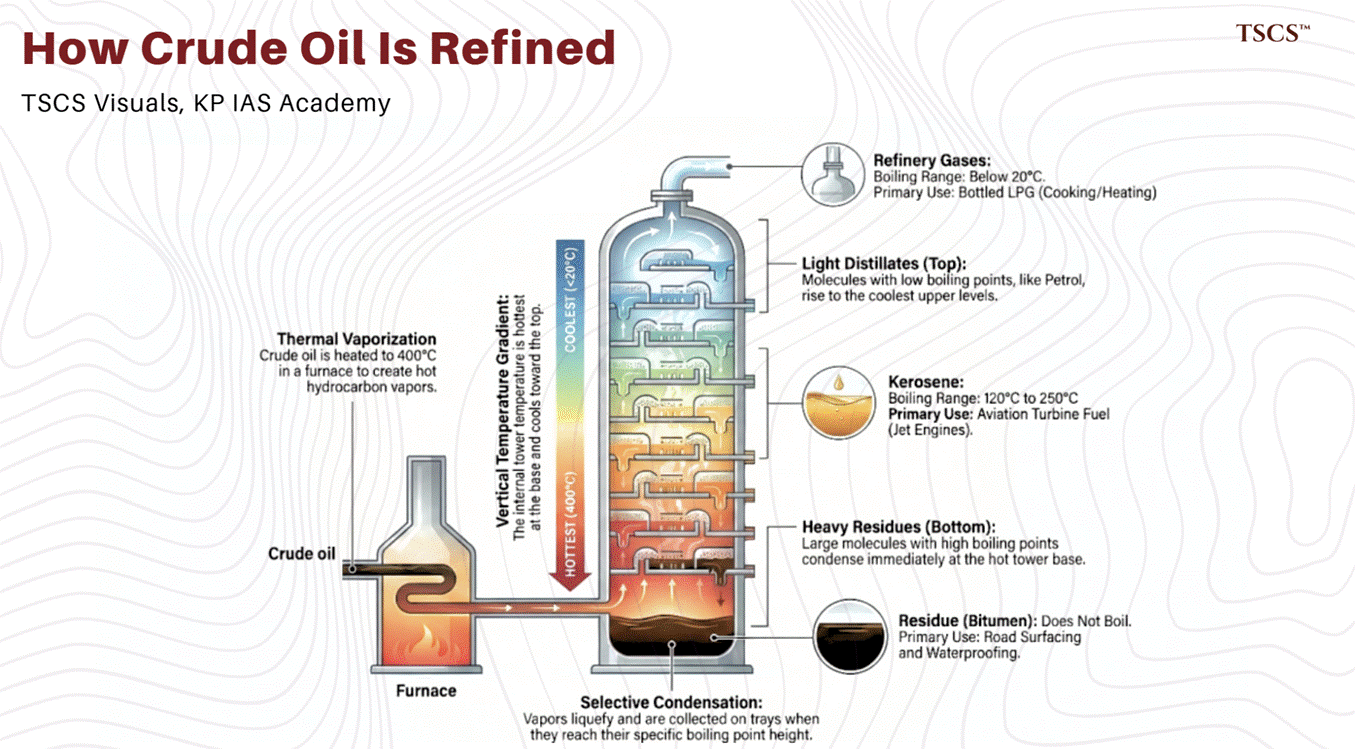
I want to make this clear but this primer is predominantly a crude midstream module. The NGL chain, LPG shipping and product-eport logistics have real bottlenecks. In the US midstream equities they are also often the larger share of cashflow. I tried to make it that the analytical machinery can transfer to them directly.
This breaks if processing capacity, in fast-growing basins, has flaring and shut-in gas. It’s trivial almost, a hydrocarbon without a route can’t be an asset.
A trunk pipeline has been humanities cheapest way ever devised to move oil on land. They push batches of different grades in sequence down the same pipeline, increasing throughput with drag-reducing agents.
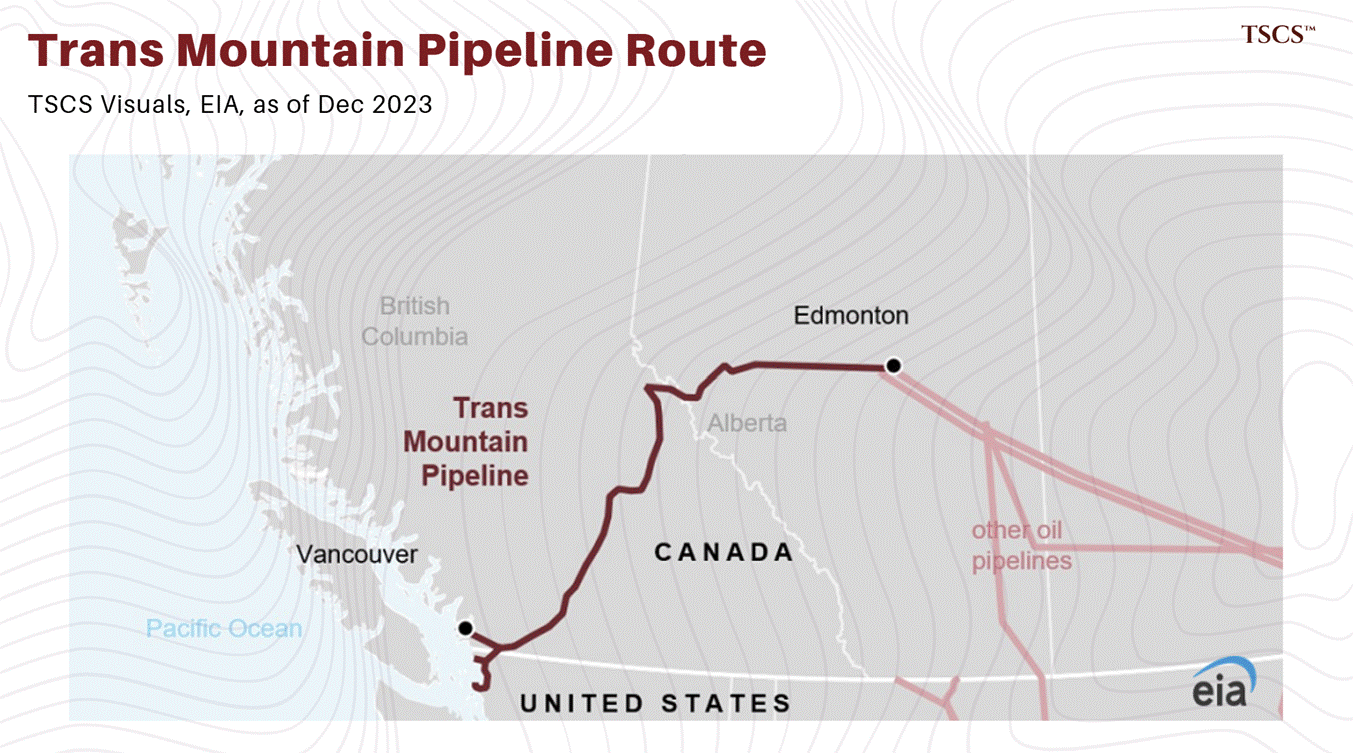
It’s interesting because a large pipeline system will permanently contain millions of barrels of line fill (oil that must exist inside the pipe for it to function). When the Trans Mountain expansion opened in 2024, its first commercial act was to swallow millions of barrels that won’t even be sold. This is the only infrastructure that does this.
So where does the value live here? Almost every investor treatment skips this. It’s commercial machinery.
Capacity comes in two ways.
Committed shippers sign take-or-pay contracts (at the financing stage): where they pay for space whether they choose to use it or not, and in exchange they hold the rights, including make-up rights to ship later what they paid for and didn’t use.
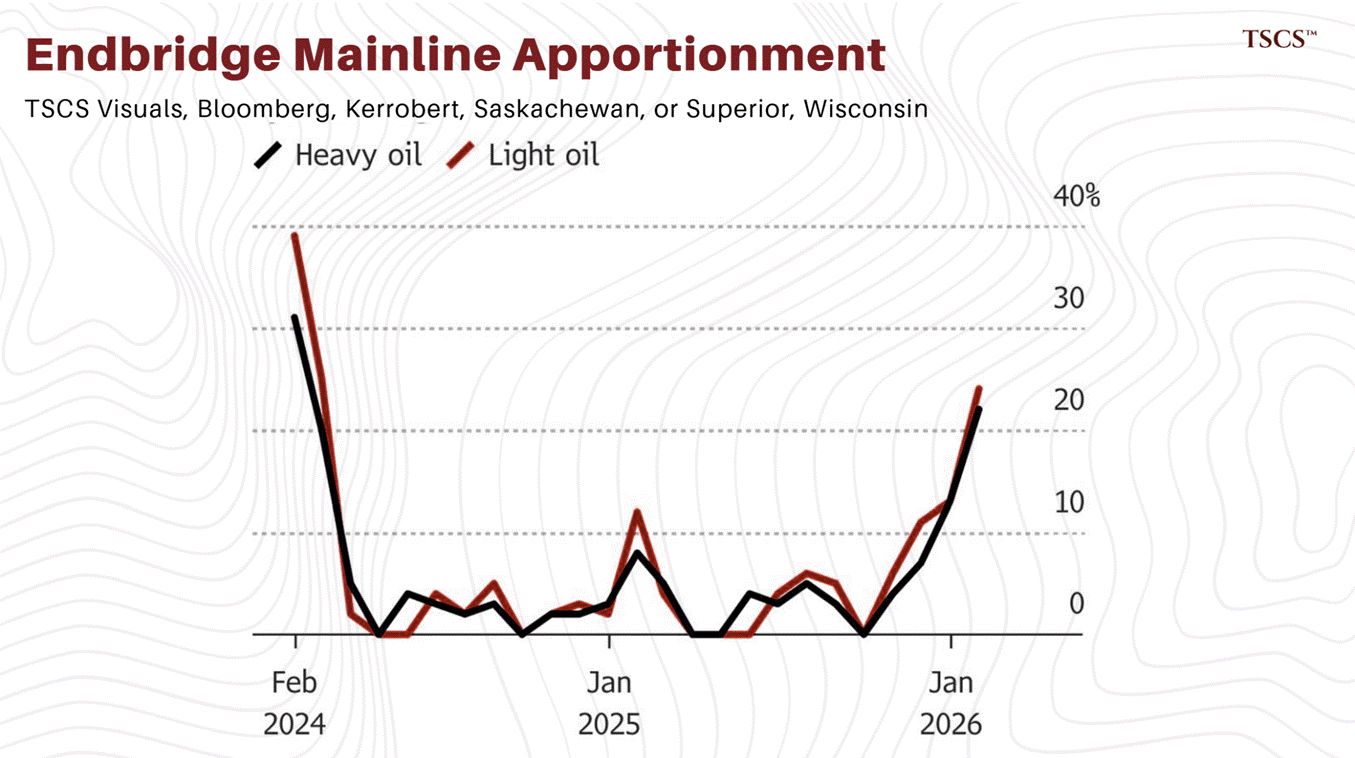
Uncommitted or walk-up shippers nominate month-month at a posted tariff. Basically, every month all shippers nominate volumes, and when these exceed capacity the pipe gets apportioned. Everyone’s uncommitted request gets cut back pro rata.
Apportionment is one of the most information-dense words in the pipeline community. When a pipe is in apportionment its filled, and the ladder analogy acts accordingly.
Canada actually has the world’s 3rd largest oil reserves. They’ve spend decades functionally landlocked until someone created the Trans Mountian expansion which entered service in May 2024. That lifted their volume to 890,000 bbls/d.
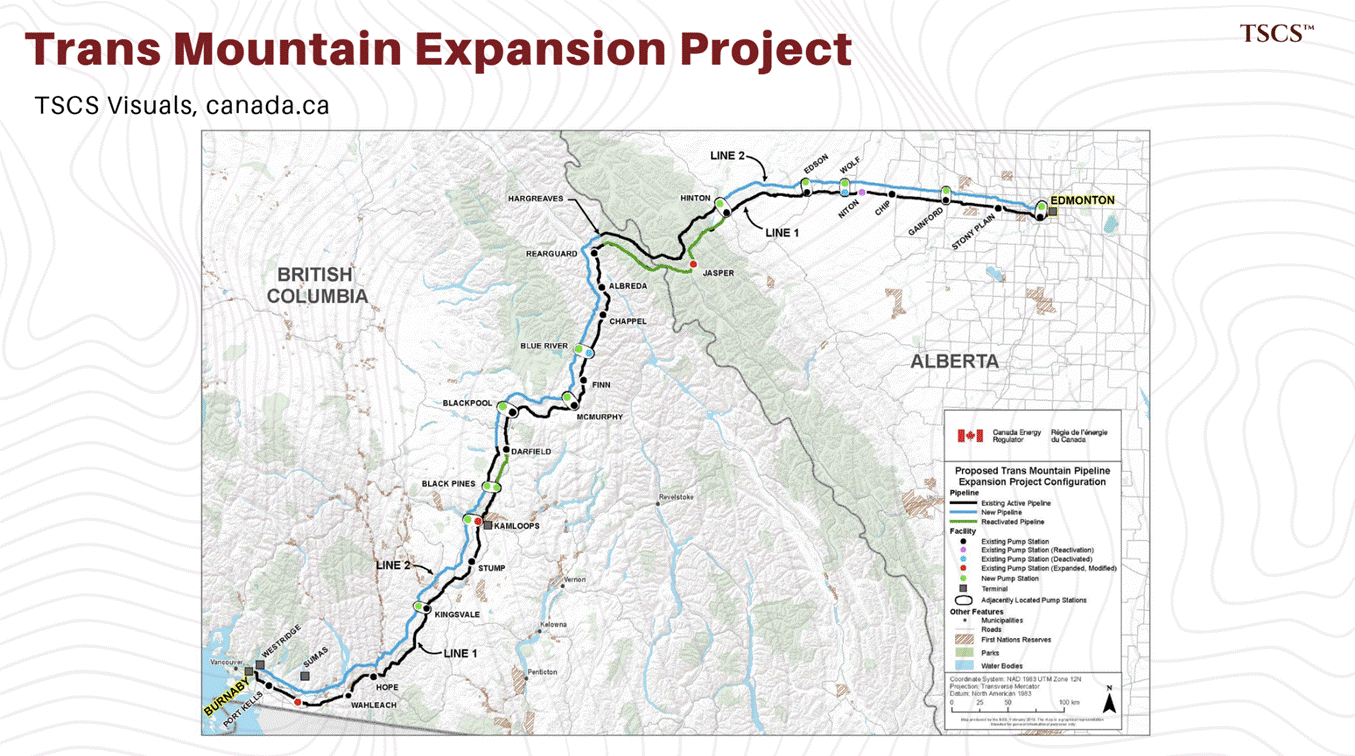
Canada finally got its pipeline and immediately needed another one, which may be the most Canadian sentence in this primer.
On the Canadian problem specifically, The Oregon Group has covered the pipeline politics behind that discount at length. Great guys.
A pipe’s power lasts as long as it’s the cheap machine with spare room, and not one nomination cycle longer.
Because batches touch and grades commingle, systems run settlement mechanisms compensating shippers whose high-quality barrels degrade toward the common stream in transit, which means quality is metered and settled. And recontracting: take-or-pay protects cash flow only until the contract rolls.
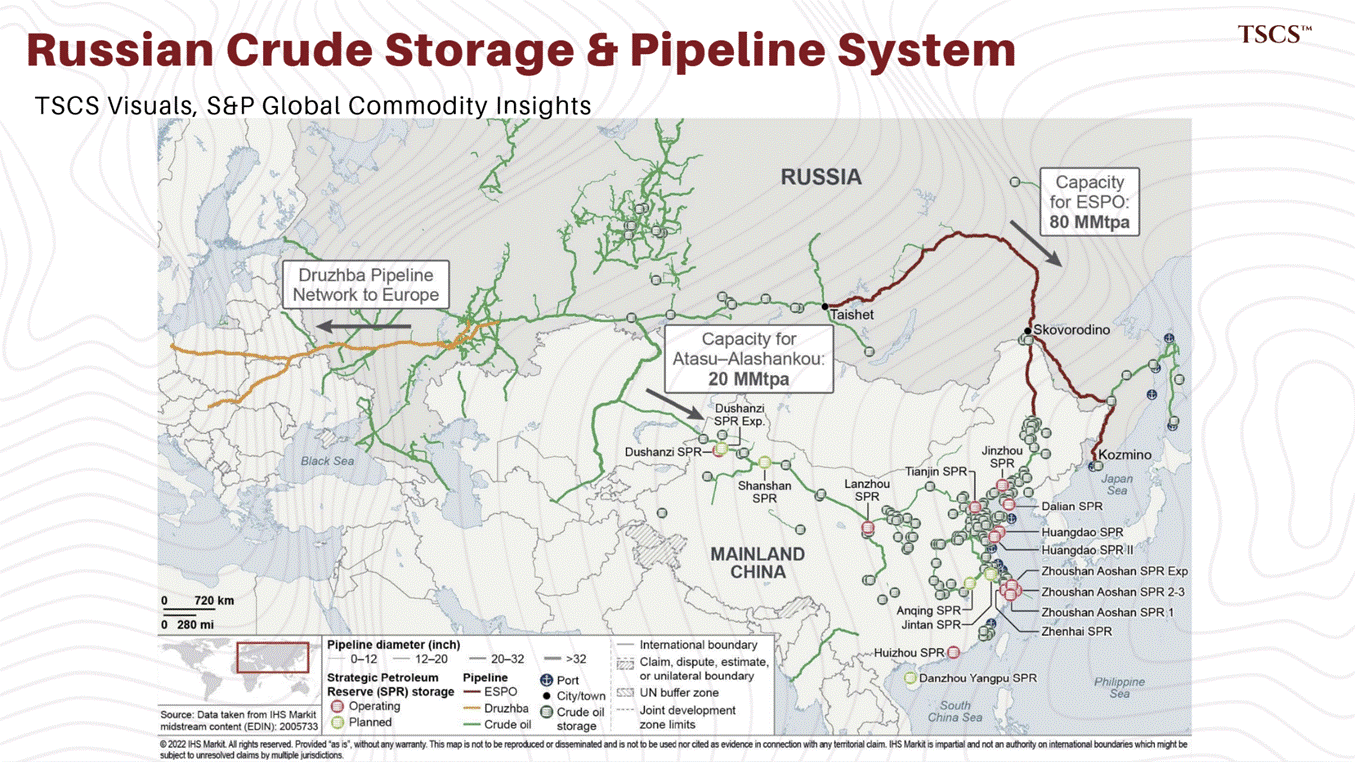
Internationally, the trunk lines that matter are political instruments first and commercial assets second, Part 5 explains this. Note that Druzhba, the Soviet-era artery, is Russian for Friendship.
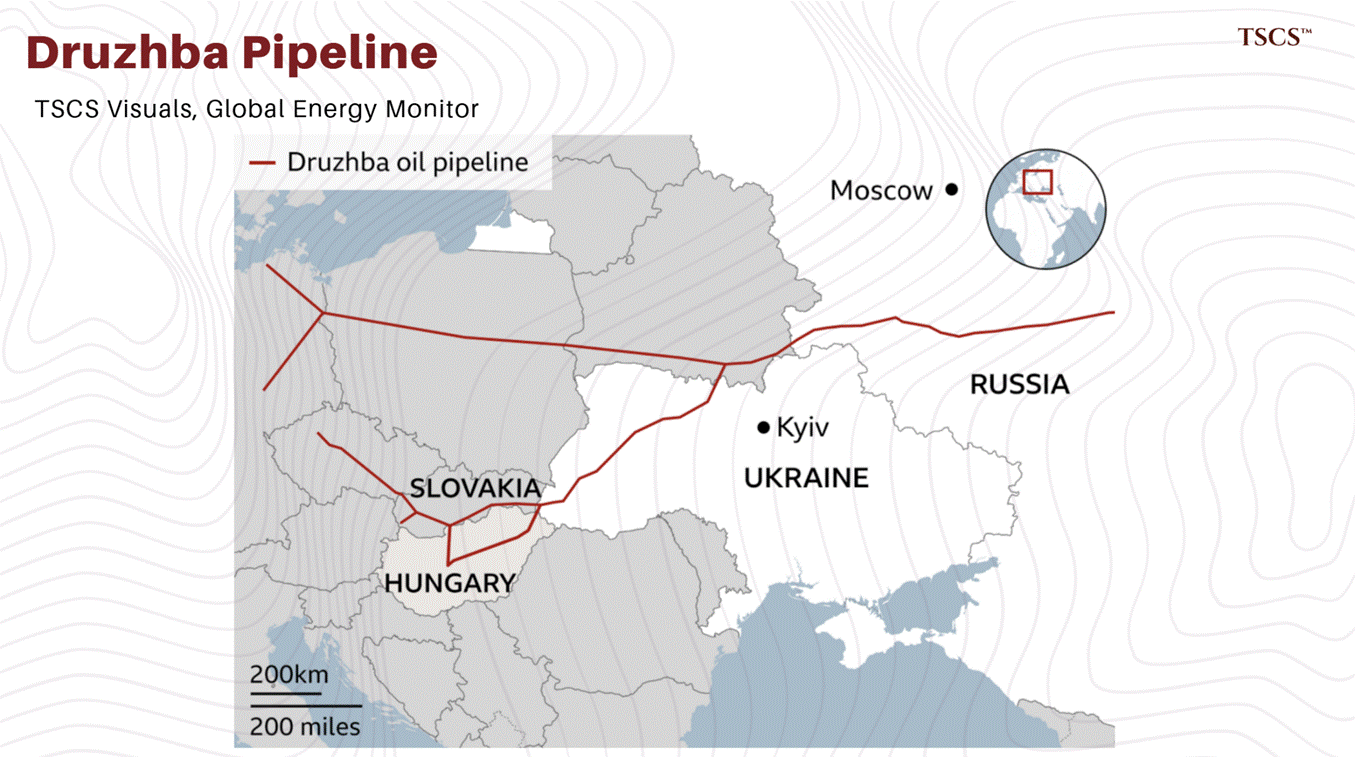
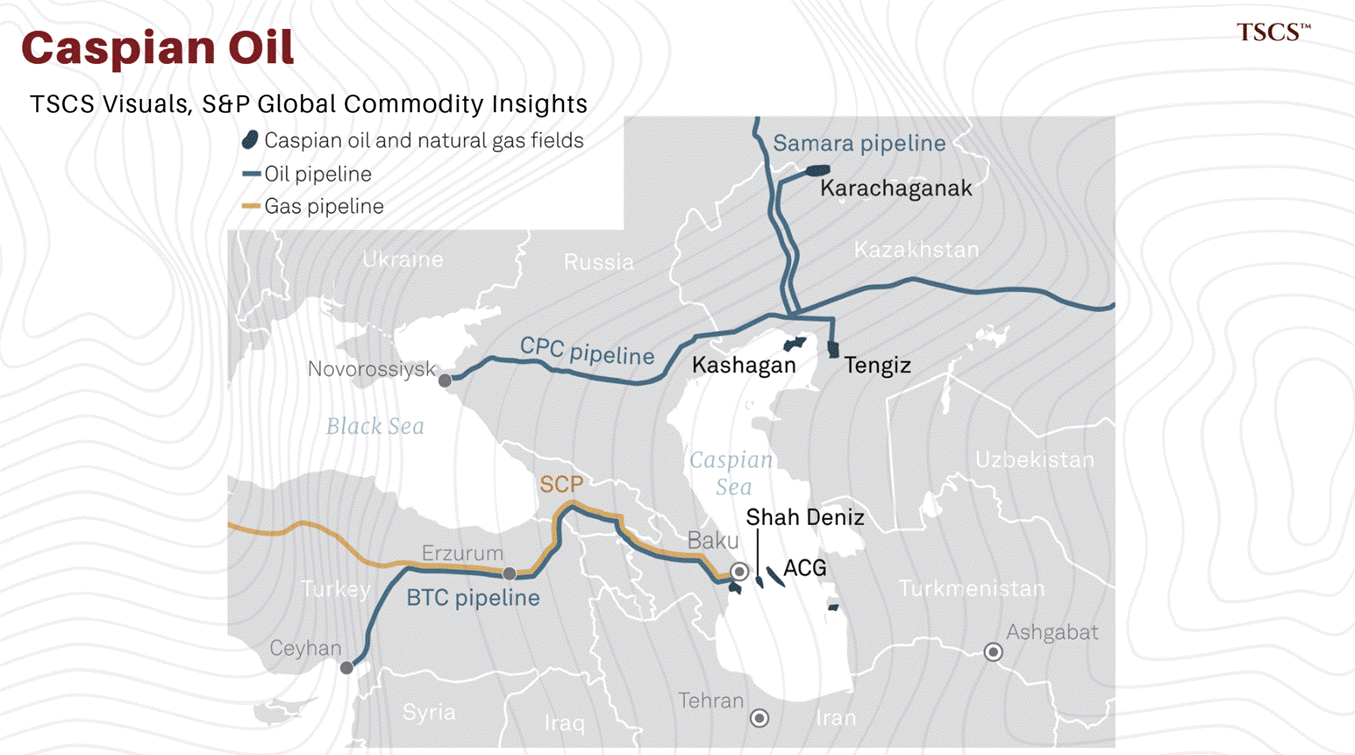
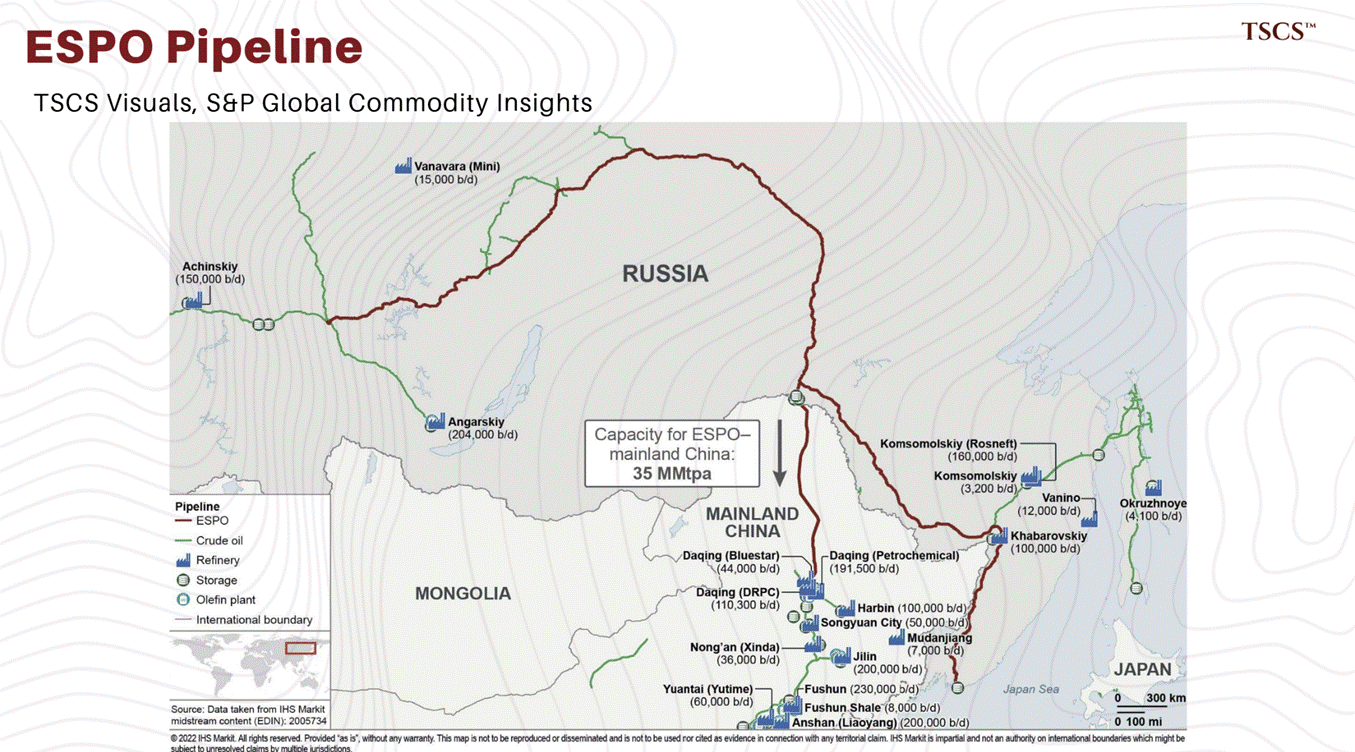
CPC carries Kazakhstan’s exports through Russian territory to a Russian port; ESPO is Russia’s built escape to the east; BTC is the West’s built escape around Russia.
Products move by pipe too, gasoline, diesel. The best way to understand this is to see what happened a few years ago.
On 7 May 2021, a criminal group called DarkSide got into Colonial Pipeline’s business systems with one compromised password, and Colonial shut the pipeline, all 5,500 miles of it, as a precaution.
What happened next was the best demonstration in modern history of the inland middle’s value: stations from Georgia to Virginia ran dry by the thousands, it was almost all because everyone tried to hoard a week of it in their sedans simultaneously, and the United States Consumer Product Safety Commission was moved to issue formal guidance to the American public: do not fill plastic bags with gasoline.
Brian Potter is the best place to understand why infrastructure like this fails at the billing system rather than the steel.
So Colonial paid the ransom, about $4.4 million in Bitcoin, of which the Justice Department later clawed back roughly half, and the line restarted.
Total physical damage: none. Infrastructure attacked: a billing system.
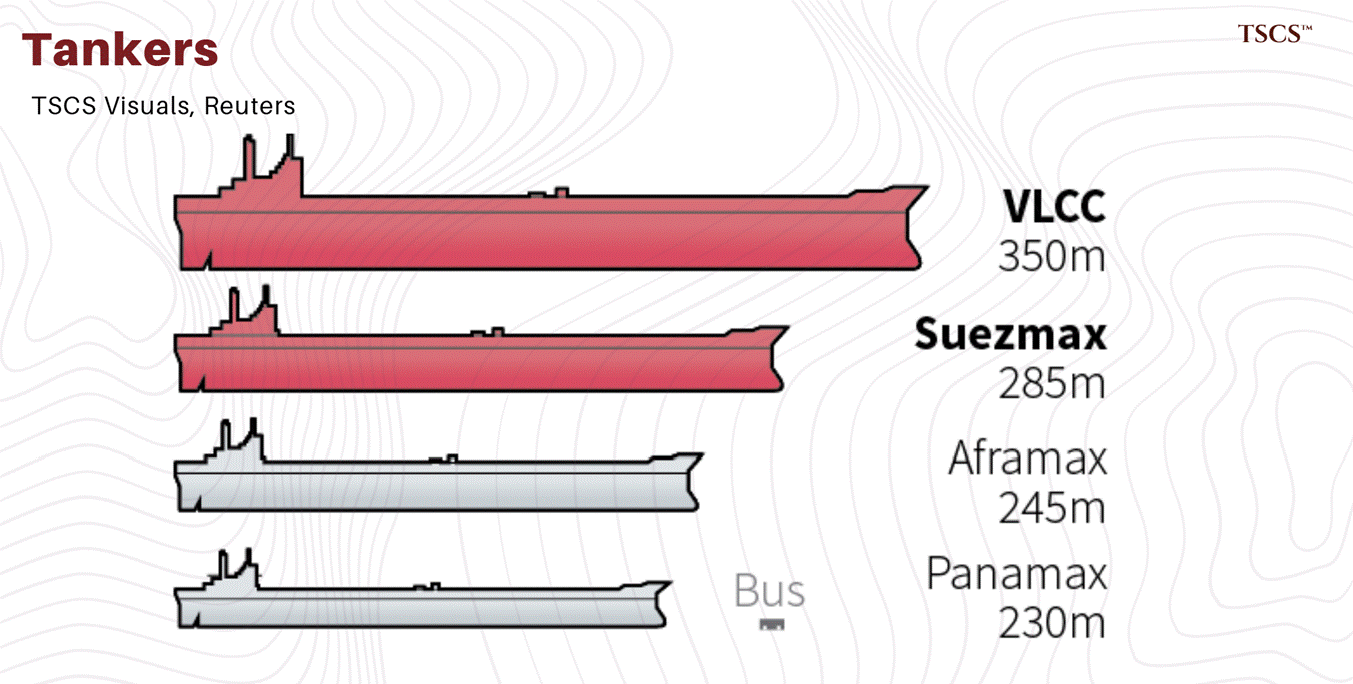
At the waterline the machines become mobile, like banknotes: the arb picks the note that fits the route. A VLCC carries two million bbls and suits long-haul economics, Gulf to Asia above all. Suezmax, about a million, sized historically by the canal. Aframax, around 700,000, the workhorse of shorter hauls and shallower ports, and, not coincidentally, the favourite denomination of the shadow fleet. Product tankers run their own denominations, LR2 and LR1 down to the MR class, carrying the clean cargoes.
The largest moving object human beings ever built was a tanker: the Seawise Giant, launched in 1979 and stretched to 458 metres and over 564,000 deadweight tonnes, so large she could not transit the English Channel fully laden, never mind Suez or Panama.
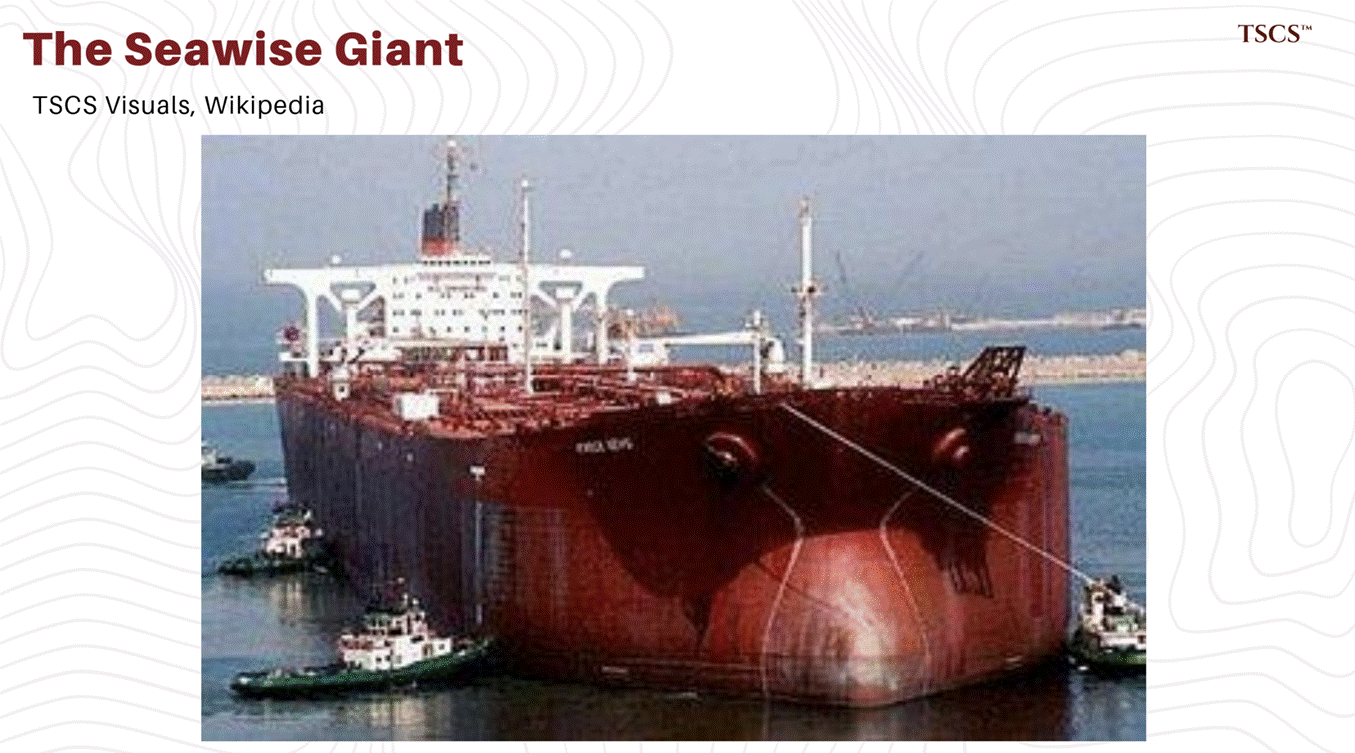
Suez closed for 8 years, and scale was the only answer to the Cape.
Her career toured everything I speak about. In 1988, hauling Iranian crude through the Tanker War, she was bombed by Iraqi jets and settled, burning, in the shallows off Larak Island, declared a total loss, which for most ships is the end.
She was refloated after the war, repaired, renamed and worked for another decade and a half. Too big for most ports, she ended as the port: converted to a floating storage unit moored off a Qatari field, a tank with a famous hull. And in 2010 she made her last voyage to the beach at Alang, India, to be taken apart by hand for the value of her steel, registered, for the occasion, under the name Mont.
Two operational facts carry most of the investable content.
First, the clean-dirty switch is a one-way door in practice: a clean product tanker can drop into dirty crude service easily, but returning to clean costs real cleaning, inspection and grade rehabilitation time, so tonnage migrates toward dirty in strong crude markets and struggles to migrate back. Second, a ship’s usage is its acceptability: charterer vetting policies in practice cap the age of tonnage the majors will fix, and terminal acceptance criteria decide which ships may even berth.
A 15-year-old tanker in perfect class can be commercially dead to the mainstream market and simultaneously the most sought-after asset in the sanctioned one. That sentence is the entire economic logic of the shadow fleet (part 5 will look at its geography).
Tanks are two different businesses.
Commercial tankage is a logistics and optionality asset. Shell capacity is the size of the steel, working capacity is what you can actually use, and beneath working capacity sits the heel, the minimum operating fill below which a tank farm cannot blend, meet delivery specs, or push barrels out at rate.
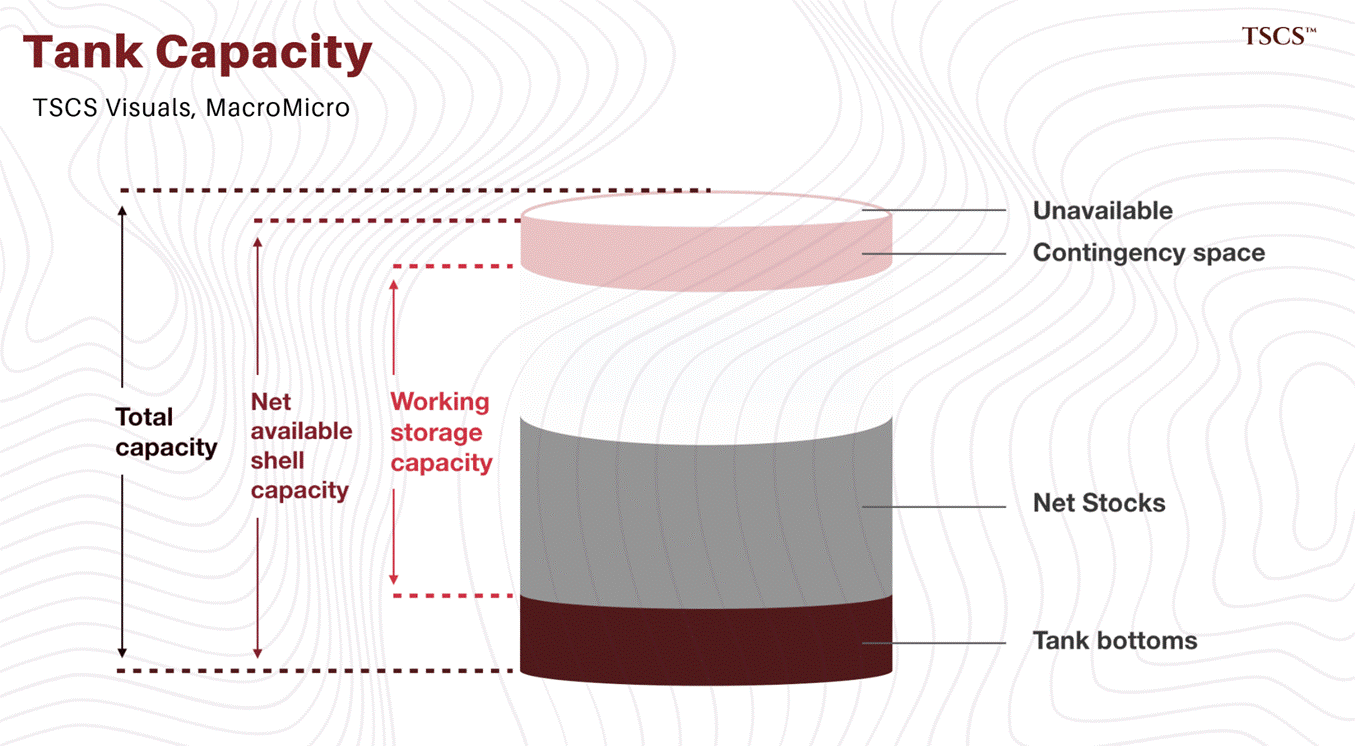
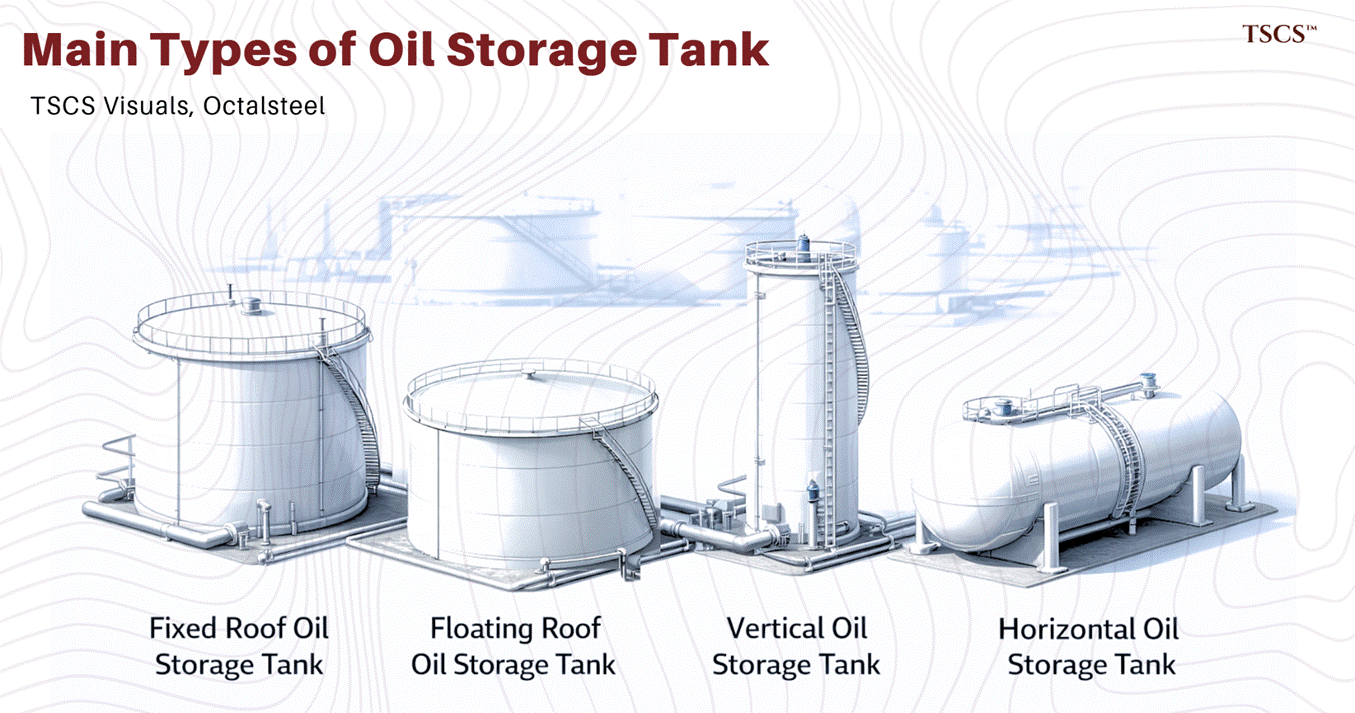
A tank earns in two modes, by cycling, throughput fees on barrels passing through, or by carrying, renting time to a contango trader per Part 3, and the contracts differ accordingly, straight leases for the carry trade, throughput agreements for the cycling trade, with blending rights.
Contamination is the main risk for this industry, it will turn this into a liability business.
On the cliffs, precision wins. Tank tops produced April 2020’s seizure because exhausted deliverability plus a crowd contractually obliged to receive barrels equals a broken price.
Tank bottoms are a different animal.
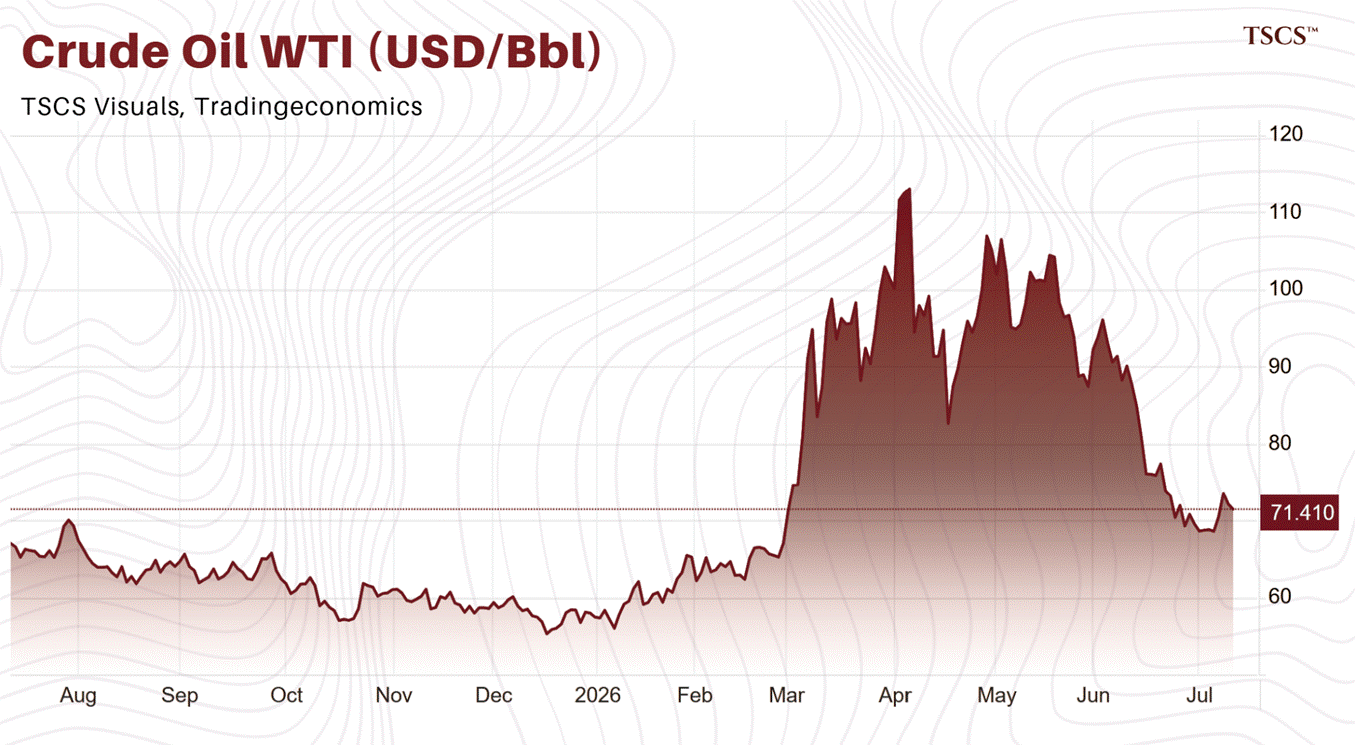
Cushing spent June 2026 near 20 million barrels, at or below what operators treat as the practical minimum, and the market did not seize; WTI even dipped briefly below $70 with the hub near empty, while the stress expressed itself where the ladder says it should, in basis, in operational friction, in squeeze risk into individual expiries.
Tops break the market and bottoms strain it. And the coda: US crude pricing weight has been migrating from the landlocked hub toward the Gulf Coast export complex anyway, a shift Part 4’s benchmark section picks up.
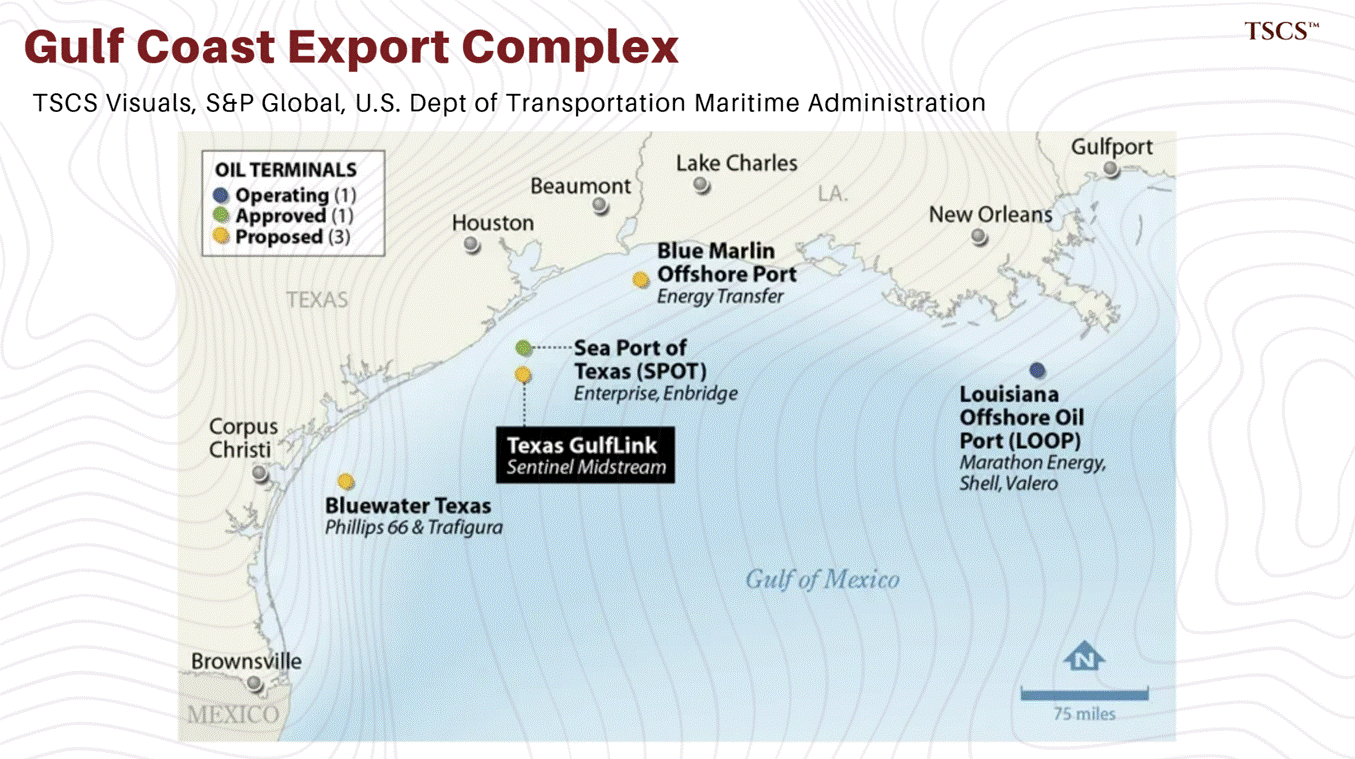
Strategic reserves are the other register: policy instruments, not logistics assets, and even the container is political. The US Strategic Petroleum Reserve is a set of caverns dissolved into Gulf Coast salt domes with water, holes in salt being the cheapest large container physics permits, and self-sealing at that. The republic keeps its insurance in holes, and the holes are emptier than at any time since 1983: 325.7 million barrels at the week ending 26 June, against 714 million of authorised capacity, after roughly 89.5 million barrels of releases following the February closure of Hormuz, the US share of a coordinated IEA programme totalling some 400 million barrels globally.
China’s strategic and commercial state stocks, opaque by design, were estimated by the EIA near 1.54 billion barrels at the end of the first quarter. Read those numbers as what they are: the state acting as the largest storage trader on earth, selling time to the market in an emergency. Whether 2026 makes that a durable feature of the middle or its latest cameo is a question this module keeps open on purpose, Part 7 returns to it.
Since we’re on the subject of what a warehouse is really worth, a story from the metals side of a former life, told as it circulated inside the firm, which stays unnamed.
The house ran warehouses in Congo, and one of the managers working there discovered the purest business model in the physical world: metal that exists only on the ledger. They quoted storage for tonnage that was never there, and collected the holding fees. It ran for years, and she was caught only after the take had reached the tens of millions.
The same trick surfaced at Qingdao in 2014, where the same aluminium was pledged to several banks at once.
The lesson is that storage is a trust business. The world’s entire apparatus of warehouse receipts, tank certificates and inventory reports rests on the assumption that somebody occasionally opens the door and counts. Somebody occasionally doesn’t. Hold the thought until Part 5’s shadow fleet.
Export capacity isn’t wellhead capacity and it isn’t even pipeline capacity. Most US Gulf ports can’t fully load a VLCC at the berth, so the trade reverse-lighters, loading smaller ships that fill the big one offshore, a cost and time tax on every barrel.
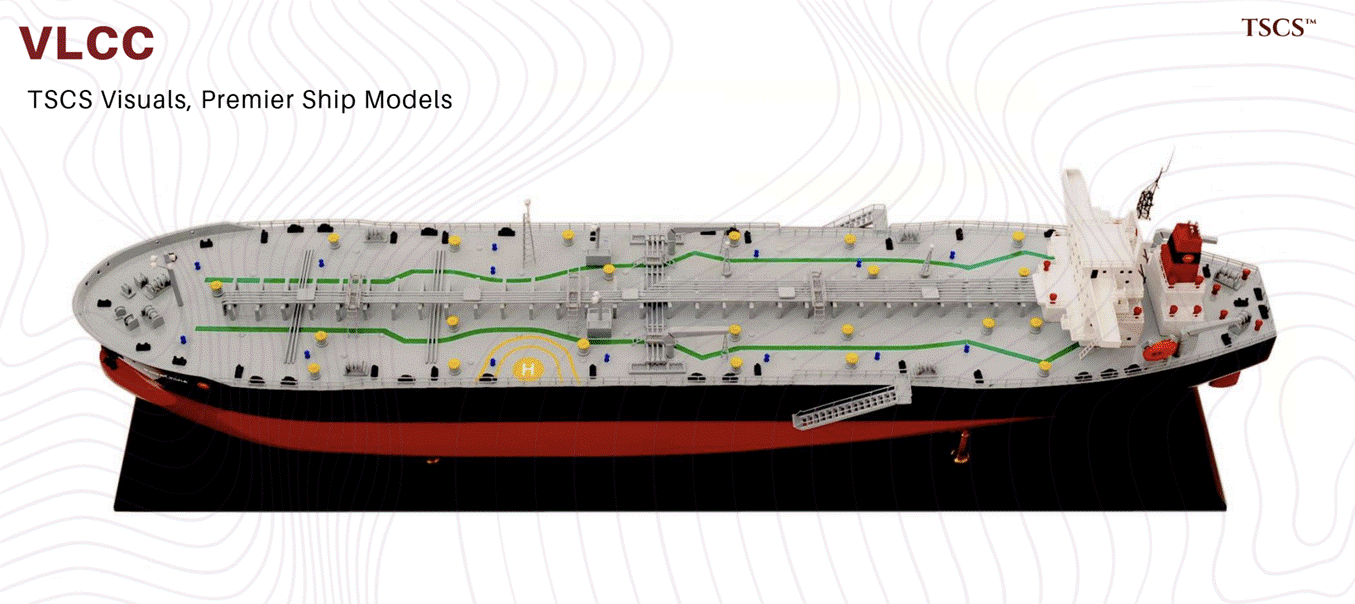
The investable point: in an export-led US crude market, the marginal constraint migrates seaward, from the rig to the pipe to the dock, and each migration hands the pricing power, briefly, to whoever owns the newly binding rung. Terminal acceptance also belongs in the permission stack: a dock that won’t take your ship, your grade or your paperwork is a closed rung regardless of the steel.
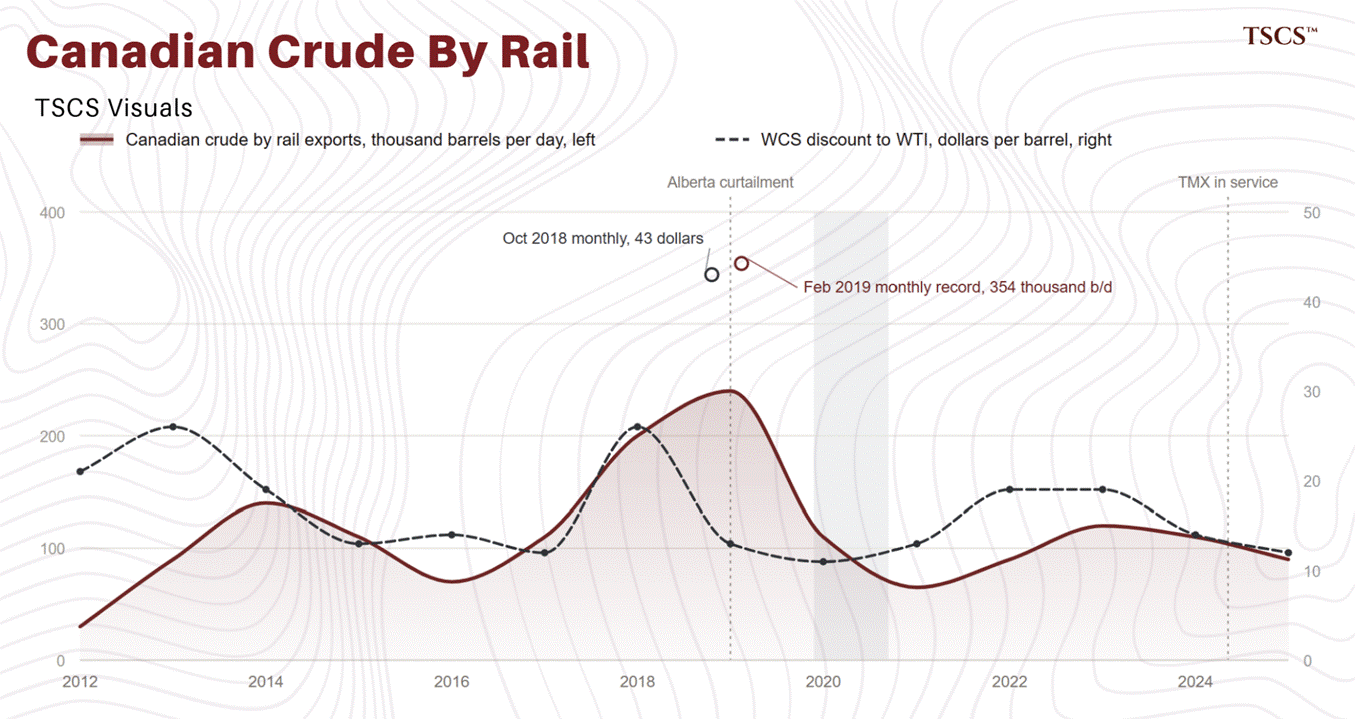
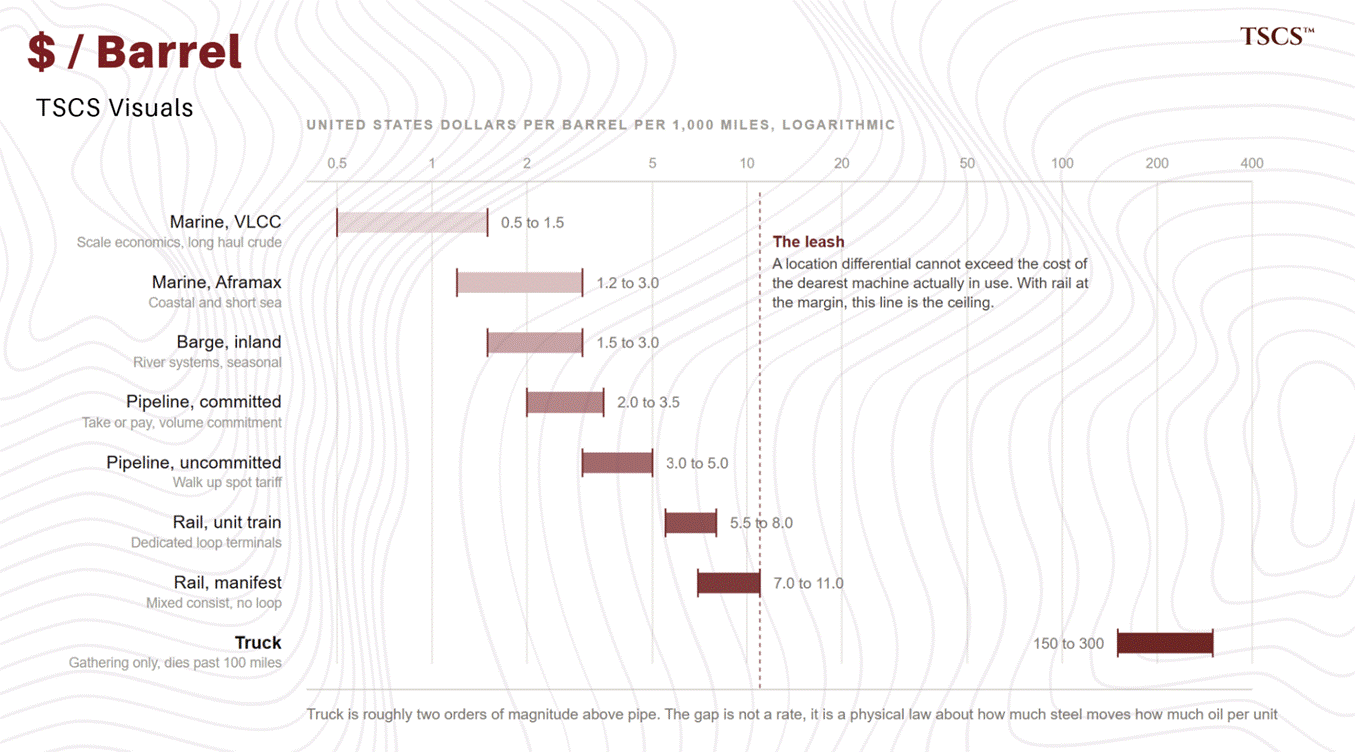
The dearest rungs have wheels. Crude by rail costs a multiple of pipeline transport, because rail is the expensive overflow valve, the volume of crude moving by rail is a direct, public gauge of how badly the cheaper rungs have filled. The Bakken boom rode rail while the pipes caught up; Canadian producers have repeatedly surged crude by rail exactly when egress tightened and differentials blew out past rail economics. When you see railcars full of bitumen, you are looking at the ladder law executing in public: the differential widened until the expensive machine turned on.
And the rate card understates the top rung, a fact I paid for personally. At a mining operation in eastern Africa, recently, the trucks I moved provoked a community revolt, over dust: loaded trucks through villages pick up the road and throw it into people’s homes and lungs, and the operation stops until the operation makes it right.
What the freight quote calls a road is, on the ground, a living organism, water trucks for dust suppression, repairs you fund yourself, relationships built and rebuilt with everyone who lives along the route, and none of it optional, because a community that closes the road has removed a rung from your ladder without touching a machine.
Diesel completes the picture, because at a remote operation the top rung is also the power grid: generators, crushers, the whole facility drinks it, a fixed cost with no substitute, which in a thin-margin chain makes it a cost you must police.
One of our facilities learned that the expensive way.
Over a long period, a small syndicate made around $300,000 by systematically watering the fuel tanks, selling the skimmed diesel and leaving the gauges reading full. The fraud was invisible in the fuel ledger, water reads as volume, and it surfaced where physical-world fraud always surfaces: downstream, in the maintenance bill. File the general law, because it recurs from fuel tanks to shadow tankers: in the physical economy, quality theft propagates as capex.
Everything in the middle gets paid for closing one of three gaps: where a barrel is versus where it is wanted, when it exists versus when it is needed, and what it is versus what the buyer’s equipment can digest.
Space, time, form. Every ship, tank, pipe and blending header on earth closes one of them, and every famous midstream fortune, including a few minted in the past six months, is one of these three trades. (There is technically a fourth gap, between a barrel that may legally move and one that may not; the sanctions era has minted fortunes on that too, but permission is a regime, so it gets its own section in Part 7.)
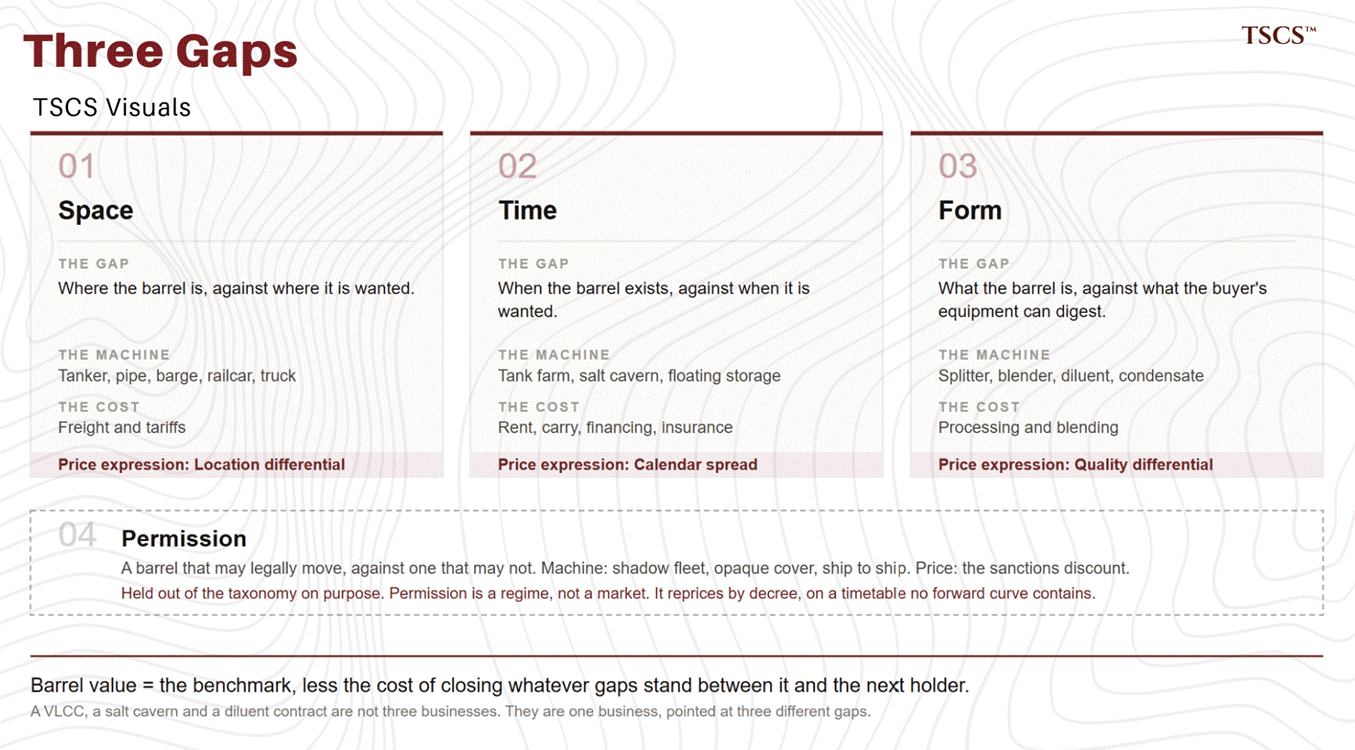
Learn the three properly and most of the sector’s apparent complexity collapses, because a VLCC, a salt cavern and a diluent contract stop being different businesses. They are the same business pointed at different gaps, and a barrel is worth the benchmark minus the cost of closing whatever gaps stand between it and the next holder.
If you want this watched barrel by barrel rather than framework first, The Oil Bandit writes the physical market from inside it, which is the perspective this part is trying to teach.
Tanker freight on most spot routes is quoted in Worldscale points, a system that works like a taxi meter recalibrated once a year. The Worldscale Association publishes an annual flat rate for every meaningful route on earth, a dollars-per-tonne figure for a standardised notional tanker, rebuilt each year from bunker prices, port costs and exchange rates.
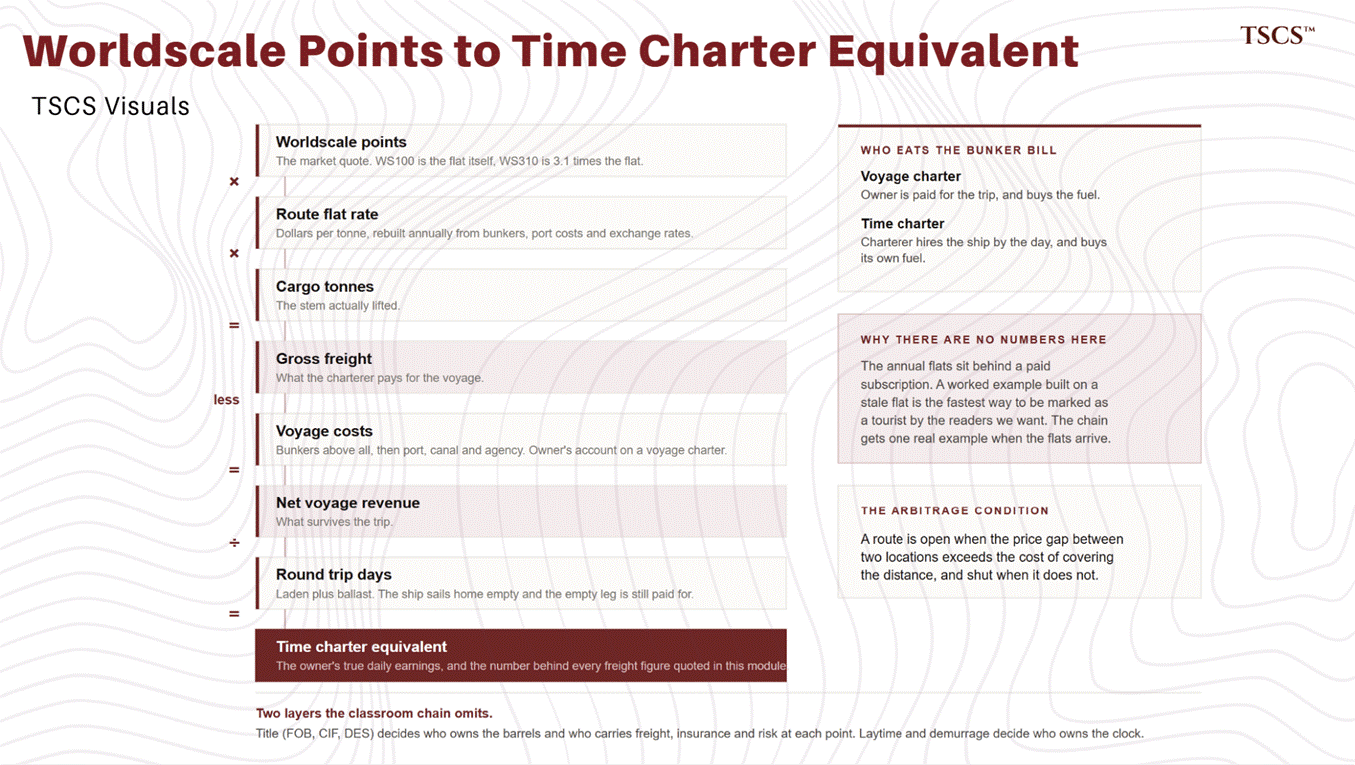
The market then haggles in percentages of the flat. WS100 is the flat itself. WS310, where the benchmark Gulf-to-China route was fixed in late June, means three point one times the flat, and tells you at a glance that the meter is running at triple its calibrated norm without needing to know a single dollar figure.
The number an owner actually cares about is this: points, times the route’s flat, times cargo tonnes, gives gross freight. Subtract the voyage costs the owner bears, bunkers above all, then port and canal charges. Divide what is left by the round-trip days, ballast leg included, because the ship sails home empty.
The result is the time-charter equivalent, TCE, the owner’s true daily earnings and the number behind every freight figure in this module.
We present the chain symbolically rather than working an example, for the reason that the flat rates will be available to paid subscribers, and a worked example built on a stale flat is the fastest way to get marked as rookies by the readers we want.
When the current flats arrive, the chain gets one real example.
Two contract forms split the risk.
On a voyage charter the owner is paid for the trip and eats the bunker bill. On a time charter the charterer hires the ship by the day and buys its own fuel. This distinction explains how the spot and period markets could look at the same war all June and price it completely differently: spot near $470,000 a day on the 23rd, twelve-month period money around $110,000.
The spot market prices today’s scarcity. The period market makes a forecast with everything else a charter is, risk transfer, budget discipline, counterparty credit, and an owner’s reluctance to sell the convexity a crisis makes valuable.
Two more layers separate the classroom TCE from a real voyage P&L. The first is title. FOB, CIF and DES are not jargon, they are the answer to the only question that matters about a cargo: who owns the barrels, and who carries the freight, the insurance and the risk, at each point between the loading flange and the discharge port.
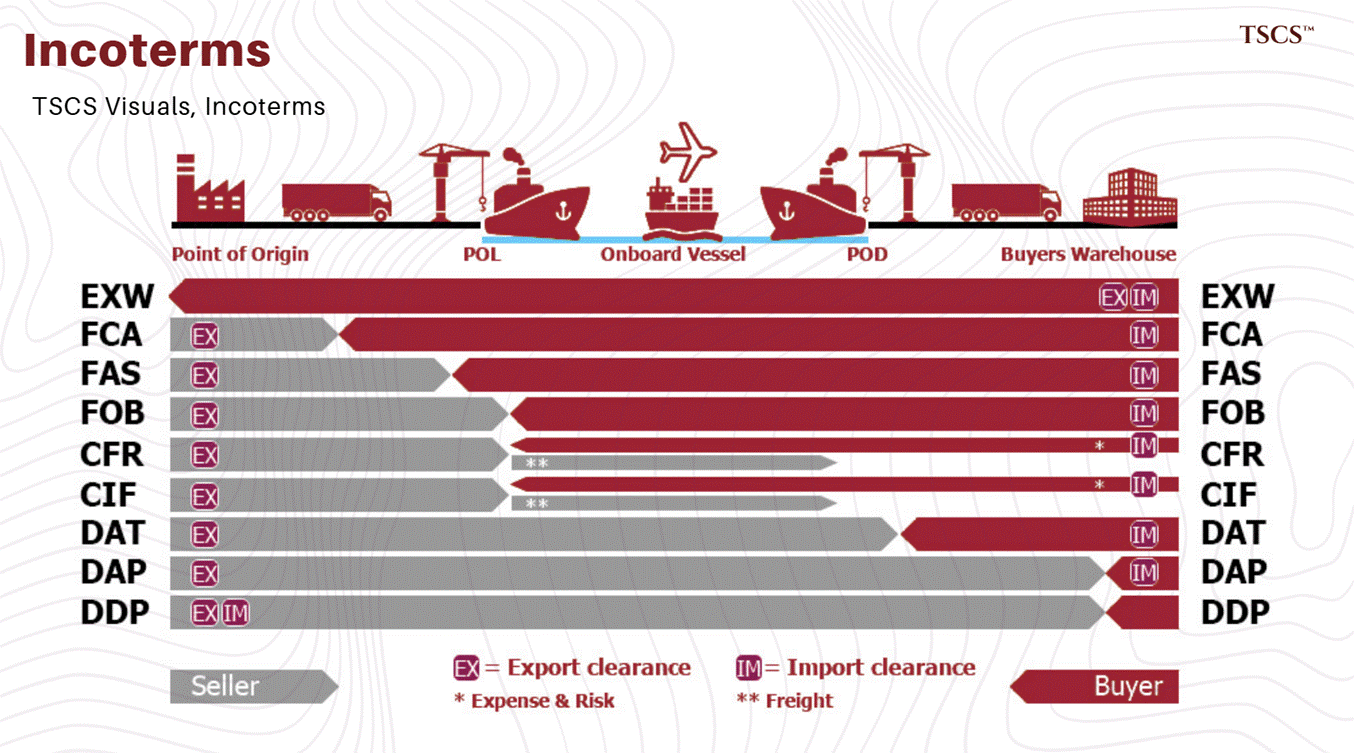
Free on board, the buyer takes title at loading and arranges the ship.
Cost, insurance and freight, the seller delivers with the freight baked into the price.
Delivered ex ship, the seller carries everything to the far end.
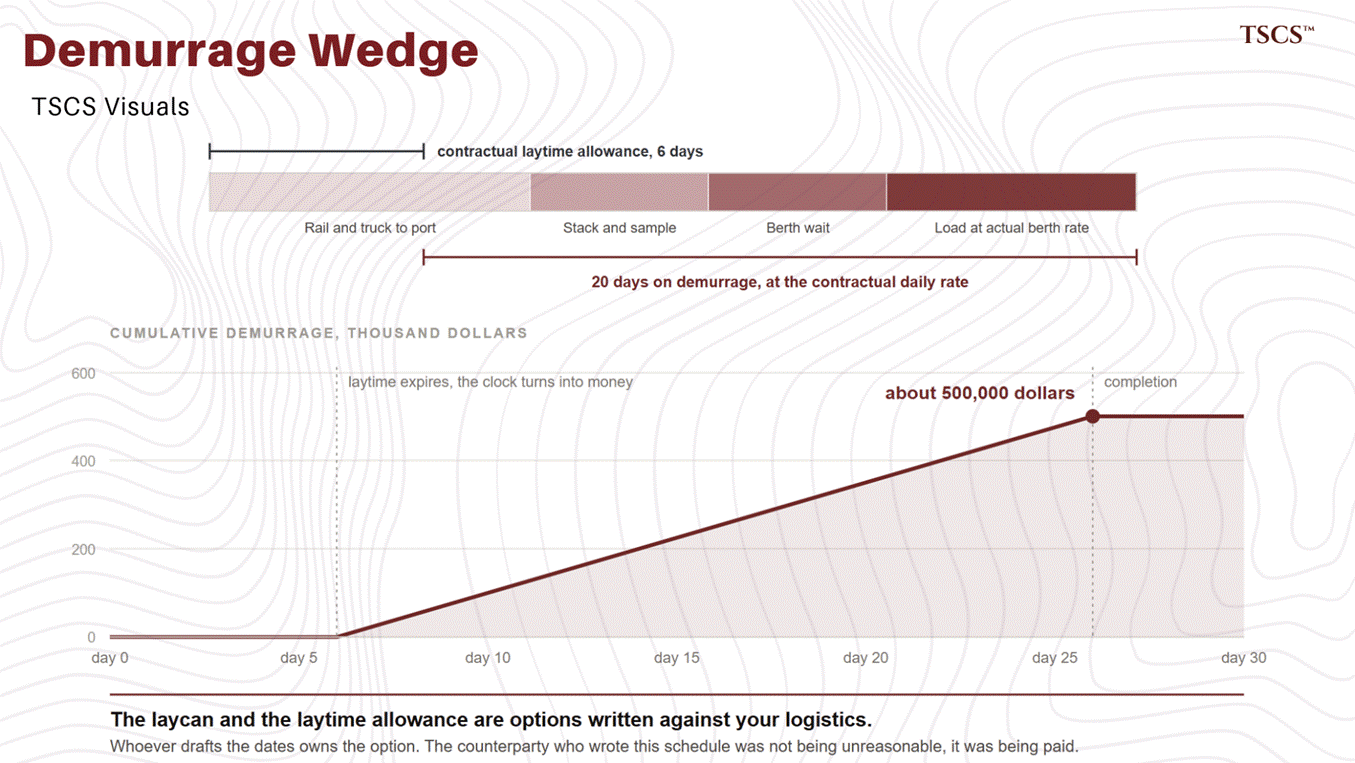
The second layer is the clock. A charter allots the voyage a fixed allowance of loading and discharge time, laytime, which starts when the ship tenders notice of readiness; run past it and the charterer pays demurrage at a daily penalty rate, finish early and dispatch flows back the other way.
In a calm market this is a rounding error. In a congested or dangerous one, with queues forming and transits collapsing, well, they’re fucked.
The clock has taken money from me personally. In a previous commodity job, I sold chrome ore on terms where the counterparty wrote the shipping schedule, and wrote it tight: a loading window that looked reasonable on paper and was physically impossible against the chain behind it, ore railed and trucked to port, stacked, sampled, and loaded at the berth’s actual rate rather than the contract’s imagined one.
The vessel arrived, tendered notice of readiness, and the clock started running against an allowance the cargo could never meet. Every day past the allowance accrued demurrage at the contractual daily rate, and by the time the arguing finished, the bill was about half a million dollars, weeks of a large bulk carrier’s time, purchased by one line of dates in somebody else’s contract.
An expensive lesson: the laycan and the laytime allowance are options written against you.
The condition that governs every route on the planet fits in one sentence: a route is open when the price gap between two locations exceeds the cost of covering the distance.
That’s basically the entire theory of oil arbitrage; everything else is implementation.
When freight triples, marginal routes die, captive routes pay up, which is why Part 4 treats freight and differentials as the same information read from two directions.
Onshore, the price of space is less intense, because most of it is set by regulators and contracts rather than by a market.
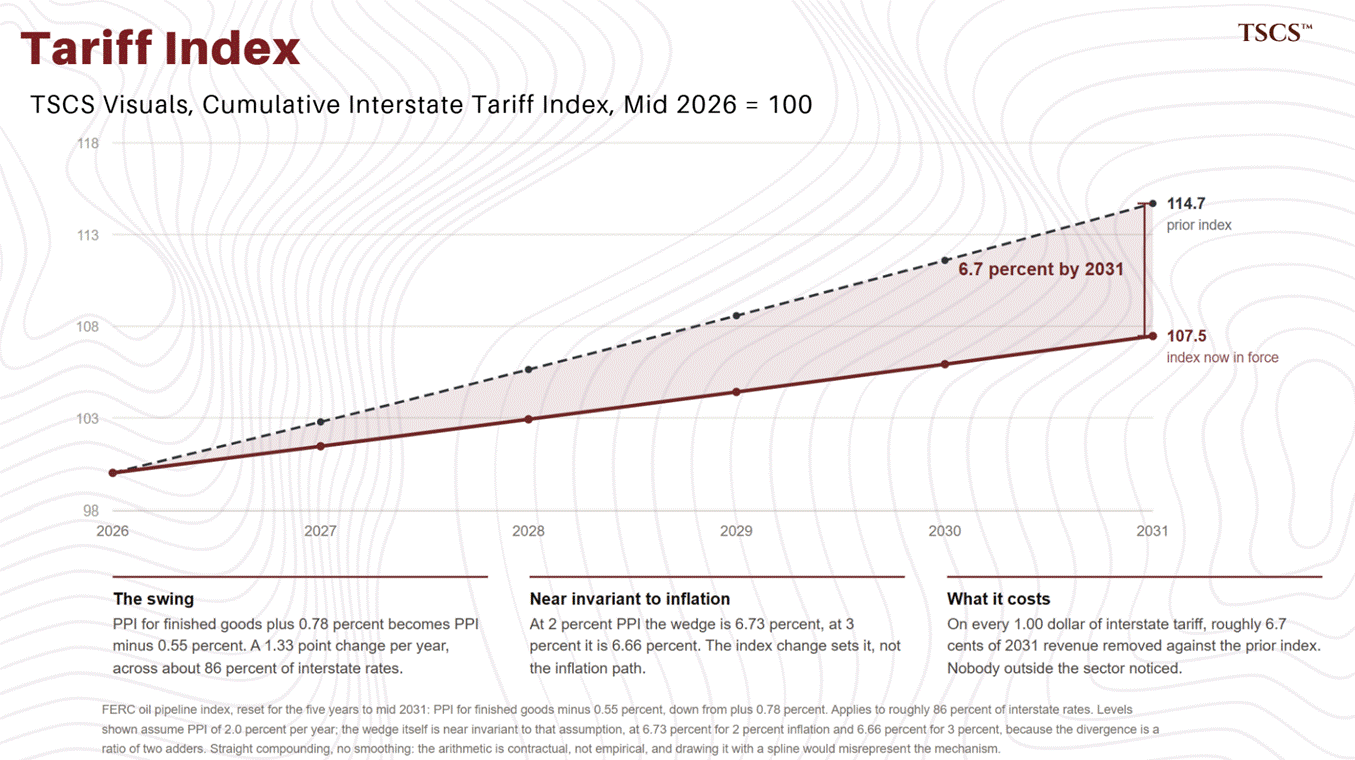
A US interstate pipeline’s tariff drifts with FERC’s index, which just reset for five years, PPI for finished goods minus 0.55% through mid-2031, down from plus 0.78, a swing of roughly 1.3 points a year across about 86% of interstate rates. Nobody outside the sector noticed; Part 7 explains why pipe owners very much did.
Around the regulated core sit the negotiated structures from Part 2, take-or-pay and minimum-volume commitments, which is why pipeline cash flow barely flinches when volumes wobble. Pipe reprices to whatever the ladder says space between two points is worth, and its pricing power lasts as long as it stays the cheap machine with no substitute.
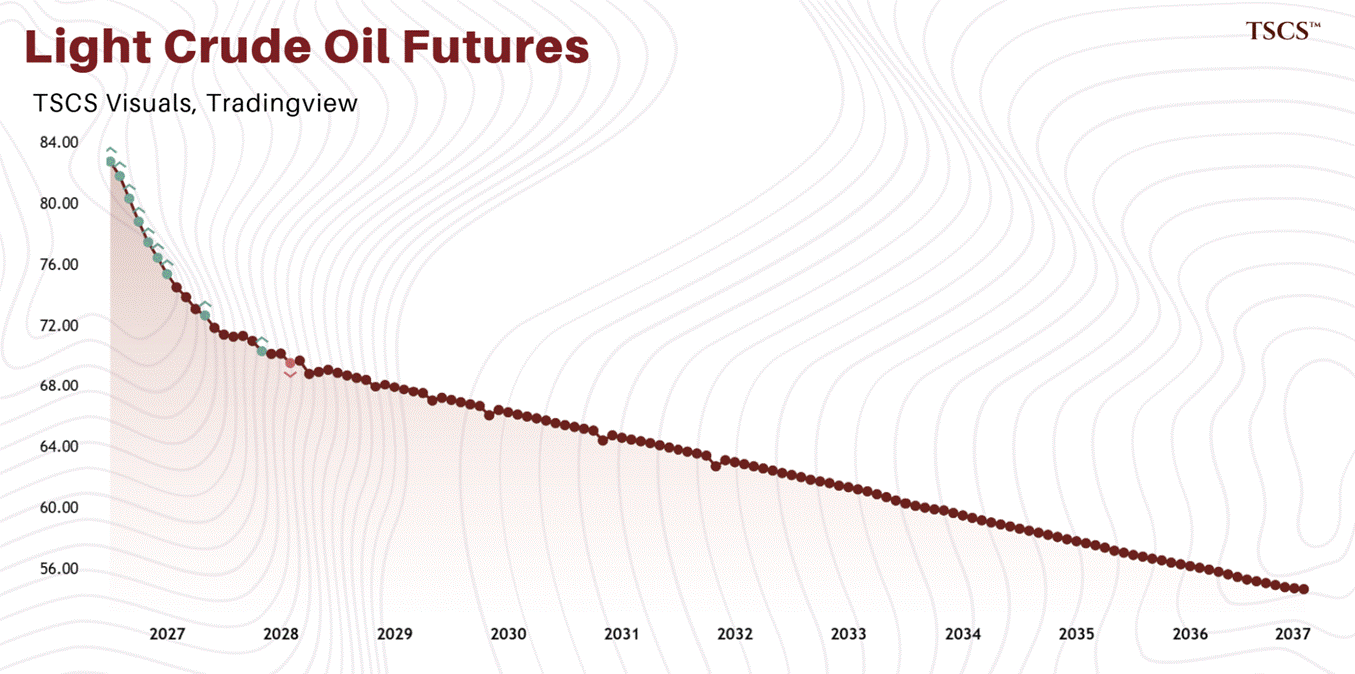
The futures curve is the published price of time, and most people look past it.
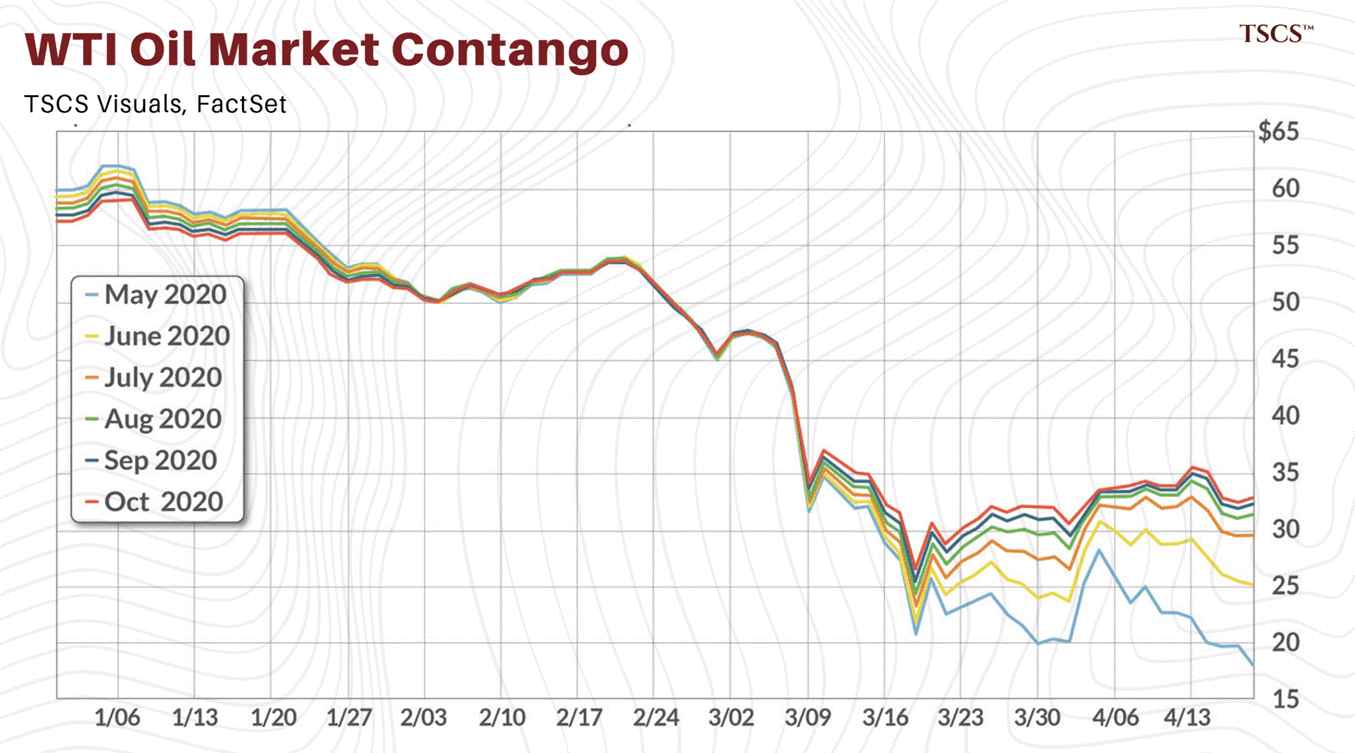
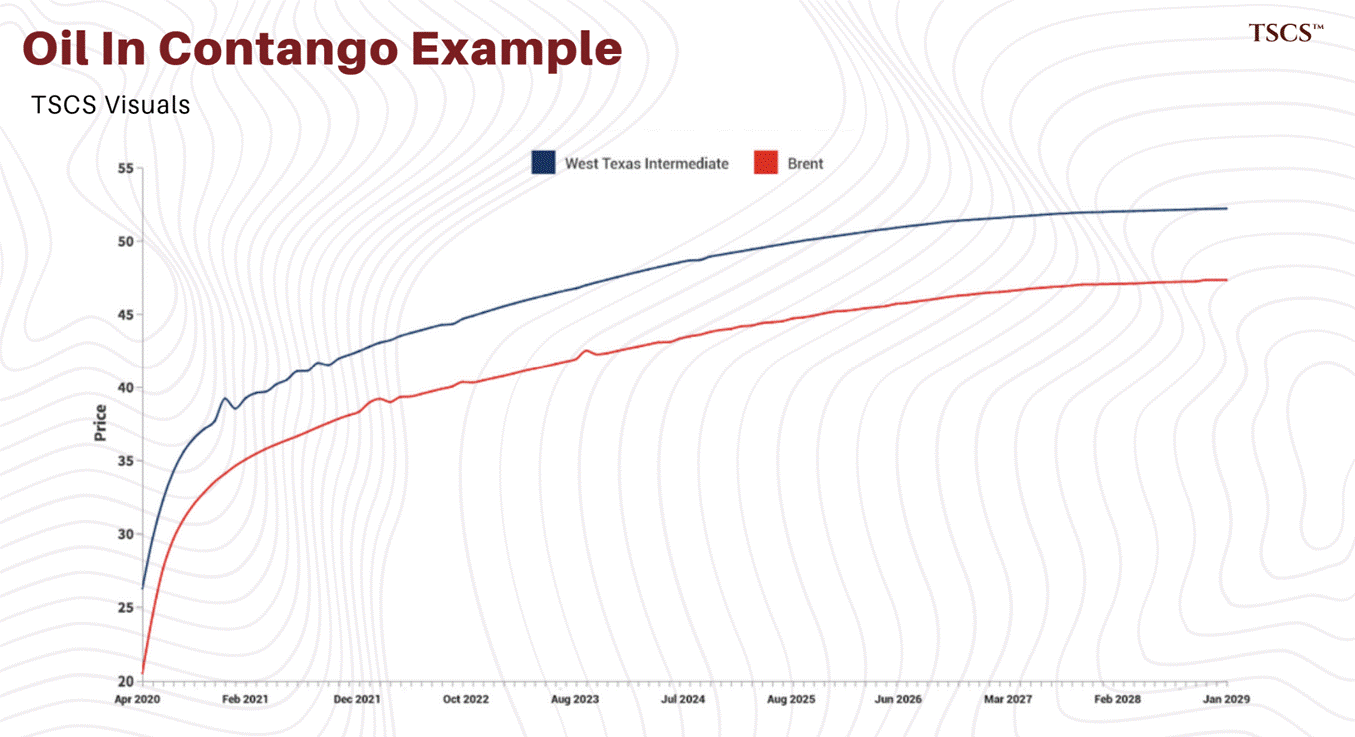
When the market has too much oil today relative to later, deferred months trade above spot, contango, and the curve is offering to pay anyone who can warehouse the surplus. The trade is mechanical: buy the spot barrel, sell the deferred future against it, store the barrel, deliver it into the sale. If the spread beats the cost of storing plus financing the barrel in between, the difference is locked the day both legs go on.
When the market is short oil today, spot trades over the deferreds, backwardation, storage earns nothing, and inventories drain, because holding barrels is holding a depreciating asset. The curve’s shape is the market’s own signed statement about whether the physical present is heavy or tight, available every day.
Then there’s the spring of 2020, when the curve yawned open.
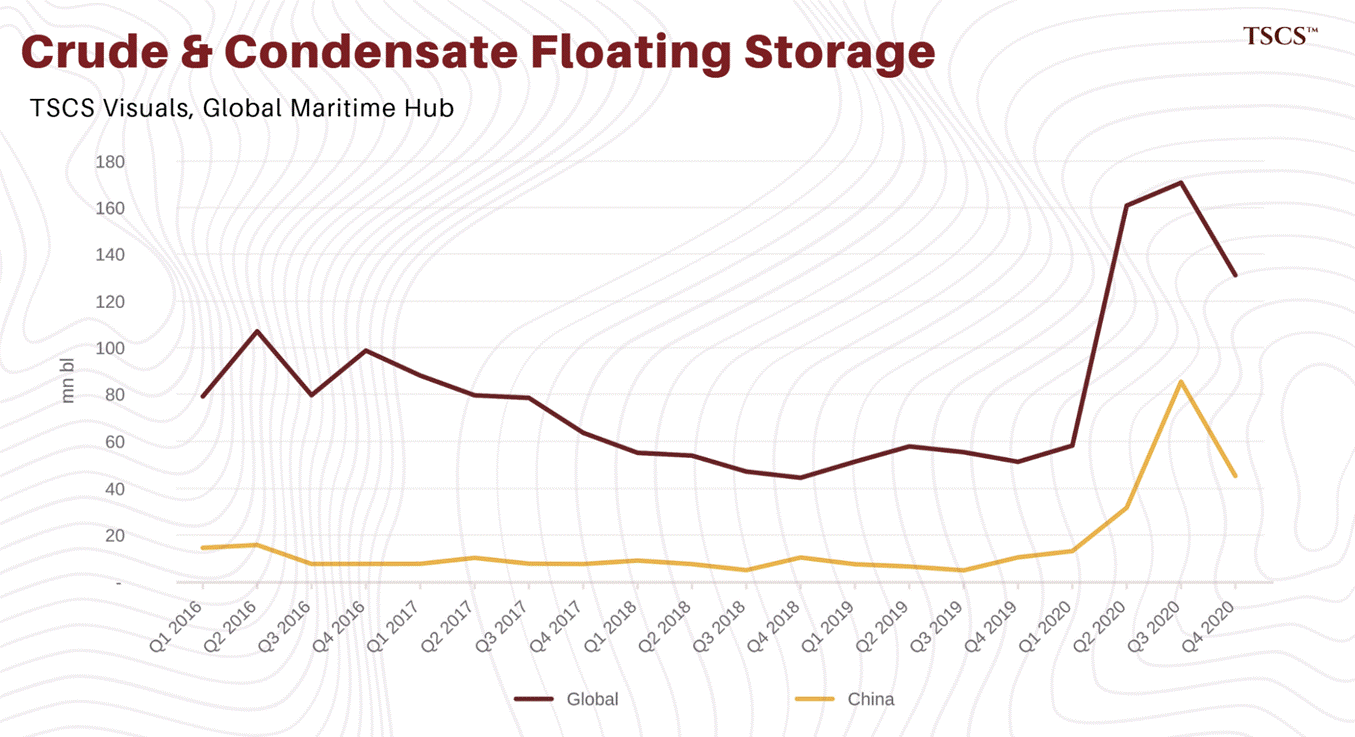
Demand had fallen into a hole, spot collapsed against the deferreds, and the spreads blew out past tank rent, past financing, past everything, until they covered the most expensive warehouse on earth: the world’s largest ships, hired to sit still.
Floating storage peaked around 200 million barrels that May. Traders locked spreads against chartered VLCCs, everyone in the chain fed off the same broken curve. Euronav alone booked $485 million of net profit in the first half of 2020. Vitol cleared $3 billion for the year. It was the same event that printed -$37.63 at Cushing, seen from the other side of the trade: the people who got paid were holding tankage and patience.
The trigger logic recurs every cycle.
Onshore tanks fill first, cheapest space first, always. As cheap space runs out, the spread has to widen to recruit the next. So the moment floating storage starts building is itself a signal: the contango has blown past the marginal tank, and the surplus is worse than the onshore data states.
So watch for the moment the curve starts paying for tanks, and then for ships. That is the surplus announcing itself before the onshore data admits it, and it costs nothing to watch.
The third gap is the least visible and, per dollar of capital, often the most profitable, because physical markets have a cool feature: the specification cliff.
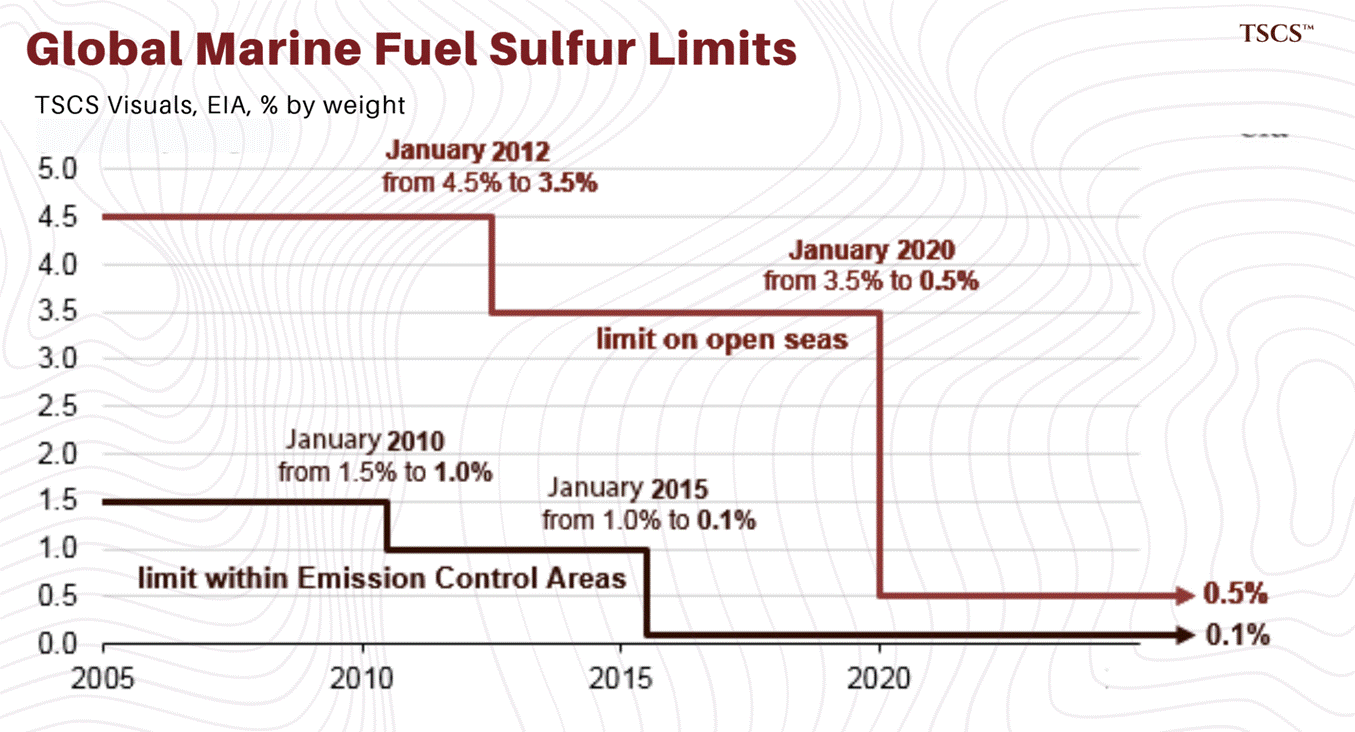
A refined product or crude grade is a pass-fail exam. Fuel oil at 0.50% sulphur is a compliant, sellable commodity; the same product at 0.51% is a different, cheaper product with a smaller buyer pool. Price does not slope across that boundary. It steps.
So there’s a trade: buy the failing stream at its discount, buy a correcting stream, combine them in a tank until the blend passes, sell at the compliant price.
This is done every day, at scale, in Rotterdam, Fujairah and Singapore, by people who never appear on financial television and generally prefer it that way.
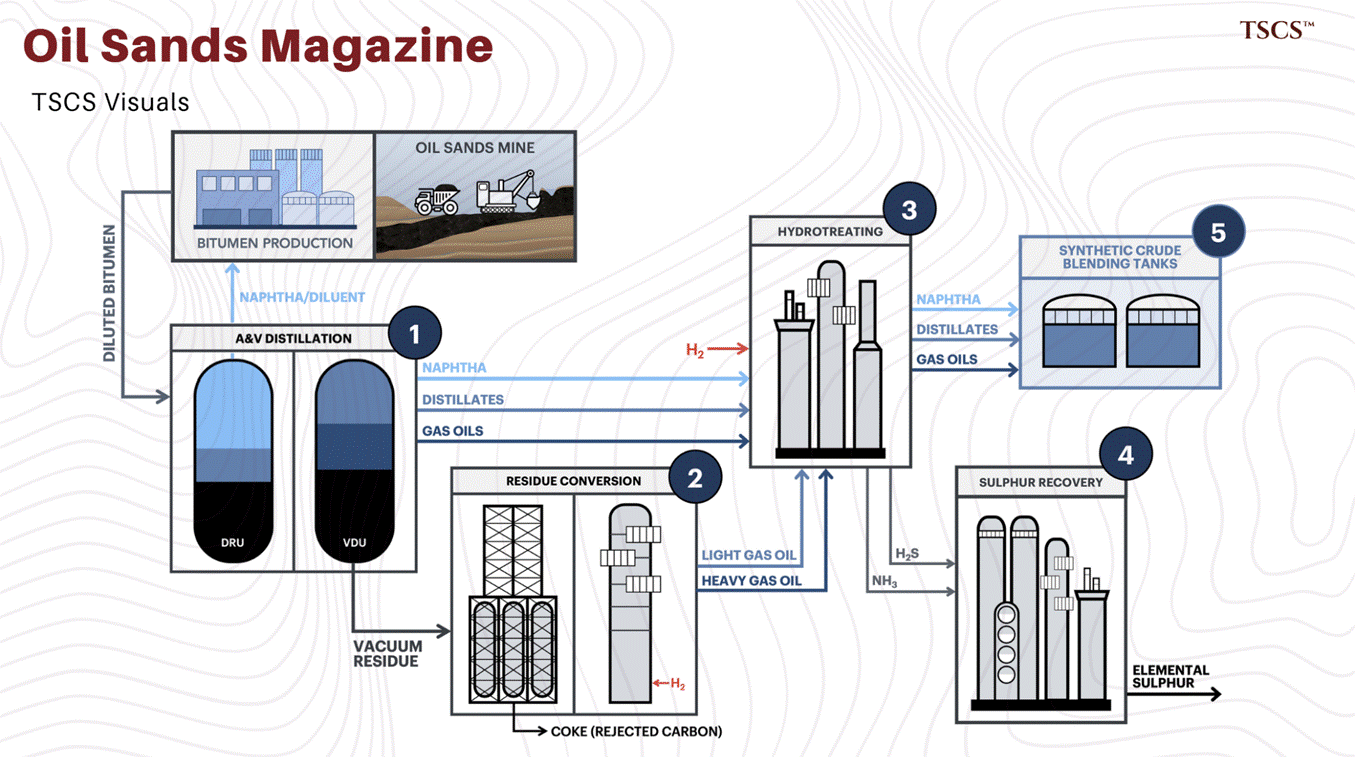
Two case studies carry the concept. Canada first: raw bitumen is too viscous to enter a pipeline at all, so it moves as dilbit, bitumen cut with about 30% purchased condensate, meaning every barrel of Western Canadian Select embeds a form trade before it travels a metre, and the WCS differential is really three prices braided together, heavy-crude quality, pipeline space, and the running cost of the diluent that makes the barrel a liquid.
The second is IMO 2020. On 1 January 2020 the permitted sulphur in marine fuel dropped from 3.5% to 0.5%, and overnight the world fleet became non-compliant.
High-sulphur fuel oil fell toward its blending value, compliant fuel commanded a premium, and a global scramble began to conjure the new grade out of blend components, a bonanza for anyone holding tanks.
The spread between the two fuels then flowed straight into freight, fuel being the largest voyage cost an owner bears, and ships fitted with scrubbers were allowed to keep burning the cheap stuff. One regulation, written by a UN agency about smokestacks, repriced a refining stream, a blending complex, and the relative value of every large ship on earth simultaneously.
Gas processing runs the same logic under a different name, the frac spread, the gap between natural gas liquids sold separately and the same molecules left in the stream and sold as heat. Wide spread, extract everything; inverted spread, the ethane stays in the pipe. Part 2 already made the joke, so here it is just the plumbing.
There is a common story about oil traders, and it’s wrong. The story goes that traders bet on direction, oil up or oil down, and the great ones are simply right more often.
Every professional in the physical business knows this is wrong, and every generalist repeats it anyway. This section, written with Giacomo, puts it away.
Flat crude is about the most competitive market on earth: transparent futures, deep liquidity, sub-second execution, and a very large number of well-informed people pricing every headline within seconds. Whatever excess return once existed in guessing direction has been arbitraged to dust, and nobody in the physical business trades flat price for a living, not sustainably.
What the good firms buy instead is optionality.
Space: a trader can see a $2 spread between two ports on a screen, but only a trader with a chartered ship or a berth slot can turn it into cash. Time: anyone can see a $3 contango, but only a leased tank monetises it. Form: the heavy-light gap and the jet crack are public numbers, and they pay only whoever holds the blending kit, the laboratory, and the spec engineer who knows what the buyer will actually accept. Do you get it? It all concludes the same way.
Assembling the portfolio is prosaic and expensive. A VLCC time-chartered for a year at $50,000 a day, per Baltic fixture disclosures current to July 2026, is a committed $18.25 million per ship per year, paid whether the ship earns spot or not (a lot of money for hoping a ship stays boring), and a big book carries call it 30-50 of them.
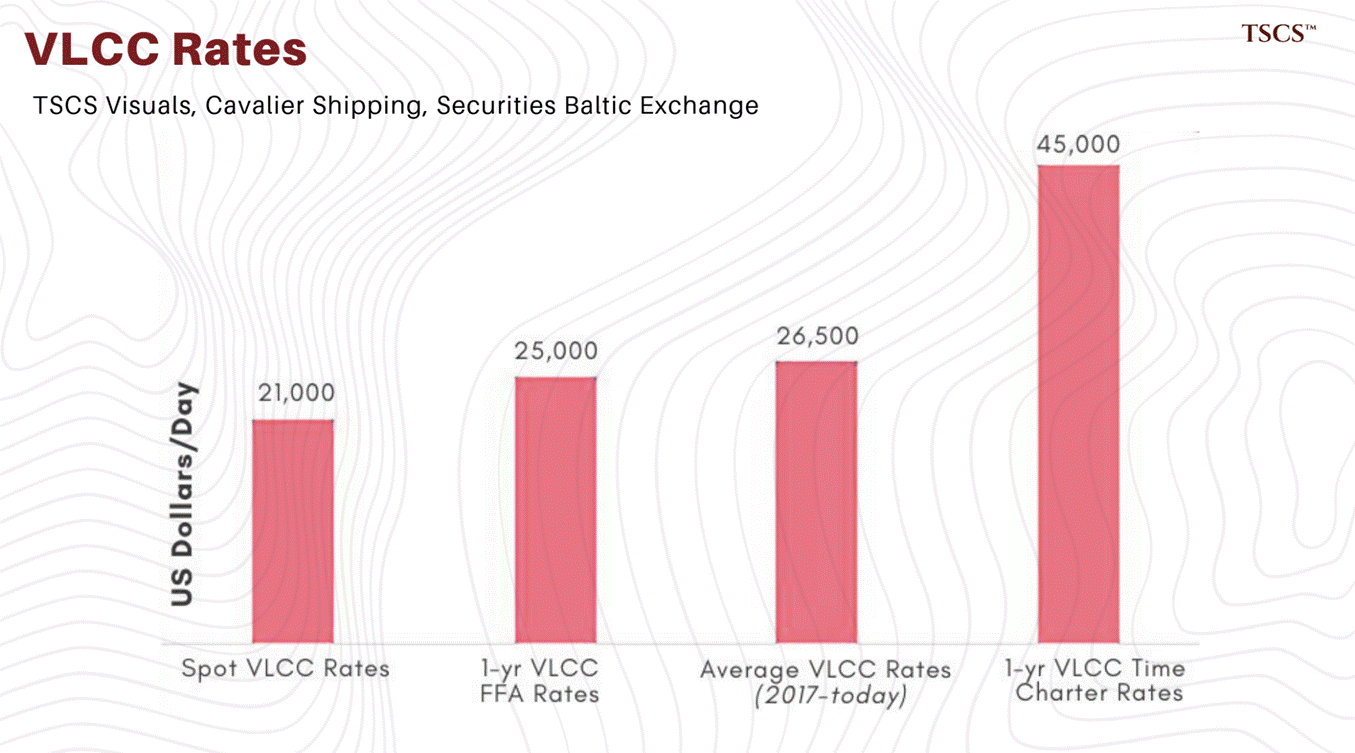
The public fixtures show the shape: a Suezmax locked for five years at $30,000 a day in January, an Aframax for two years at $43,000 in July. Leased tankage at the hubs runs 30 to 50 cents a barrel a month in normal times, brokers reported some tanks briefly above a $1.50 in the 2020 squeeze, so a book holding five to ten million barrels of tankage is paying $20 to $60 million a year of carry.
Then the layer that stops looking like trading at all: VTTI, the terminal network Vitol co-owns, holds about 9.1 million cubic metres across 16 terminals earning low single digits in calm markets and immense pricing power in broken ones. The refineries follow the same logic, Vitol’s Rotterdam condensate splitter, its Fujairah stake, Geelong through Viva; Trafigura consolidating Puma Energy at 93%; Gunvor running Ingolstadt and, until feedstock economics killed it in late 2024, Rotterdam Europoort. That is the option premium, and it explains Vitol’s $15 billion in 2022.
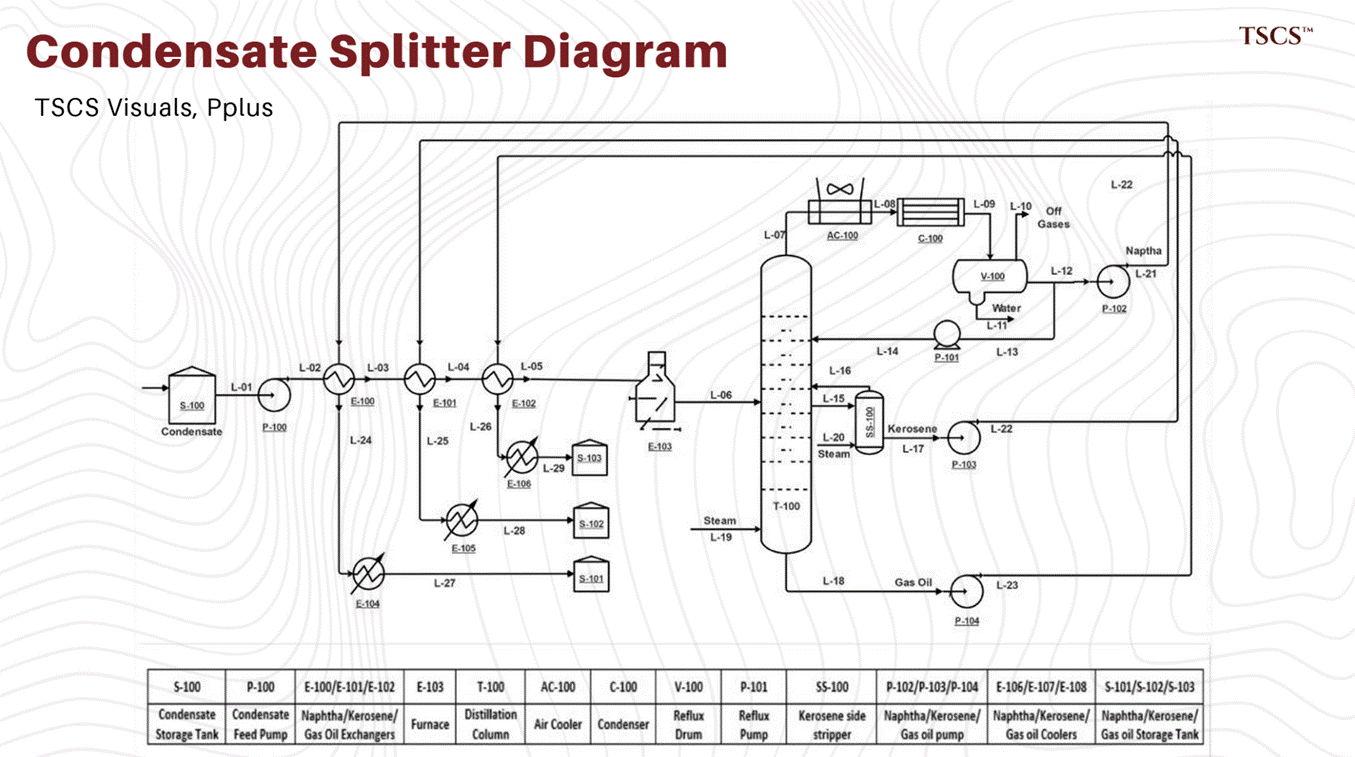
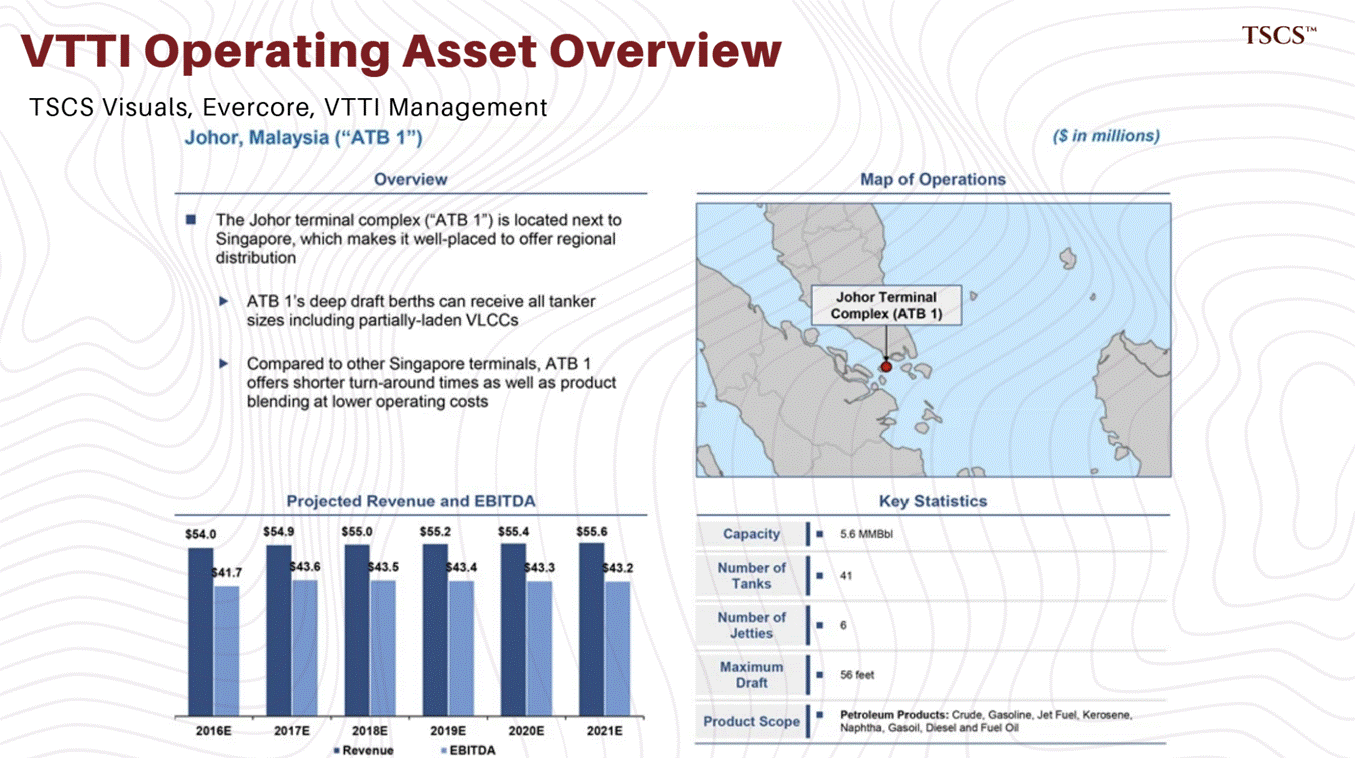
And the least visible leg, prepay financing: cash advanced today against barrels delivered over the next 1-5 years, this business exploded after 2020 because the banks left after they were burned by the trade-finance frauds.
Total sector prepay is not publicly reported; informed inference from producer disclosures and press coverage puts the top houses’ outstandings somewhere in the $10 to $20 billion range.
Add the layers and a Vitol-scale book is carrying perhaps $2 to $4 billion of committed cost per year before it books a single trade.
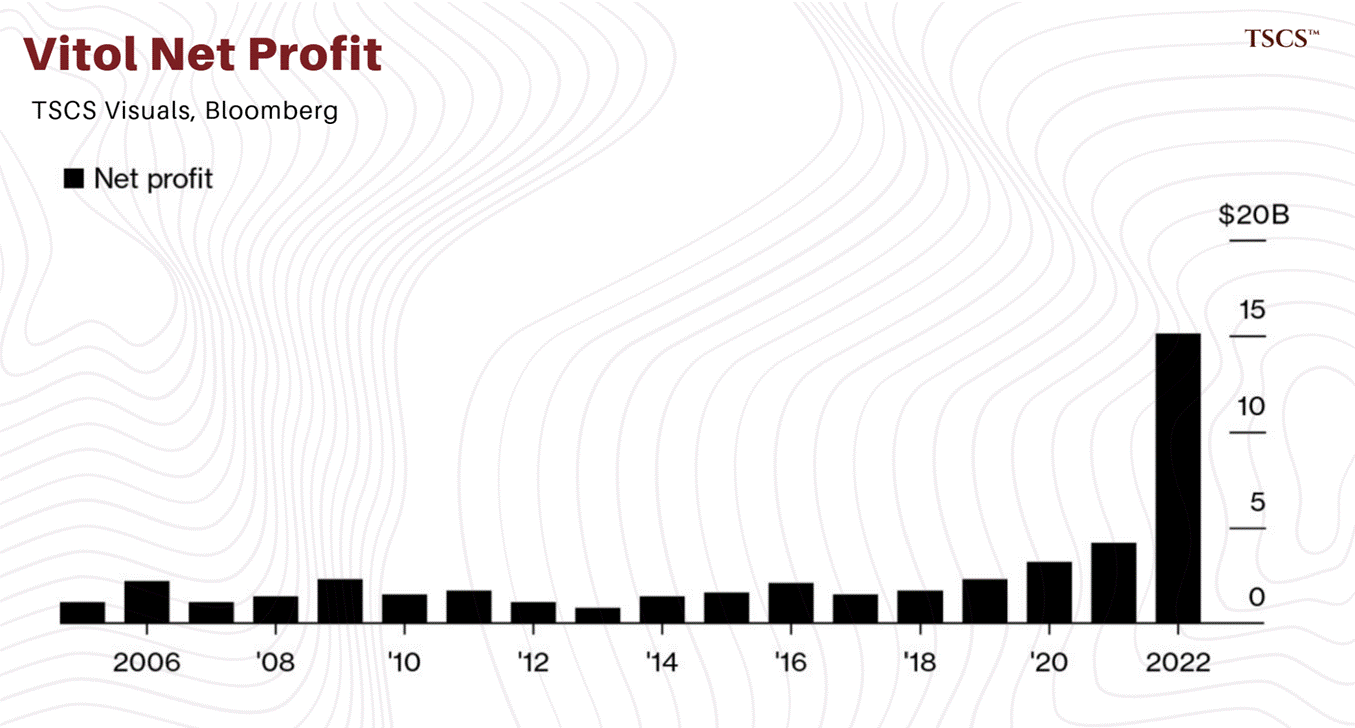
The naive reader hunts for the directional bet. There was no directional bet.
There was a decade of premium payments on options that all struck at once: the tanks filled in the 2020 squeeze, the ships repriced when Russia’s rerouting stretched every voyage, the terminals captured storage economics that had been priced at nothing through the calm, the refineries earned cracks not seen since 2008.
The house didn’t have to be right about anything. It had to be present, insured and staffed.
Presence is necessary, though, and not sufficient, which Gunvor’s 2025 demonstrates: net profit down 85% to $104 million, with $462 million of impairments.
Options on the physical world still carry counterparties, jurisdictions and licences, and Part 7’s permission stack applies to the people who own the optionality most of all.
So when a generalist reads a trading house income statement and sees a lucky bet on price, the correct reading is different: the P&L is the mark-to-market on a decade-old book of real options, revalued the moment a chokepoint tightens or a curve inverts.
The middle of the oil market manufactures price.
The number on your screen labelled Brent isn’t discovered in some abstract clearing of global supply and demand and then applied to barrels. It’s assembled, daily, by named organisations, out of a small set of physically deliverable cargoes, loading at approved terminals, in defined date windows, under written eligibility rules.
Module One introduced the benchmarks as names. This part shows you the factory, then works outward from it: how the price of ships gets made in a dealer market, how the supply of ships runs on a public timetable the market keeps forgetting to read, how basis differentials work as the ladder’s live telemetry, and why the instruments for watching all of it fail at the moments they matter.
Let’s get into it. Again.
Benchmarks exist because hundreds of grades need a common reference, and a reference is only trustworthy if it is anchored in barrels that actually change hands. So every real benchmark is physical somewhere: a place, specific terminals, rules about what counts.
The price reporting agencies, Platts and Argus above all, run structured assessment processes. The best known is the Platts Market on Close window. Named counterparties post bids, offers and trades for cargoes that meet the eligibility rules: the right grades, sizes, date ranges, delivery basis and terminal provenance.
A cargo that fails eligibility is not priced. Eligibility is the toll gate at the top of the ladder.
Dated Brent shows what benchmark maintenance involves. The North Sea stream loads about 23,000 bbls a day, under 1/4 of its rate a decade ago, and Reuters reported on 30 June that not one Brent cargo was initially scheduled to load in August 2026, the first empty month in records going back to 2007.
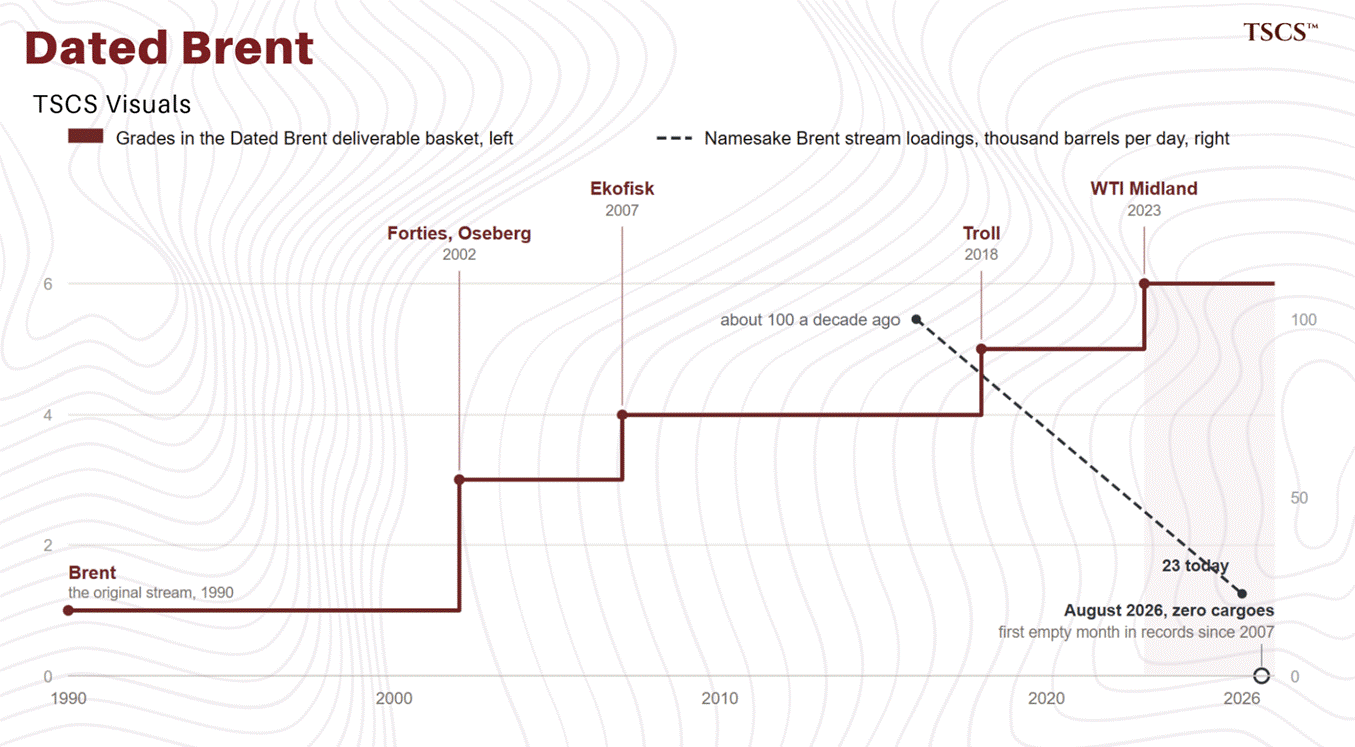
How does a Texas cargo become a North Sea price? Platts takes Midland cargoes offered delivered into Rotterdam. The cargoes are 700,000 barrels, quality-fenced, supplied only from approved US Gulf terminals fed by named Permian pipelines (no Cushing molecules allowed).
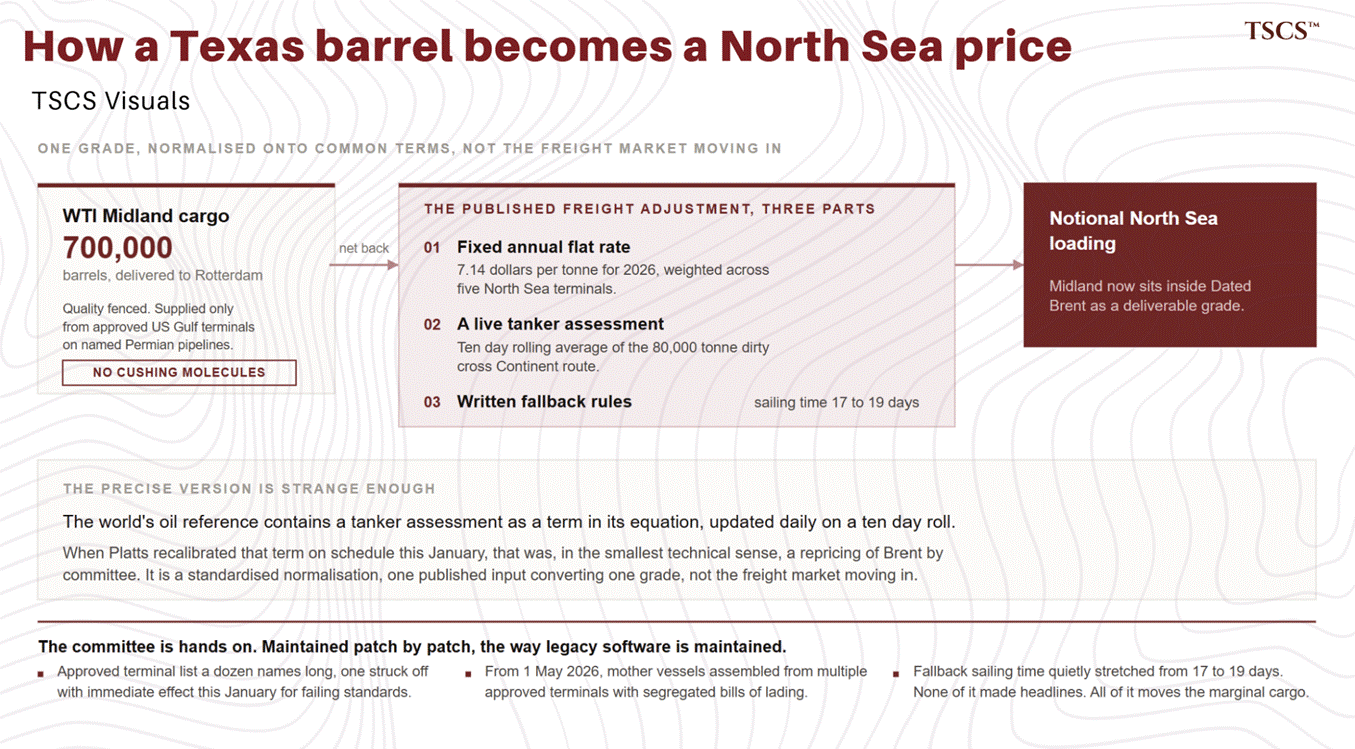
Platts then nets them back to a notional North Sea loading using a published freight adjustment.
The adjustment has three parts. A fixed annual flat rate: $7.14 a tonne for 2026, weighted across 5 North Sea terminals. A 10-day rolling average of a live tanker assessment, the 80,000-tonne dirty cross-Continent route.
When I was drafting this section earlier, I said the freight market is arithmetic inside the Brent price. A methodology reader would rightly wince. It’s a standardised freight normalisation: one published input converting one grade onto common terms.
The world’s oil reference contains a tanker assessment as a term in its equation, updated daily on a 10-day roll. When Platts recalibrated the term on schedule this January, that was, in the smallest technical sense, a repricing of Brent by committee.
The committee is hands-on. It runs an approved-terminal list a dozen names long and removed one terminal with immediate effect this January for failing the standards.
From 1 May 2026 it updated the loading rules again, allowing mother vessels assembled from multiple approved terminals with segregated bills of lading. It also stretched the fallback sailing-time assumption from 17 days to 19.
None of this made headlines. All of it is the price being maintained patch by patch.
Then March 2026, when the war reached the other great price factory mid-shift. Dubai, Asia’s sour anchor, runs on partials (small standardised clips traded in the window that accumulate toward a physical delivery obligation) against which a converging seller may deliver alternative approved grades.
On 2 March, with the strait effectively shut, Platts suspended nominations of any grade requiring Hormuz transit. The deliverable pool collapsed from five grades to two.
Look at which two survived. Oman loads at Mina al Fahal, outside the strait. Murban loads at Fujairah, outside the strait, at the far end of the Habshan bypass line from Part 2. Benchmark eligibility followed the bypass map.
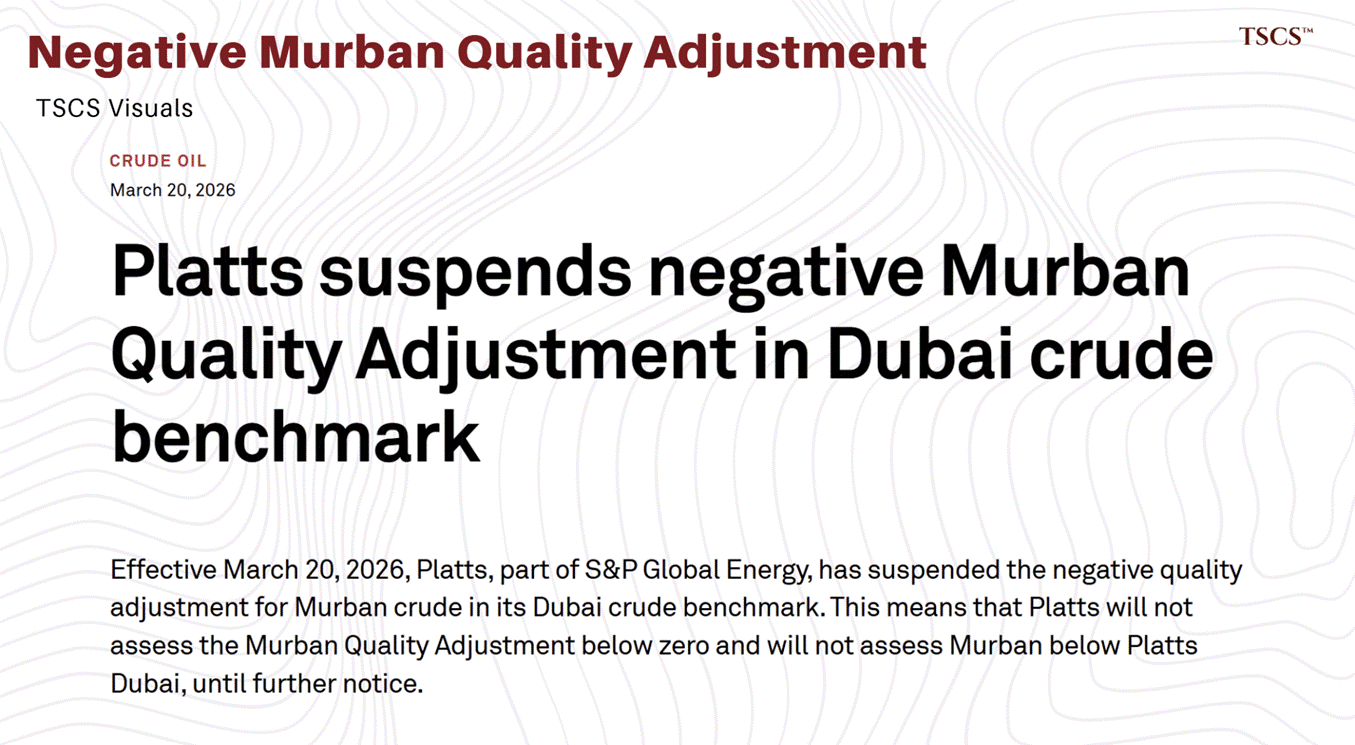
On 20 March Platts also suspended the negative Murban quality adjustment, flooring Murban at Dubai. That reversed a rule it had rewritten in the opposite direction eleven weeks earlier. As of mid-July both crisis changes still stand “until further notice.” The consultation on what Dubai should even be deliverable against is still open.
The market effects were big. Dubai printed a record $157.66 on 16 March, more than $60 over swaps. The March window did all-time record volume, 1,920 partials and 82 convergence cargoes, 44 Oman and 38 Murban, itself a monthly record.
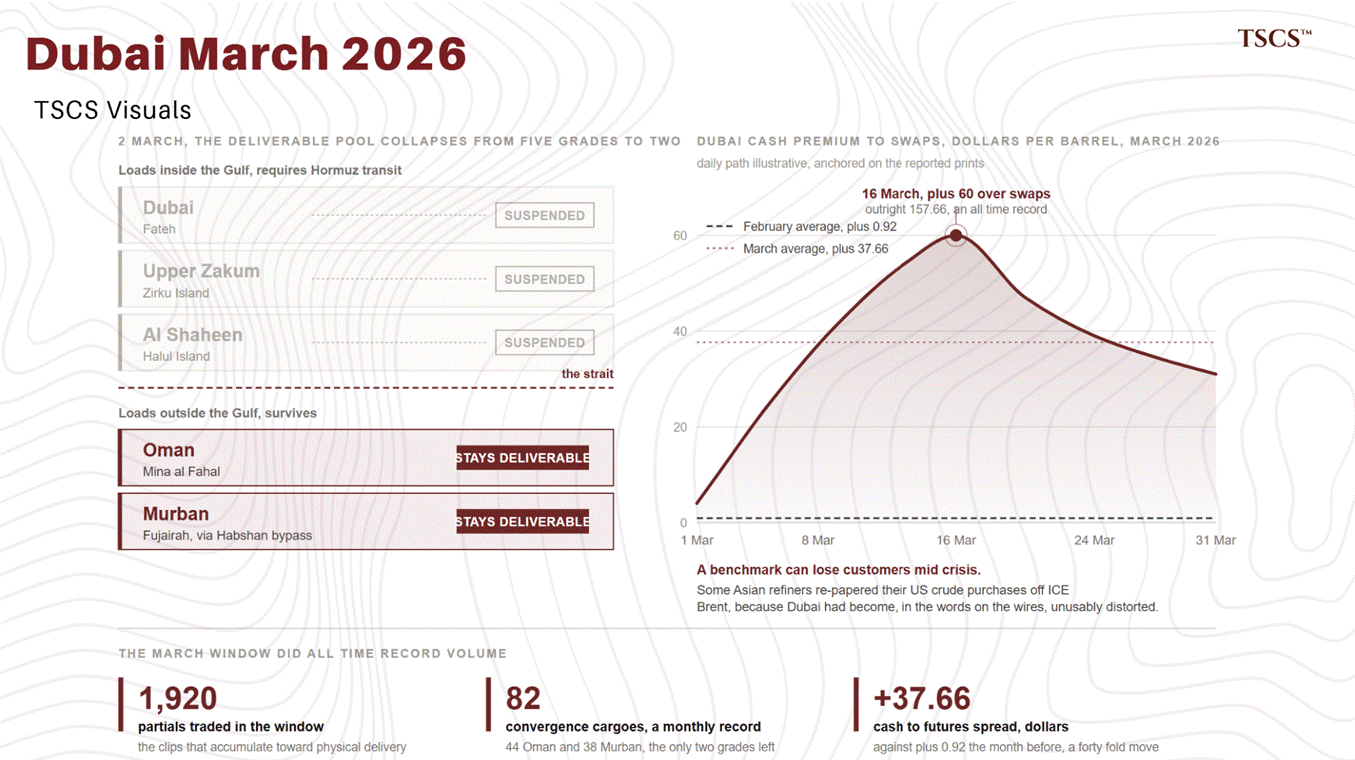
The cash-to-futures spread averaged plus $37.66 against $0.92 the month before. And some Asian refiners responded by re-papering their US crude purchases off ICE Brent instead, because Dubai had become unusably distorted.
A benchmark can lose customers mid-crisis.
WTI completes the domestic picture and connects to Part 2’s coda: the landlocked Cushing contract remains the futures anchor. But the pricing weight of the American barrel has been moving seaward with the export trade, toward the Midland and Houston assessments at the dock end of the ladder.
That is why a near-empty Cushing in June 2026 strained basis rather than breaking anything.
The marginal buyer increasingly stands at the water, not in Oklahoma.
One more layer sits on top of the manufactured references: administered pricing. The national oil companies sell at official selling prices, formula differentials to a chosen reference, set monthly by region.
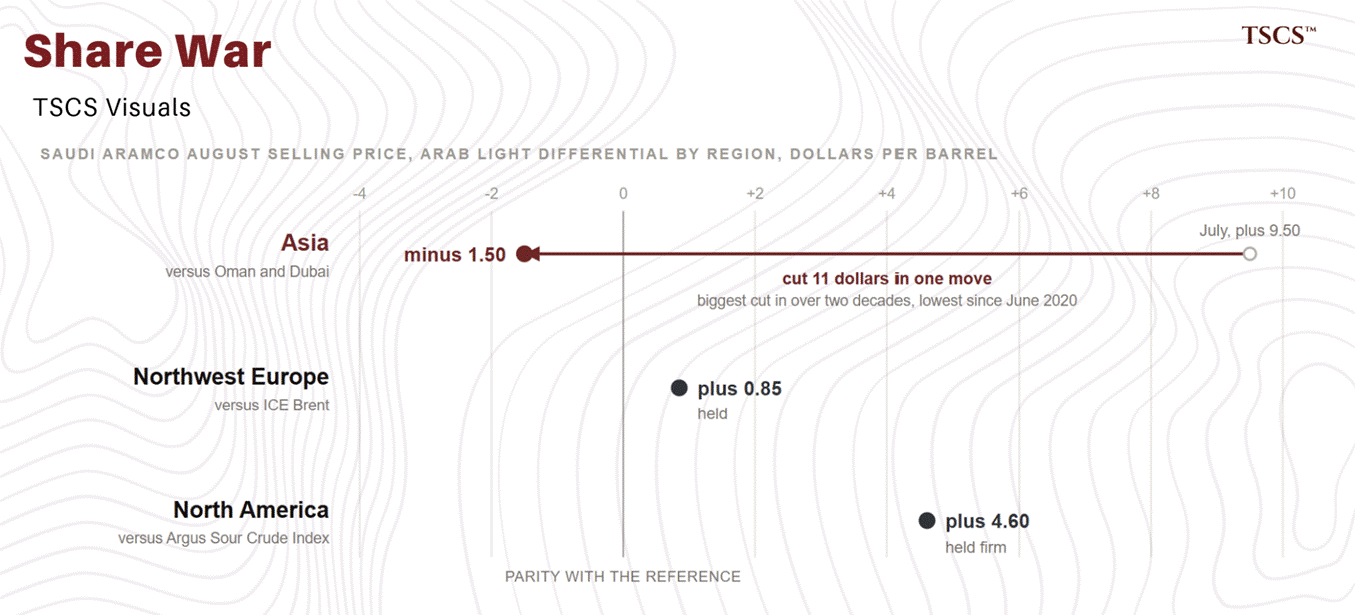
Aramco prices Asia off the Platts Dubai and GME Oman average, the United States off the Argus Sour Crude Index, and Europe off ICE Brent, Northwest, Mediterranean and Sidi Kerir alike. The differentials land around the 5th of each month for the following month’s loadings.
For August, Aramco cut Arab Light into Asia by $11 in one move, to a $1.50 discount against Oman-Dubai. Biggest cut in over two decades. Northwest Europe held at +$0.85, North America at +$4.60. One producer, one press release, and the whole market read it the same way: a share war, declared by differential.
How much of the world prices off all this? A great deal, and nobody will show you the denominator. The attributed industry estimates run from around 60% of traded crude for Dated Brent to roughly 75% for the broader complex, depending on who is selling you the figure and what they are counting.
The defensible sentence: the Brent complex, with Dated Brent as its physical anchor, is the dominant reference for most internationally traded crude.
PRA methodology gets contested periodically. Which leaves the practical instruction this section exists for: methodology risk is market risk.
A grade admitted to a benchmark gains a structural bid, a terminal struck off strands the barrels behind it, a rewritten freight adjustment moves the marginal cargo, and in March 2026 two subscriber notes from a price reporting agency arguably moved more money than any OPEC statement of the past year.
Almost nobody reads methodology notices. Read them.
And if you want to know what all this committee machinery is worth, look at a market that does not have it, because I traded in one for years.
Chrome ore has no futures market worth the name, no assessment window, no eligibility rules, and its price formation is what remains when you remove everything this section described: raw structure.
China buys the overwhelming share of the seaborne market. South Africa mines it. The price is effectively set by a handful of Chinese mills and traders whose monthly tenders function as the benchmark, because nothing else does.
Port stockpiles are lethal. The buy-side is concentrated and patient. It can simply stop, let the cargoes of producers who must ship to make payroll stack up at the ports, and restock at the bottom.
The structural player everyone watched was Glencore: the world’s largest ferrochrome producer through its Merafe venture, for years also seated on the producer side of the old European quarterly benchmark while its marketing arm traded the flow. The trading floors resented it accordingly.
Whatever one believes about intent, a portfolio player placing volume through a downturn survives prices that kill unhedged juniors. The juniors die the same either way.
A market without a price factory is a market where price power goes unregulated. This should be obvious.
Freight is a dealer market, and that changes how you should read every freight number in this module. There is no tanker exchange. There are owners, charterers, and the shipbroking houses between them. Individual charters for individual voyages (fixtures) get negotiated privately through the brokers and reported afterward.
The Baltic Exchange turns this into public numbers by polling panels of brokers for what a standard ship would earn today on standard routes. TD3C, the Gulf-to-China VLCC run, is the one quoted throughout this module. So a freight index is an expert assessment of a dealer market, closer in nature to Dated Brent than to a stock price, and in thin or panicked moments it inherits every limitation of the humans polled.
The war made that literal: with fixtures through the Gulf collapsing, the Baltic issued guidance on 4 March for assessing routes in the absence of actual business, and by 20 April was consulting on an emergency methodology for its Middle East Gulf indices.
On top of the physical market sits its paper shadow, forward freight agreements and cleared derivatives settling on the Baltic assessments: a record 1.1 million tanker lots traded in 2025, a thousand tonnes a lot, call it a billion tonnes of paper freight, against a broader FFA market quoted near $100 billion. Liquid enough to hedge and to speculate. Still a rounding error beside the oil futures complex.
Part 3 promised the four readings of the spot-versus-period gap, so here they are, against June: spot near $470,000 a day while twelve-month charters around $110,000.
Reading one, expected mean reversion, the market pricing an event as an event, our base case.
Reading two, charterer discipline, budget-bound counterparties refusing to capitalise a panic into a year of committed cost, whatever they privately expect.
Reading three, owner behaviour, the mirror image, owners refusing to sell cheaply the exact convexity the crisis made valuable, keeping ships spot on purpose.
Reading four, an uncertainty band too wide to price, both sides stepping back. The public record points different directions in different regimes: traders shunning long charters in one stretch of policy chaos, houses reaching for cover in another.
What separates the readings afterward is behaviour: period fixture volumes, the shape of the FFA curve, who blinks.
So the working rule: the moment to take a disruption thesis seriously isn’t when spot spikes. It is when the one-year money agrees.
Jeff McGee publishes the weekly tanker version of this discipline, and if you are going to follow one freight tape that is not a headline, follow that one.
And the assessment problem went from methodological to litigious. In April, Mercuria filed against the Baltic Exchange in London’s High Court, alleging hundreds of millions of dollars of losses on contracts that settled against an index printing above $600,000 a day for a route on which, it says, almost nothing was being fixed.
The Baltic denies the claim and says it met its obligations. Take no view on the merits and take the exhibit: whether a published number is a price or an estimate of a price is now being argued in front of a judge, with money attached. Several management teams spent the spring describing the benchmark prints of March to June as theoretical.
Ship supply is the slowest variable in this module and the most public, which makes the market’s serial failure to price it one of the sector’s standing puzzles.
The mechanism fits in a sentence: the cure for high rates is high rates. Strong freight triggers ordering. Yards take 2-3 years to deliver. Deliveries land in clusters, and rates die under the tonnage the good years paid for.
Every generation of shipowners knows this, and every generation does it anyway, because the ordering decision is individually rational and collectively suicidal (the commons problem).
The current position, dated: the thin-orderbook era that anchored every tanker bull case of 2023 to 2025 is over. The crude orderbook stood at 18% of the fleet in February 2026 and 22% by April, after the strongest crude-contracting quarter on record. The overall book hit its highest share since 2011.
Deliveries in the first five months ran at double the prior year’s pace. 49 million deadweight tonnes are scheduled for this year and about the same again for 2027, and reporting as early as December 2025 already expected the schedule, the heaviest since 2009, to cap rates in the back half of this year.
The LR2 product class carries nearly 39% of its fleet on order while the small MR1s carry under 5, so “the orderbook” is several different futures.
Against the wave stand three defences, all real, all timing rather than salvation.
The fleet is the oldest in decades: VLCCs average about 13.7 years, Aframaxes 15.9, and the over-twenty share of the crude fleet is headed from 1/5 to 1/3 by 2030. Yard slots are effectively sold out to 2028 and 2029, and 57% of this year’s orders deliver after 2028.
And demolition, the cycle’s usual safety valve, has jammed in the strangest way on record: not one tanker was demolished in May 2026, despite firm scrap prices, because sanctioned trades pay geriatric ships too well to die. Old is not gone.
One more supply valve hides entirely outside the orderbook. Ships full of unsold cargo are ships out of the market. Some 19 million barrels of Urals reportedly sat afloat awaiting buyers in January. Those clear, and a fleet materialises out of anchorages. Voyages shorten on any normalisation, and the same barrels need fewer ships. Congestion eases, queues dissolve, tonnage reappears. This is how the window can close early. The second week of July was already demonstrating it: Urals-to-India freight reportedly falling on tanker availability while the strait was still making headlines.
Through the closure the count of VLCCs tied up barely moved, 491 to 480 on one owner’s build, while underneath it roughly 130 vessels left productive service and 117 became unproductive in new ways: ships waiting around the Red Sea, ships laden and trapped inside the Gulf, and ships parked east of Suez on legacy charters held by oil companies as options on the reopening rather than as working tonnage. Strip out the dark fleet, which another owner puts at about 40% of the trapped block, and the compliant trapped fleet numbers around 83. A tenth of the world’s largest crude carriers standing still tightens the market exactly as scarcity does, right up to the day it moves.
The valuation discipline follows from all of it: NAV, age profile, orderbook exposure by class. The income statement is a snapshot of the cycle.
Part 2 built the ladder and Part 3 named the differential as the price of space.
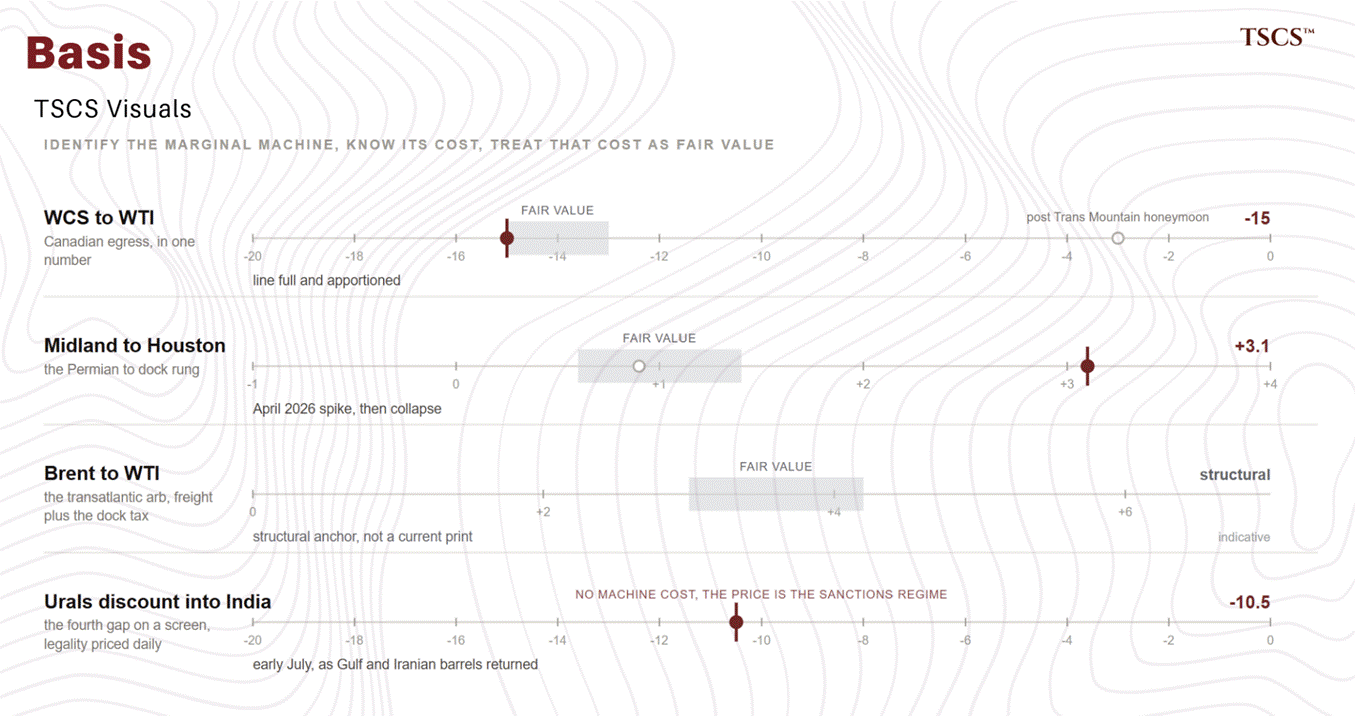
Reading the gauges is a three-step discipline that never changes: identify the marginal machine connecting two prices, know its cost, treat that cost as fair value.
A differential sitting at fair value says the rung is in use and adequate. Blowing through it says the rung has filled and barrels are bidding for the next machine. Collapsing below says a new rung has opened.
Applied to the gauges we’ve discussed: WCS-WTI is Canadian egress. Midland-Houston is the Permian-to-dock rung, its April 2026 spike above $3 and collapse a complete capacity event in miniature. Brent-WTI is the transatlantic arb, freight plus the dock tax. And the Urals discount is the fourth gap on a screen, legality priced daily.
It was reportedly out beyond $10 into India in early July, as Gulf and Iranian barrels returned and buyers rediscovered choice.
Keep the fair-value anchors in your head and the differential page becomes a wire service: a basis blowout is the market publishing which rung just filled, usually before the journalists do.
Basis is also the only kind of trade I can claim to have made insane money on in a single week, so here’s what it looks like in the flesh.
Years ago, in South Africa, a copper producer began selling parcels meaningfully below spot. There’s always a reason: distress cash needs, a logistics lock, a stale pricing period, a spec discount. I never fully established which. I was too busy loading.
The house bought everything on offer and put it straight onto ships, and the week’s P&L was our biggest topline that year.
You should understand what got paid, though, because it was not cleverness.
The producer was selling at his deliverable price, the bottom rung of his own ladder: the price of copper for someone with his logistics. The buyer owned the rungs above: the ships, the berth access, the offtake relationships.
The arbitrage was the ladder law paying its owner, and every screaming basis dislocation you will ever see on a screen is the same event at scale. The only thing was speed and resources. If you can obtain those simultaneously, you’ll print.
Every claim in this module rests on somebody’s data, and the sensors fail procyclically, so the last section of this part is about them.
The official layer: the EIA’s weeklies are the most timely and transparent statistics in the complex; the IEA and OPEC monthlies arrive slower and carry their institutional tilts, consumer and producer respectively; JODI is self-reported and gapped.
Reconciling them all produces the market’s permanent background hum of missing barrels.
Tim Dallinger's Energy Report does the weekly version of this reconciliation in charts, which is the fastest way to build the habit.
The physical layer: AIS transponder data, satellite imagery, and the cargo-analytics firms, Kpler and Vortexa, that fuse them into flow estimates, plus fixture counts, port line-ups and tank-top monitoring from the broker world.
This layer transformed the market’s visibility over the past decade, and it is the layer that sanctioned trade is professionally dedicated to blinding.
Then 2026 taught the organising lesson. At the exact moment Hormuz became the only question that mattered, the EIA stated that AIS signals for Hormuz transits had become especially unreliable from late February, and that it was supplementing tracker data with port-pair analysis.
The same crisis pushed the agency to launch a new Global Energy Security Data report, chokepoint flows and strategic stocks: a statistical product born of a war. The pattern generalises: the data layer is weakest precisely when the market most needs it, because crises are when participants hide, when transponders lie, and when the assessments underneath the indices are polling frightened humans.
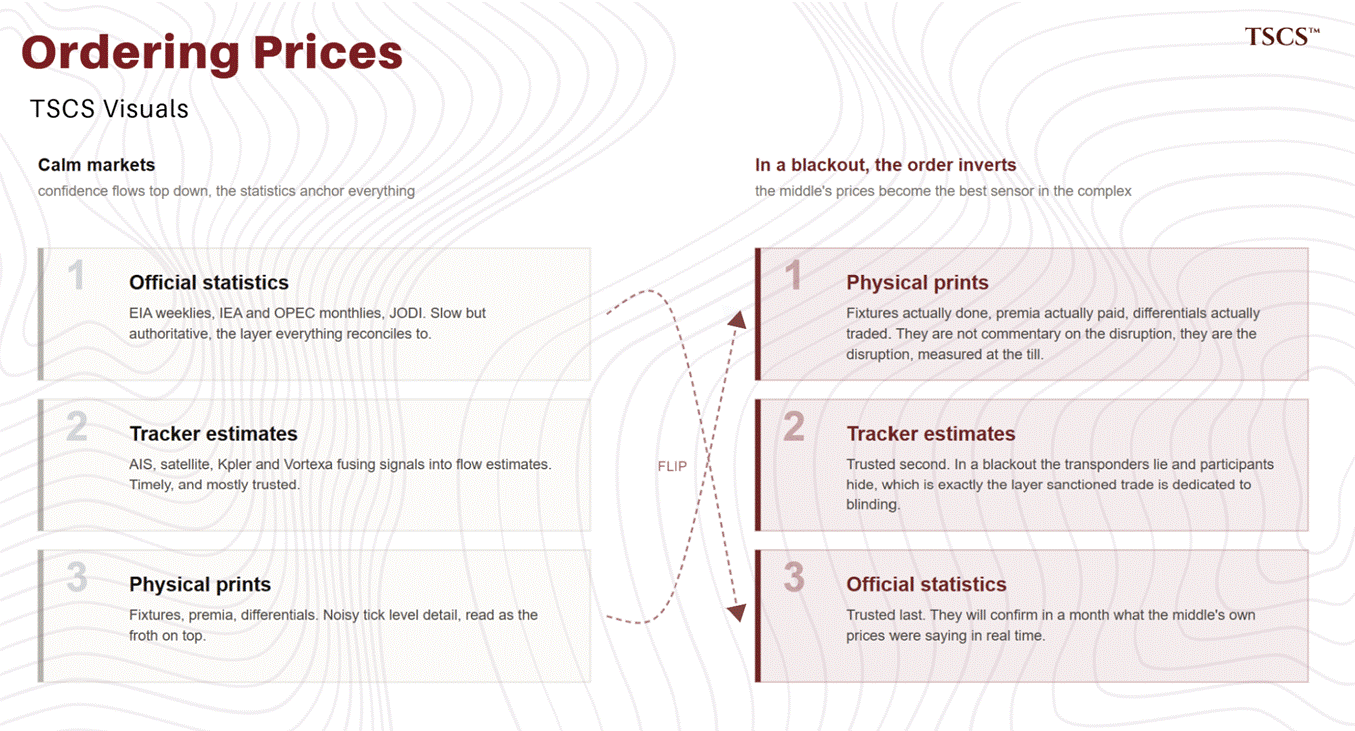
So the hierarchy of signal in a blackout inverts.
Trust the physical prints first: fixtures actually done, premia actually paid, differentials actually traded. The tracker estimates second. The official statistics last; they will confirm in a month what the middle’s own prices were saying in real time. The middle’s prices are themselves the best sensor. Insurance quotes, fixtures and basis are not commentary on the disruption. They are the disruption, measured at the till.
If you want the same discipline applied weekly to inventories and balances rather than to freight, my friend HFI Research has been doing it for years and has the scars to prove the method.
Everything we’ve built here, the ladder, the three gaps, the price factories, meets here. Sanctions are the fourth gap run at industrial scale. This part comes with a warning: it’s the fastest-decaying part of this.
The war redrew the world’s oil flows in real time. Three structural changes are worth engraving.
The first: the Western Hemisphere became Asia’s supply. The main line, Gulf to Asia, is running at a fraction of itself. Gulf crude and condensate exports recovered to 10.07 million barrels a day in June, still around 40% lower than last year.
Into the gap stepped the Atlantic. US crude exports hit a record 5.6 million barrels a day in May, split almost evenly between Asia at 2.45 and Europe at 2.40. Brazil ran 71% above its 2021 pace, with Petrobras sending 62% of its first-quarter slate to China. Guyana moved about 910 thousand barrels a day, up nearly 7x. This industry is nimble, new supply arrived in weeks.
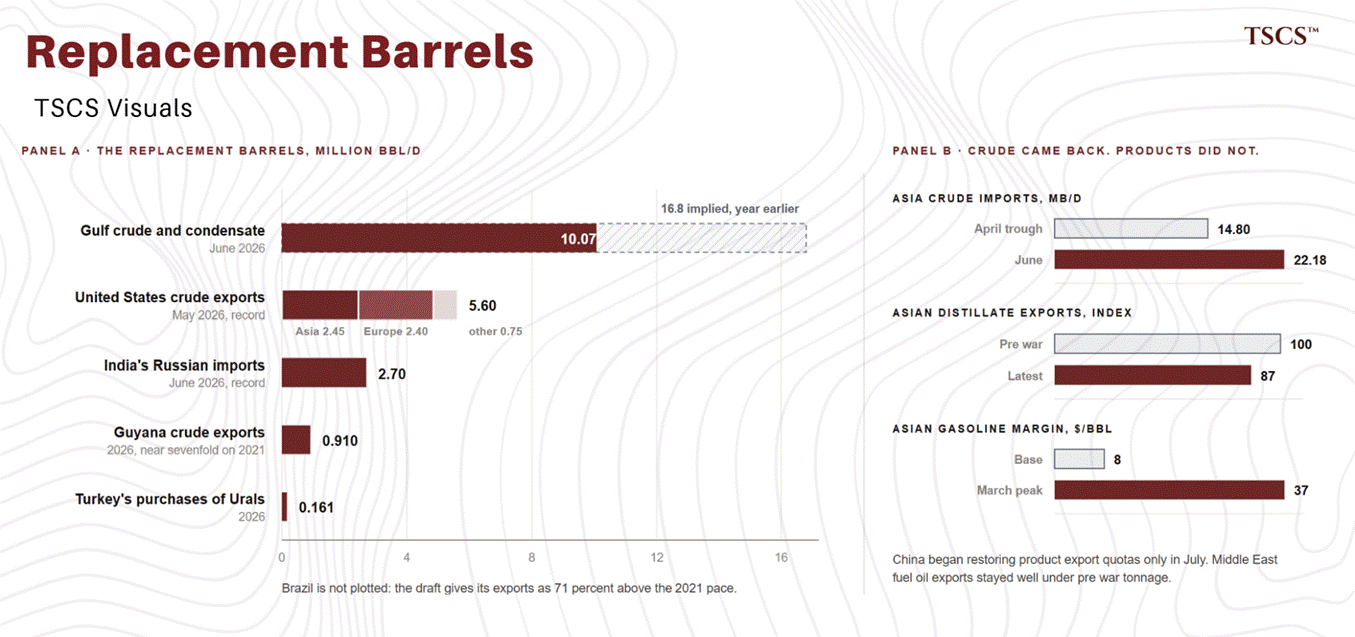
The second: Russia is now India’s shock absorber. India’s Russian imports hit a record 2.70 million bbl/d in June, more than half its total intake, while Turkey’s Urals purchases shrank to 161,000 and China absorbed the overflow.
Whenever Gulf availability turns uncertain, the fastest swing barrel into South Asia is sanctioned.
The third change almost nobody on the crude side noticed: products stayed tighter than crude. Asia’s crude imports rebounded from their April trough of 14.8 million bbl/d to 22.18 by June. Asian distillate exports were still 13% below pre-war levels. Middle East fuel oil ran well under pre-war tonnage, and China only began restoring product-export quotas in July. Asian gasoline margins went from about $8 a bbl to about $37 at the peak of the panic, enough to pull European gasoline cargoes eastward, the Atlantic product flow briefly running in reverse.
One more detail with a lesson in it. By late June, West African crude that had lost its eastern outlet piled into Europe until Europe became the clearing point of the Atlantic basin.
West African differentials blew out accordingly. That is the ladder law operating at the scale of hemispheres: the preferred route fills or fails.
For the weekly version of this map, Rory Johnston has been tracking Hormuz flows and Gulf loadings chart by chart since the closure, and his data work is the standard we check ours against.
The baseline geography, from the EIA’s chokepoint work. Malacca: 23.2 million barrels a day, the largest by volume. Hormuz: 20.9, the largest by irreplaceability. Suez plus the SUMED pipeline: 4.9. Bab el-Mandeb: 4.2, both roughly halved from 2023 by the Red Sea campaign. The Danish Straits: 4.9, swollen by the rewired Russian trade. The Turkish Straits: 3.7, where Kazakhstan is the largest single exporter. Panama: 2.3. And the Cape of Good Hope, not a chokepoint but the anti-chokepoint, the world’s detour, at 9.1 and rising.
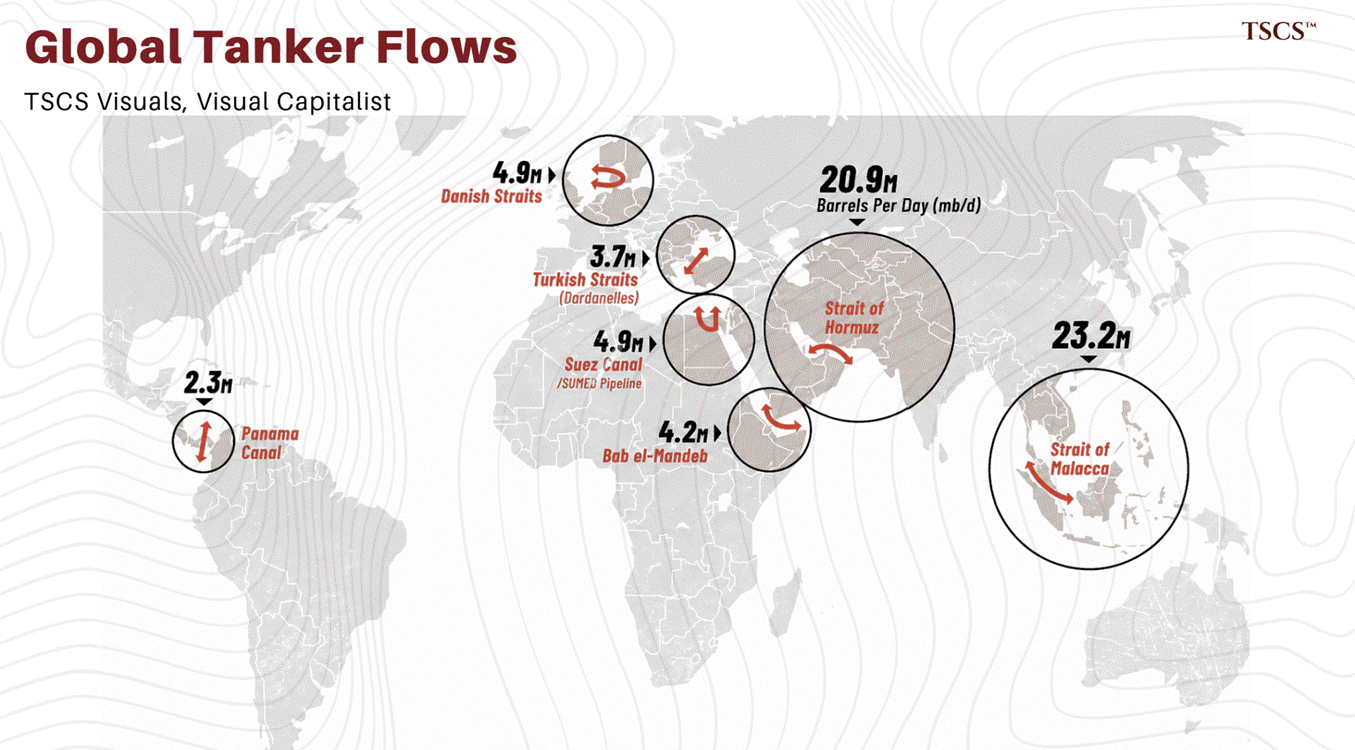
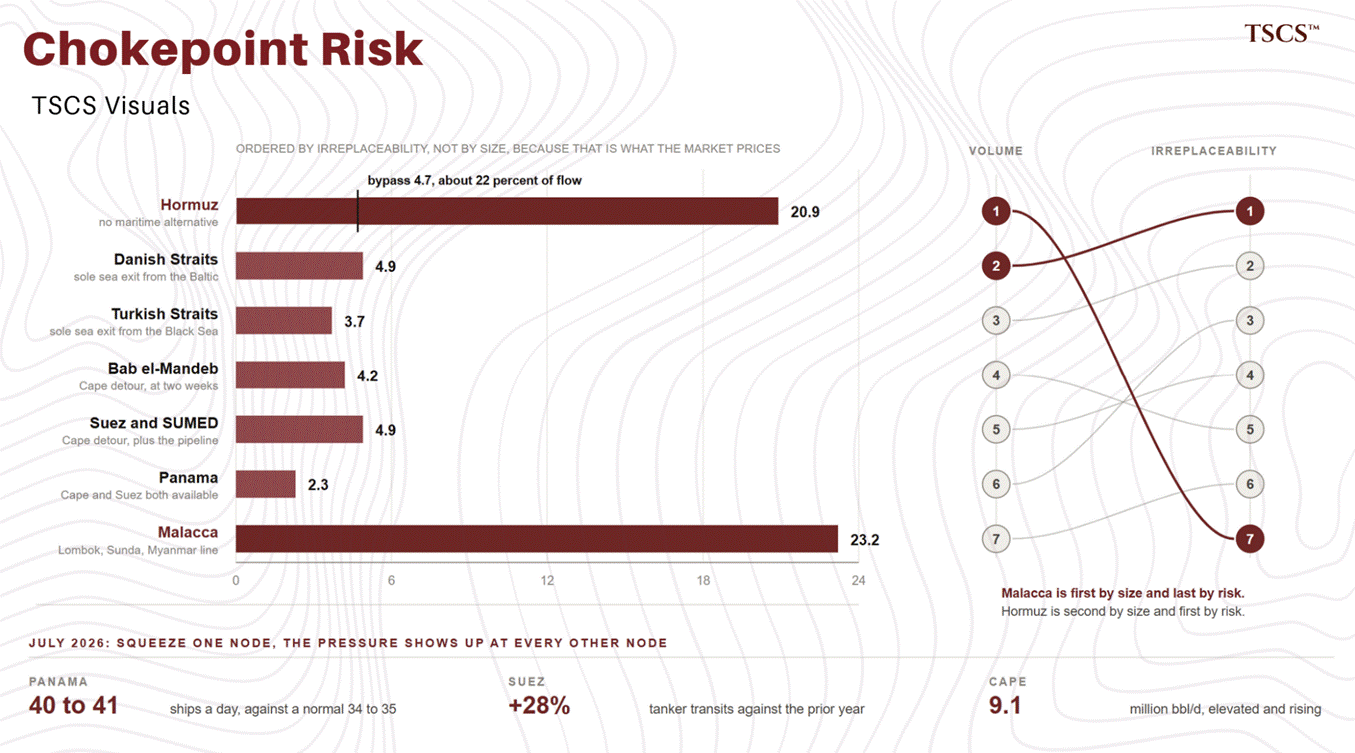
We organise them by substitutability rather than size, because that’s what the market prices.
Malacca is enormous and has workarounds: the Indonesian straits, the Myanmar pipeline. Its closure wouldn’t be existential. Hormuz has about 4.7m bbl/d of pipeline bypass against a 20.9m flow and no maritime alternative at all. That asymmetry is why one strait carries the world’s risk premium and the other carries China’s nightmares.
The network also breathes as one system. With Hormuz throttled, Panama ran at 40 to 41 ships a day against a normal 34 to 35 as cargoes rerouted. Suez tanker transits ran 28% above the prior year. The Cape stayed elevated. Squeeze one node and the pressure shows up at every other node on the map, usually within the month.
Chokepoints have been stress-tested before. Let’s look at 3 cases.
The Tanker War, 1984 to 1988: you can shoot at the world’s oil for 4 years and barely dent it, so long as the water stays open. Iraq logged 283 attacks on shipping and Iran 168 by the end of 1987. 546 merchant vessels were damaged and around 430 civilian seafarers killed. And at its most intense, the war disrupted no more than about 2% of Gulf transits. Premium spiked from under 0.1% of hull value to over 5%. The market’s capacity to adapt around violence is enormous.
Suez taught the second lesson: when a chokepoint closes for years, it redesigns ship routes. The 1956 closure lasted 5 months and stretched the Ras Tanura to New York route from 8,288 miles to 11,755 around the Cape. The 1967 closure lasted 8 years. Eight years of Cape economics is what summoned the supertanker into existence, 300,000-tonners built to restore scale on the longer voyage, and the SUMED pipeline was built as the canal’s insurance policy. The VLCC is a monument to a closed canal. Chokepoint outages, if they last, permanently rewrite fleet architecture. Watch Iran.
And the Ever Given, 2021, taught the third: you don’t need a war. One ship, wedged for 6 days, queued over 400 vessels including more than 20 tankers, nearly doubled product-tanker rates, and held up trade valued around $9 billion a day.
The fourth lesson is that the doctrine transfers to land, and I learned it by paying for it.
Most of South Africa’s chrome leaves through Mozambique, because Transnet’s railways decayed until the road east became the cheaper rung. So when Mozambique’s October 2024 election was disputed and the country fell into its worst political crisis since independence, a metallurgical supply chain on another continent stopped moving.
The Lebombo border crossing shut on 7 November. Grindrod suspended its port and terminal operations at Maputo and Matola the same day. Zambia stopped importing fuel through Beira. Protesters vandalised the Nacala railway. Syrah declared force majeure at its Balama graphite mine on 12 December, South32 pulled guidance at its aluminium smelter, and mobs attacked at least six mining sites, most of them foreign-owned, between October and the year’s end. When the Constitutional Council confirmed the result on 23 December, the protests spread out of Maputo and across the provinces.
Our own operation declared force majeure in the middle of it.
The clearest memory I have of that awful period is a single truck. I needed a load of critical minerals to come off a site in a district that was by then under attack, and the only sane move was to get it to the coast immediately, so it went out fortified: the container plated with steel against robbery, a military escort alongside.
Neither helped.
A crowd stopped the convoy, the escort was overpowered with machetes, the police who arrived were made to stand aside, and the truck was burned on the road with petrol bombs.
Shit happens.
None of that was a war-risk premium, because none of it was insurable in the ordinary way. It’s the hard version of the point Part 2’s dust revolt made gently.
The bottom layer of the permission stack is consent, and when consent goes, steel plate and armed men are not substitutes for it.
Force majeure is the legal name for what comes next, and it’s a different animal.
In the first half of 2025, Hormuz carried 20.9 million bbl/d: crude and condensate 14.7, products 6.1, a fifth of world liquids consumption and a quarter of maritime traded oil, plus 11.4 billion cubic feet a day of LNG, over a fifth of the global trade. 89% of the crude went to Asia. China, India, Japan and Korea together took 74%.
The bypass: the Saudi East-West line and the Abu Dhabi line to Fujairah, together about 4.7 million bbl/d, with the IEA’s tested-availability estimate at 3.5 to 5.5, a further 1.5 million UAE line planned by 2027, and Iran’s Jask route effectively around 0.3.
Most of the world’s spare production capacity lives inside the strait, so the shock and the cushion are co-located.
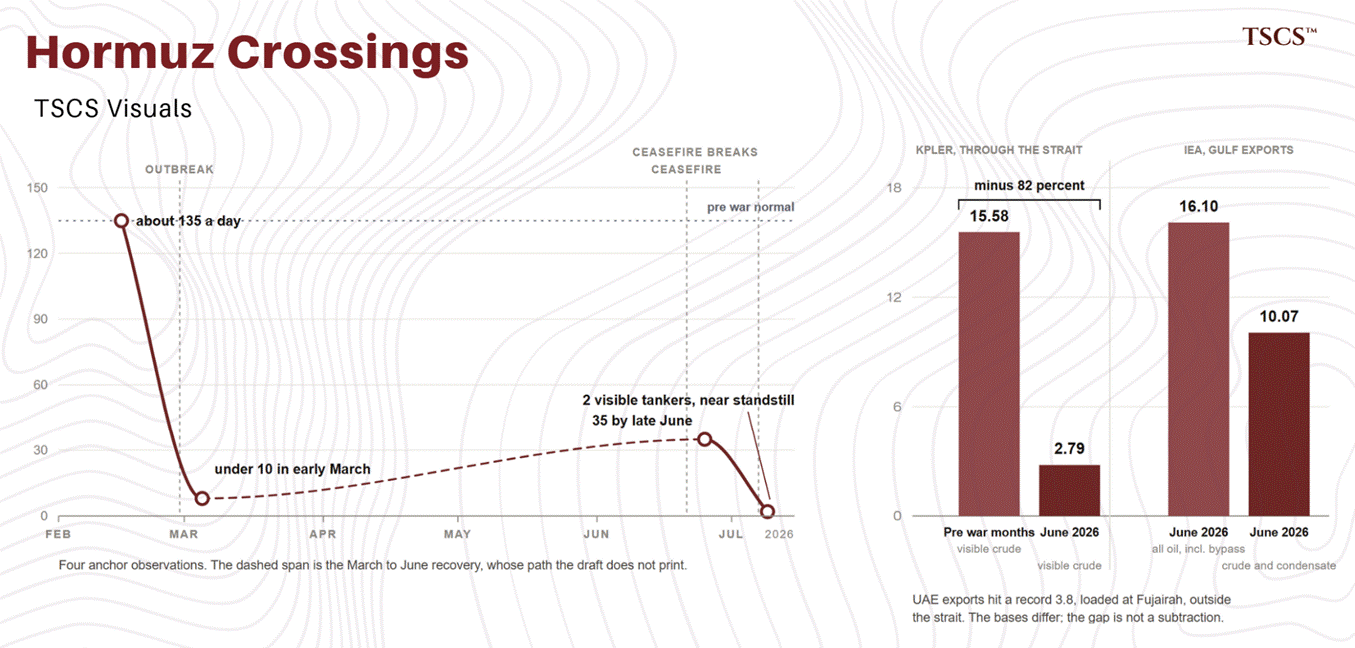
Then the war ran the experiment. Transits collapsed from about 135 tanker passages a day in February to under 10 in early March. They recovered only to 35 by late June. The July re-escalation cut it again.
But in June, the Gulf exported around 10.07 million barrels a day of crude and condensate. Kpler could see fewer than 2.79 million actually exiting through the strait, against 15.58 in the pre-war months. The difference travelled through the pipes. UAE exports hit a record 3.8 million barrels a day, loaded at Fujairah on the far side of the bypass line, and the IEA put total June Gulf oil exports, bypass included, at 16.1 million.
When people ask what the Hormuz premium is, the technically correct answer is: the cost of not owning a pipeline to Fujairah.
Of the pipeline capacity working around the strait this spring, 3.5 million bbls a day was Saudi crude going west to Yanbu, which is described below. Owner-side builds put the total bypass near 5.5 million bbls/d against the 4.7 million in the official chokepoint data: the larger figure counts the reactivated northern route from Kirkuk to Ceyhan, which leaves the region through the Mediterranean and never touches either strait. Strip that out and the picture sharpens.
And this week the bypass met its own chokepoint, which is why the chokepoint table should never be read as a list of independent rows.
But bypasses aren’t fool proof. Yanbu sits on the Red Sea. A barrel that escapes Hormuz through that pipe has not escaped the region entirely. Reaching Asia from Yanbu means sailing south through Bab el-Mandeb.
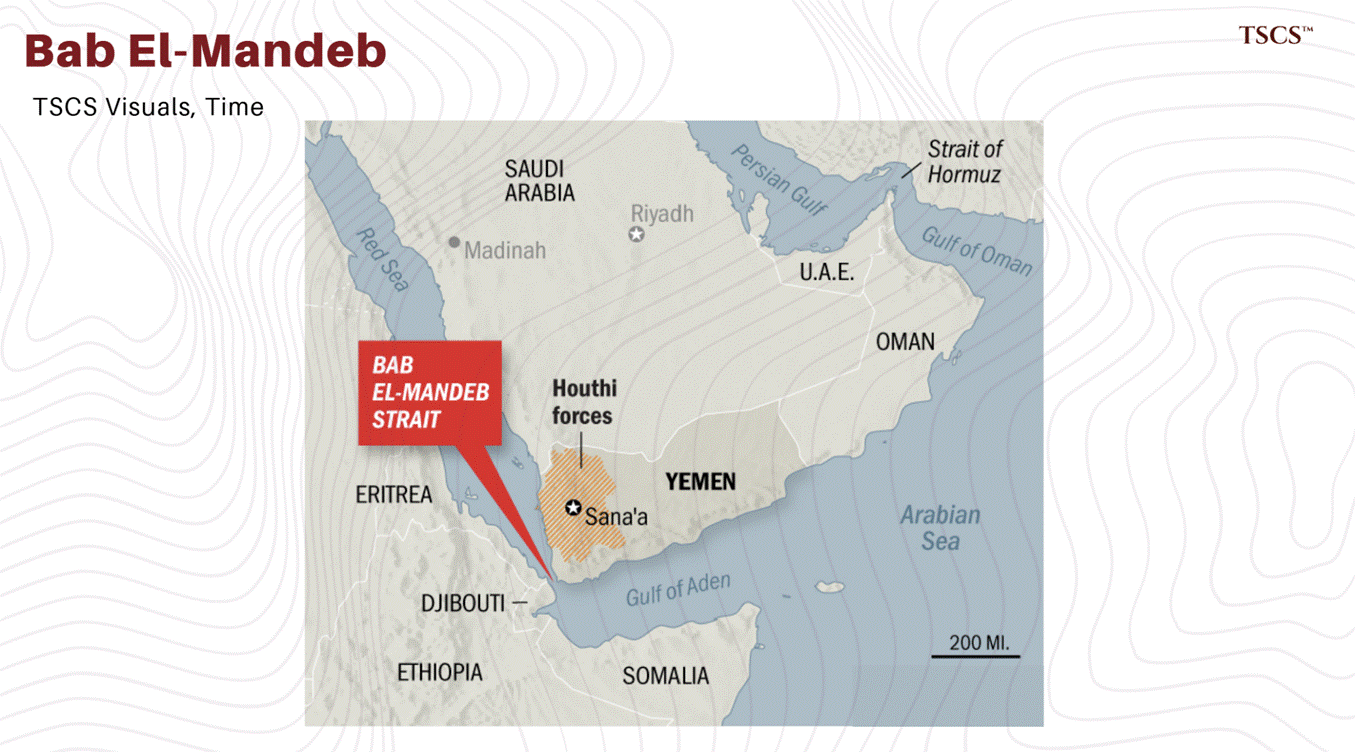
North through Suez puts you in the Mediterranean, which serves Europe and the Atlantic; getting to Asia from there means back out past Gibraltar and round the Cape. Only the UAE line, which discharges at Fujairah into the Gulf of Oman, is a true escape.
On Monday 20 July the Houthis declared a maritime embargo on Saudi Arabia, retaliation, they said, for a Saudi strike on Sanaa’s airport, and emailed shipping companies that vessels loading or discharging at Saudi ports may be targeted.
The EU naval mission passed the wording on. The Joint Maritime Information Center reported missiles and drones moving into position near the strait. The market answered inside a day. The Rodos and the Xin Long Yang, carrying a combined 2.8 million barrels loaded at Yanbu and pointed at Asia, turned north for Suez.
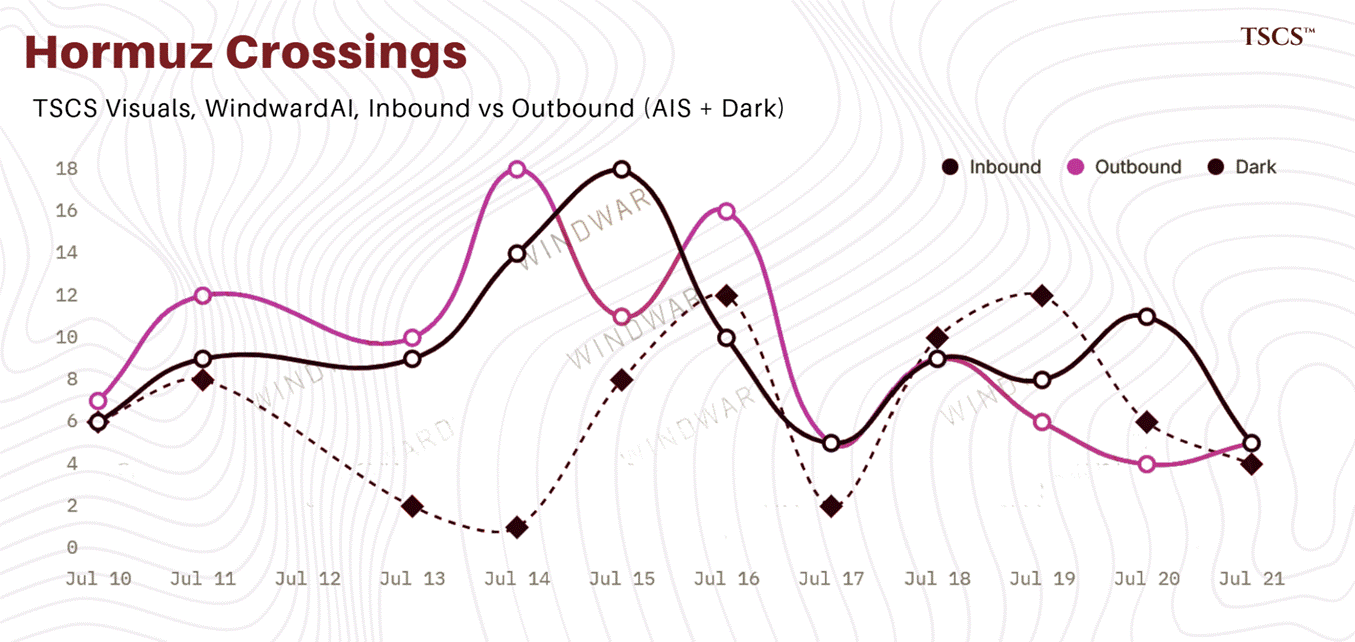
Windward counted four Saudi-cargo tankers reversing before the strait, 3.8 million barrels of crude, gasoil and naphtha. Kpler had twelve loaded Yanbu cargoes sitting in the Red Sea, two more going dark near the strait, Bab el-Mandeb traffic down 34% in a day to 29 vessels, and Hormuz crossings down 31% to nine. Saudi loadings fell by about a 1/3. Riyadh called the blockade claim disinformation. Let’s see.
The precedent is instructive. In July 2018, after Houthi missiles hit two Saudi VLCCs in the same water, the kingdom suspended all its Bab el-Mandeb shipments until it judged transit safe. A chokepoint does not have to be closed to stop working. It only has to become a place where underwriters won’t quote.
Flat price reacted instantly, as it always does. Brent went through triple digits within days of the February outbreak, because futures are what you can sell at 2 a.m. on a headline.
Now look where the premium settled and persisted. Roughly a quarter of 1% of hull value pre-war; a March dispersion of about 1% for the safest ships, 2.5% for typical transits, 5% for anything with a US, UK or Israeli nexus; quotes toward 10% at the peak; and a post-ceasefire-buckle range of 3 to 8%, still standing as we write.
$3-8 million per voyage, on the ladder the intro already walked you up. Freight ran an M-shaped double peak: Worldscale 419 on the benchmark Gulf-to-China route on 2 March, about $424,000 a day, daily prints touching $600,000 in the wild mid-March sessions, then the June re-escalation print near $470,000 on the 23rd.
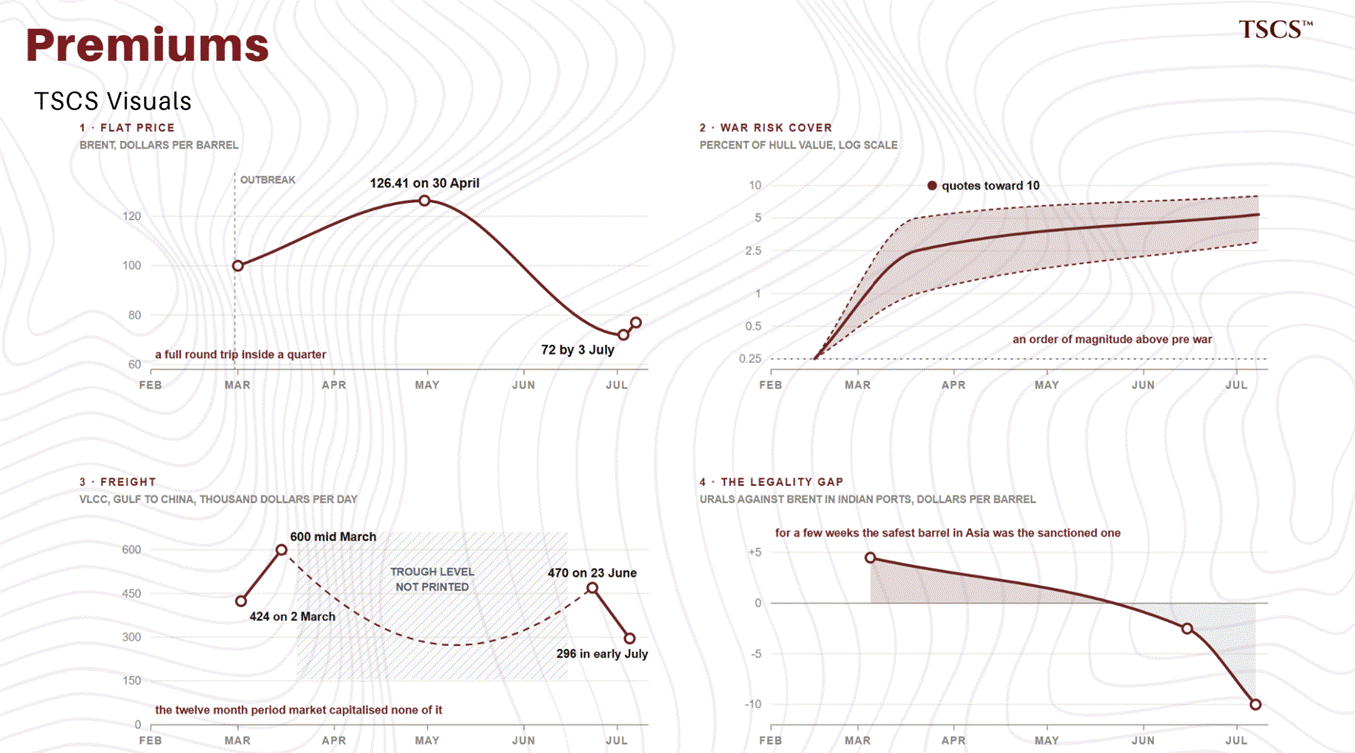
We have invoice-level evidence for where that premium lodged, because I went to Oman this spring. Six logistics invoices, one buyer, two lanes into Sohar, January 2026 against June. The war-risk line went from zero in January to 1,523 rials in June. Ocean freight on the same two lanes rose about 1.3 to 1.4 times. Freight is negotiated between shipper and line. War risk is administered by underwriters off an area listing. The cost of the war went almost entirely into the administered line, and the detail that generalises the finding is this: both of those lanes bypass Hormuz, because Sohar sits outside the strait.
The freight barely moved, since the physical route was never disrupted. The war-risk line spiked anyway, because war risk is priced by whether your destination sits inside the Joint War Committee’s listed area, not by the danger your particular voyage actually runs.
The container market ran the same split at larger scale, Shanghai to Jebel Ali quadrupling from under $2,000 a box to above $8,000, with the lines’ emergency Hormuz surcharges landing from 2 March. Owners and masters were waiting for somebody else to go first. Until a major line transits and publicly confirms safe passage, and until underwriters respond to that transit rather than to a signing ceremony, nobody moves.
Where the risk cannot be handed to an underwriter at all, it gets paid in men. When I moved platinum, gold or chrome by road in South Africa it meant buying a private army: ex-military escorts, armed around the clock, drones up, cameras and trackers on the vehicles, satellite coverage, the load livestreamed for the whole journey. None of that appears in a freight rate or an insurance quote. The premium is whatever it costs to make the cargo arrive.
The EU completed its first dynamic review in January. The mechanism averaged Urals over 22 weeks at $51.9, deducted the mandated 15%, and set the cap at 44.1 from 1 February, with the next notice due 15 July.
So on 15 July, the day before the new level was due to take effect, EU ambassadors froze it, holding the cap at 44.10 for one week while the bloc’s 21st sanctions package stayed stuck. The Commission’s own preference had been to postpone the review to January 2027 rather than let the formula run.
The blockage was not even about the cap. Greece was holding out against a proposed ban on EU countries supplying LNG to third countries, with Malta and Cyprus questioning the postponement, and the cap froze as collateral in somebody else’s argument. Those three are the EU’s maritime services powers, and their fleets are exactly the compliant tonnage a higher cap would put back to work carrying Russian barrels. The segmentation thesis below was arguing its own case inside a Council meeting. The freeze runs out today, 23 July, as we write. The UK sits aligned at 44.10.
Which brings us to the measurement problem: never print the shadow fleet as one number, because the sources are counting different things. S&P’s risk tiering puts the hard core at 940 ships. The broad census, via Clarksons and GMS, runs to about 1,800 vessels, roughly 1,500 of them oil or product tankers. Lloyd’s List characterises the dark fleet as about a tenth of all trading tankers. The coalition’s designation lists covered 653 unique oil tankers as of mid-June. And the carriage measures, KSE and CREA, show 7/10 of Russian crude still moving on shadow tonnage in the latest months.
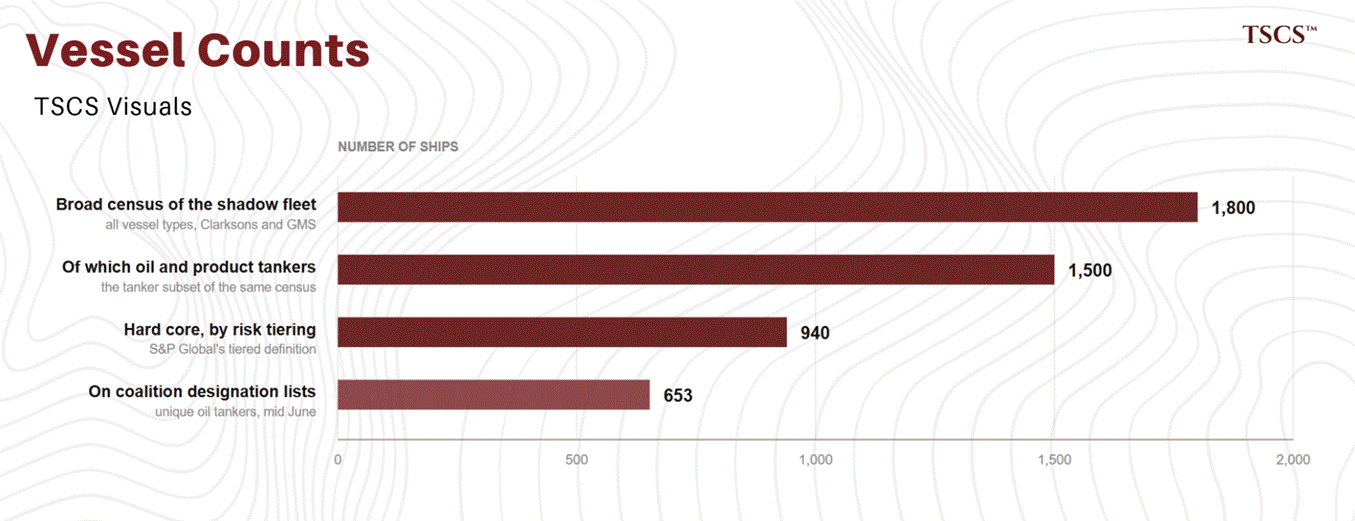
The mechanism question, answered against ourselves.
This project’s working hypothesis was that shadow share breathes with the spread between Urals and the cap: compliant tonnage returns whenever price makes compliance legal. The monthly data killed it.
From February to June the G7-linked share of Russian crude carriage sat in a band of 23 to 33% while Urals traded from $56 to $112 and back to $63, above the caps almost throughout, and the share barely moved in either direction. Pacific-loading crude has run outside International Group insurance since April 2024 regardless of price.
Sanctioned tonnage is locked into the trade that will employ it, and opaque ownership and non-IG cover are sunk investments that do not un-sink when Urals dips. We went looking for a price elasticity and found a caste system. The two-tier tanker market is architecture, not a phase of the cycle.
Ship-to-ship transfers of Russian oil in EU waters ran through Cypriot, Italian and Spanish waters in May: 56, 26 and 18 % respectively, with the global hubs off Malaysia and elsewhere carrying the Pacific and Iranian trades beyond that count’s scope. At least 44 shadow tankers carried cover from three named Russian insurers in May, AlfaStrakhovanie, Balance and Sogaz. 43 vessels ran false flags at end-May, eleven of which had carried both Russian and Iranian oil. One shared evasion infrastructure serves multiple sanctioned states, not national fleets in silos.
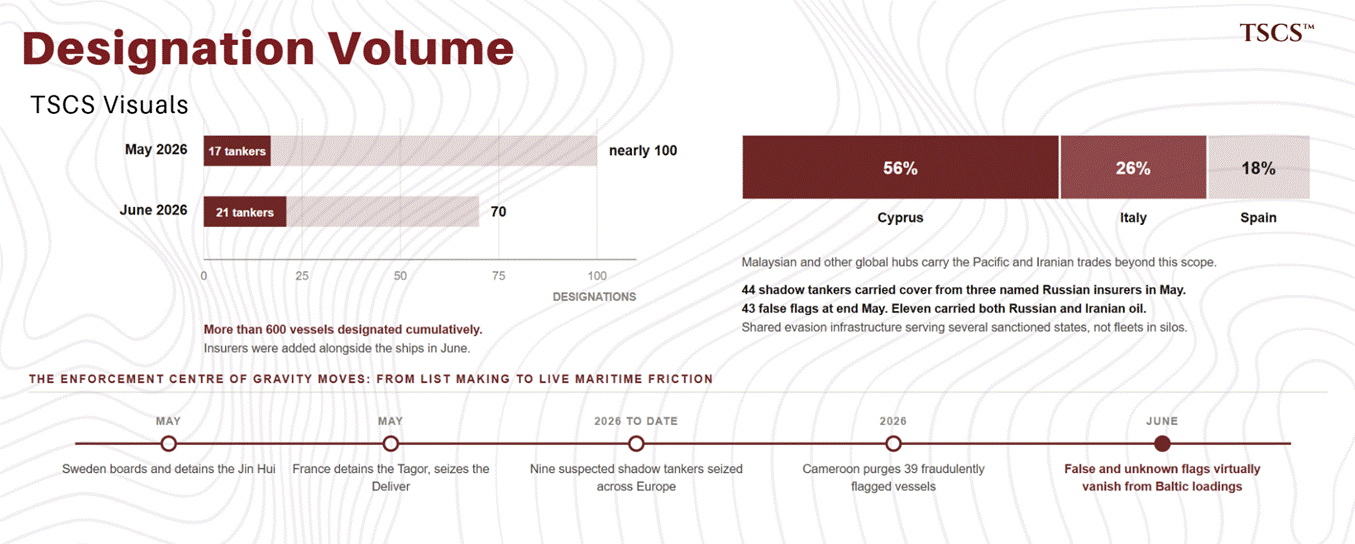
The UK kept naming: nearly 100 designations in May including 17 tankers, 70 more in June including over 20 tankers plus their insurers, more than 600 vessels cumulatively. The sharper edge was physical. Sweden boarded and detained the Jin Hui in May. France detained the Tagor and seized the Deliver. Nine suspected shadow tankers have been seized across Europe this year. The EU’s naval mission is inspecting more in the Mediterranean, and Cameroon purged 39 fraudulently flagged vessels from its registry under European pressure, after which, per KSE, false and unknown flags virtually disappeared from Baltic shipments in June. Registry hygiene, boarding powers and insurance availability are doing what designation volume alone never quite did. Part 7’s permission stack has acquired boarding parties.
Two closing pieces of the map, both about states.
Pipelines are political instruments that occasionally move oil. CPC carries Kazakhstan’s exports through Russian territory to a Russian port, a single point of failure now visible in the Turkish Straits row of the chokepoint table, where Kazakh barrels partially replaced the Urals that Turkey stopped buying.
Druzhba is a Soviet artery split by war. ESPO is Russia’s built escape east, BTC the West’s built detour around Russia, and Trans Mountain, Canada’s egress liberation, arrived in 2024 and was full and apportioned by June 2026. The pattern across all five: the pipe’s route is a foreign policy, its capacity is a negotiating position, and its tariff is the least interesting thing about it.
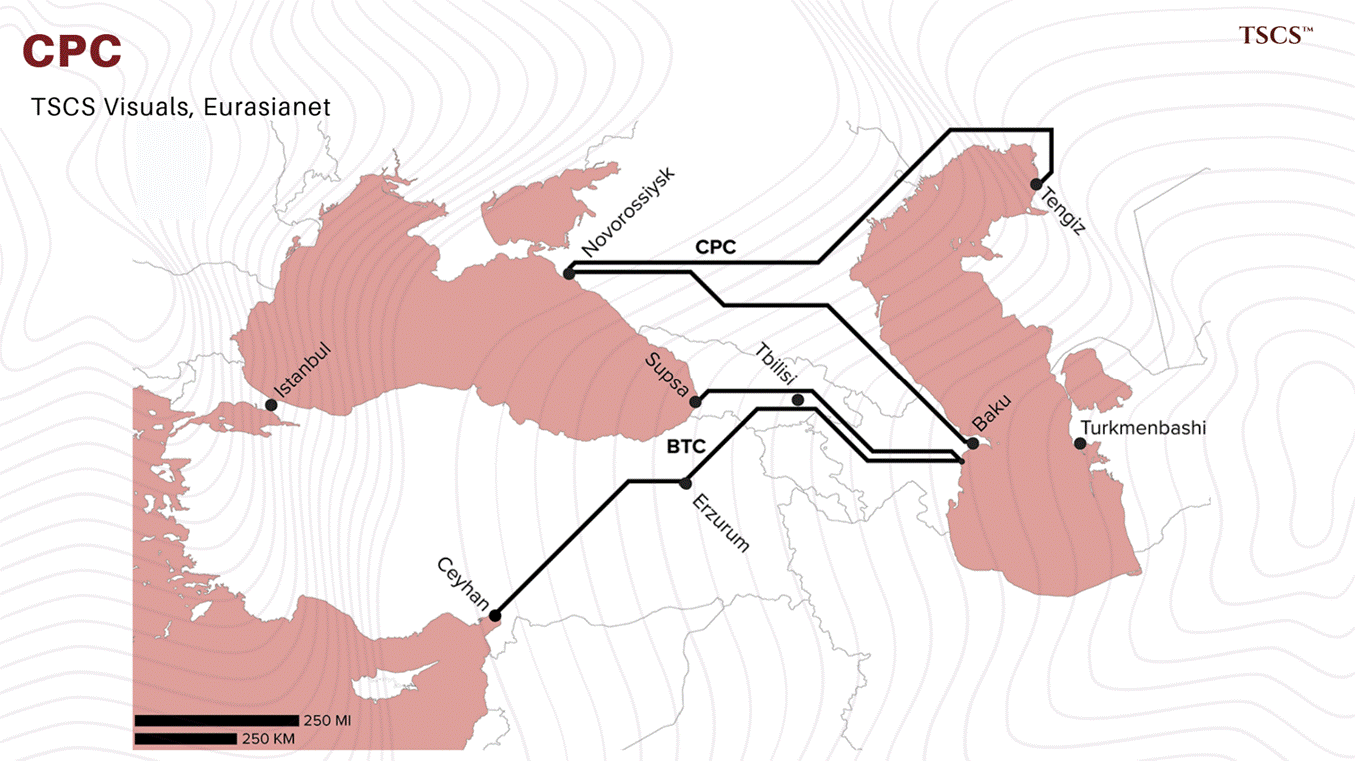
The state also moved into the middle itself in 2026. As storage trader: the coordinated IEA release of some 400 million bbls, the US share running the SPR down to 325.7 million by late June, its lowest since 1983.
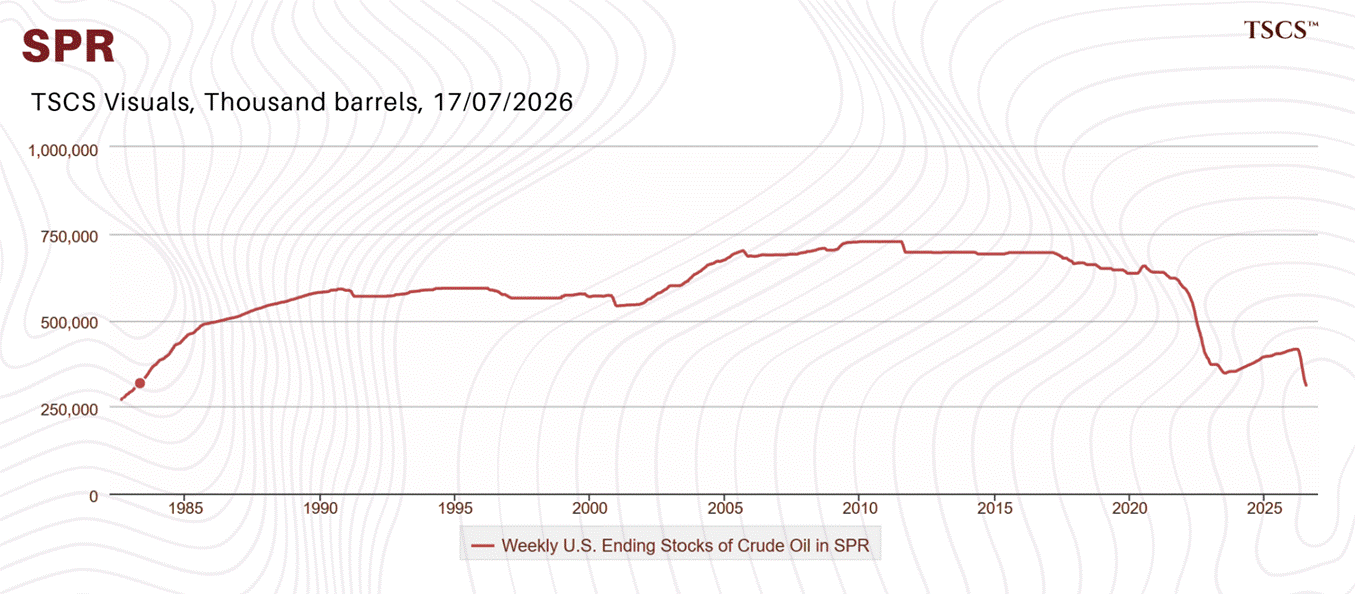
As sanctions-bender: the waiver sequence and the three-week Iranian authorisation above.
And as insurer: Washington directed the DFC to build a Gulf maritime reinsurance facility: $20 billion announced in March with Chubb as genuine lead underwriter, pricing risk and issuing policies, expanded to $40 billion in April, half public, half private.
Then the fact that makes it a better story than the press releases. By May, per FT reporting, the facility had written zero cover, blocked on the absence of a naval-escort framework, while India stood up its own sovereign-backed pool of about $1.4 billion. Whether any of it institutionalises is a question this module leaves open on purpose. Part 9 prices both answers.
We published, in March, a thesis called There Is No V-Shape: that post-disruption normalization runs on different clocks by layer, quarters for crude, longer for the slower machinery. The war has now run four and a half months against that claim.
The episode is honestly still live, the ceasefire broke on 7 July and the strait stood near standstill on the 9th, so this case is bounded. The layered verdict as the tape stands:
Anyone who traded the war in flat price needed to be exactly as good at exits as at entries. Most people are not. They gave it back.
The middle did not V-shape, and the thesis held there. War-risk cover. Freight. Physical flows. Gulf exports overall were still 40% below the prior year. Asian product exports still 13% under pre-war. The benchmarks stayed rebuilt, Platts’ crisis rules standing until further notice. And the map stayed redrawn: India at a record 2.7 million barrels a day of Russian crude, the Atlantic embedded as Asia’s balancing supply, Urals swinging from historic premium to double-digit discount as the legality gap repriced.
The re-escalation may yet re-mark every layer. And the reader should notice that this grading conveniently flatters the layers where our book lives. Read it yourself. That is what it’s for.
Every part of this module has ended on the same question. The ladder has owners. The tanks that broke the price in 2020 had owners. The ships earning 470,000 dollars a day had owners. So here is the census, and its shape matters more than any name in it, especially if you arrived holding a brokerage account.
The middle of the oil market is owned in three segments. There is a listed minority you can buy. There is a private majority, dynasties and merchant houses, that you can’t. And there is a state layer that does not mark to market, does not report, and does not have to sell. The crown jewels of everything this module has described, the trading books, the bypass pipelines, the best tankage, much of the real fleet, sit overwhelmingly in the second and third castes. The tickers are a window onto the middle. They are not the middle.
That fact sets the discipline for Part 8: before pricing any proposition, ask who owns the asset that closes the spread. The answer is frequently “not you.”
If you want to know which of these companies is actually worth owning, that deserves more than a chapter, and it is going to get more than one. Individual deep dives follow on the names in this census where the answer is genuinely interesting, each running the same test: match the proposition to the asset, ask who owns it, and find what the market has not marked yet.
If this module was worth the hours it took to read, the paid side is where it gets put to work.
North American energy infrastructure is the one province of the middle where public markets own the assets: Enterprise Products, Energy Transfer, Kinder Morgan, Williams, ONEOK, MPLX, Plains and Targa in the United States, Enbridge, TC Energy and Pembina in Canada. Together they are the pipes, fractionators, tanks and docks of the continent.
Two sorting principles separate them, and neither is the dividend yield the sector gets shopped on. The first is business mix, which hides the fact Part 2 flagged: US midstream is substantially a gas and NGL business wearing an oil-adjacent name. Targa and ONEOK live on the NGL chain. Williams and Kinder are gas arteries. Plains is the closest thing to a crude pure-play, Enterprise is the diversified everything-store, and “energy infrastructure” names therefore respond to entirely different molecules, a distinction the sector ETF cheerfully ignores. The second sort is contract quality: what share of cash flow sits behind take-or-pay, how investment-grade the counterparties are, and, the question the dividend obscures, when the contracts roll. And onto what ladder. A pipe is a claim on its recontracting outcomes.
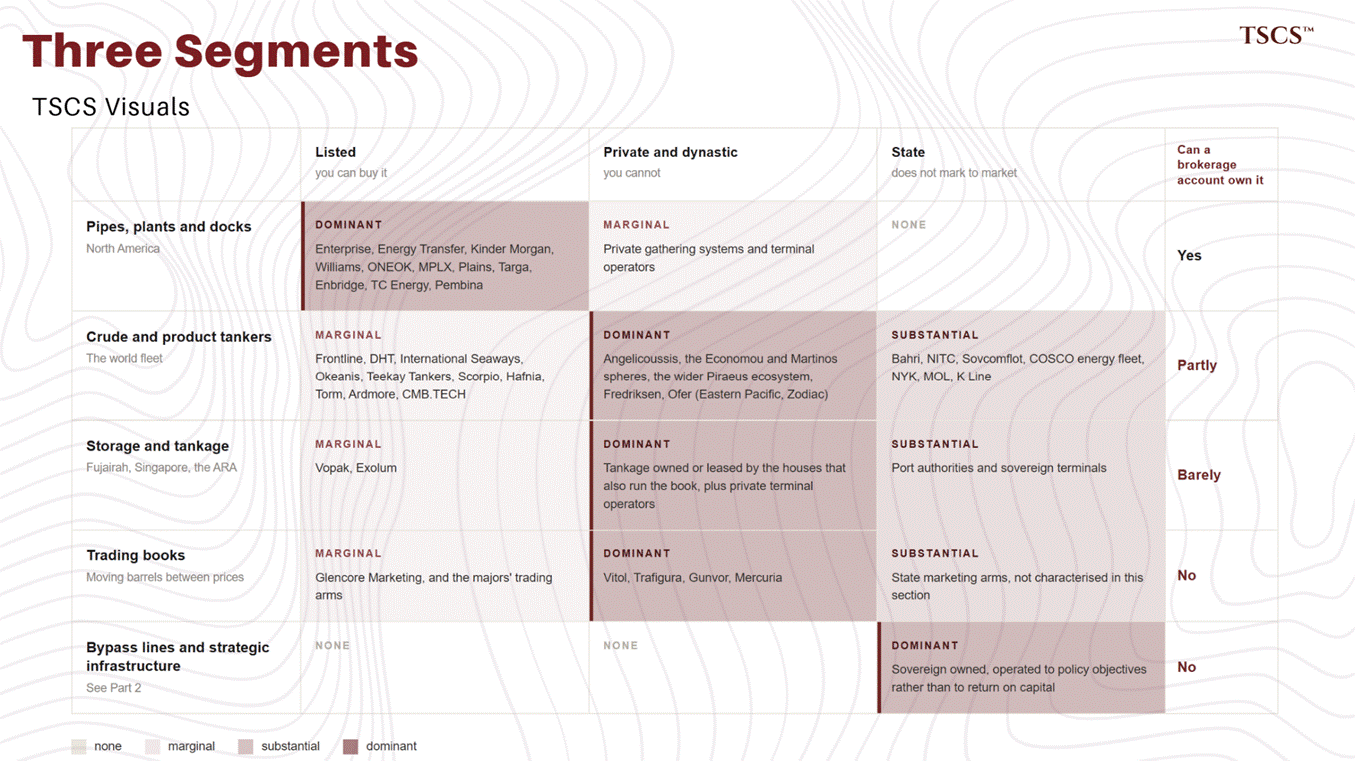
The sector’s character was formed by a trauma worth one paragraph. Through the 2010s, the master limited partnership structure, built to pass income through untaxed, was converted by incentive-distribution mechanics into a growth machine. General partners were paid escalating shares of every distribution increase, so partnerships issued equity and debt to build anything that moved the payout. The reckoning ran from 2015 to 2020: distribution cuts across the sector, collapsing units, then a wave of simplifications and C-corp conversions that buried the worst of it. Today’s discipline, the buybacks, the coverage ratios, the reluctance to build on spec, is scar tissue. Whether it outlives the memory is one of Part 9’s quieter questions.
The dated exhibit, early July, refreshed at publication: Enterprise near 36.75 dollars yielding about 6%, Energy Transfer about 7, MPLX about 7.5, Williams under 3, Kinder under 4, Targa under 2, ONEOK about 4.9. The gauge that matters is the AMLP yield near 7.8% against a ten-year Treasury near 4.5, call it a three-point spread standing for the sector’s terminal-value and rate anxieties. Add Part 7’s index reset trimming allowed tariff drift for five years, and the caste summarises honestly: genuinely buyable, genuinely cash-generative, and priced like bonds whose covenants are quietly being rewritten.
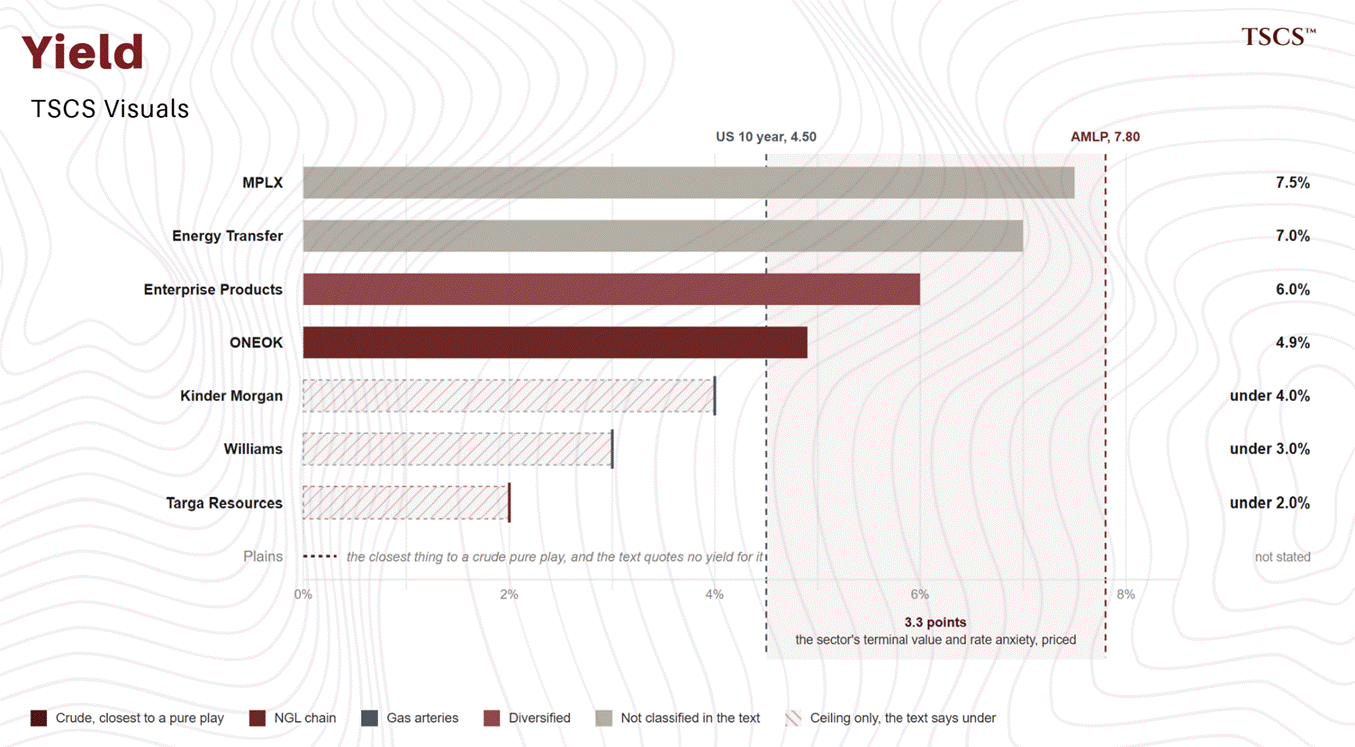
The listed crude owners: Frontline, DHT, International Seaways, Okeanis, Teekay Tankers. Each is essentially a fleet of large crude carriers wearing a balance sheet, differentiated by leverage, fleet age and how much rides spot. The listed product owners: Scorpio, Hafnia, Torm, Ardmore, same species, cleaner cargoes, and after Part 4 you know to check the LR2 orderbook before admiring anyone’s earnings. The group’s corporate soap opera is the Euronav affair: a failed merger with Frontline, a family counterbid, and the winners, the Saverys’ CMB, rebranding the company as CMB.TECH. Today that is a roughly 250-vessel diversified group spanning crude, dry bulk, chemicals, containers, offshore wind vessels and a hydrogen division. It remains listed in Brussels, New York and Oslo, with Euronav surviving inside it as the crude segment. The purest large crude play on European exchanges was swallowed by a conglomerate. Even in the listed caste, founding families outvote the float, and listed tanker exposure has a way of quietly evaporating.
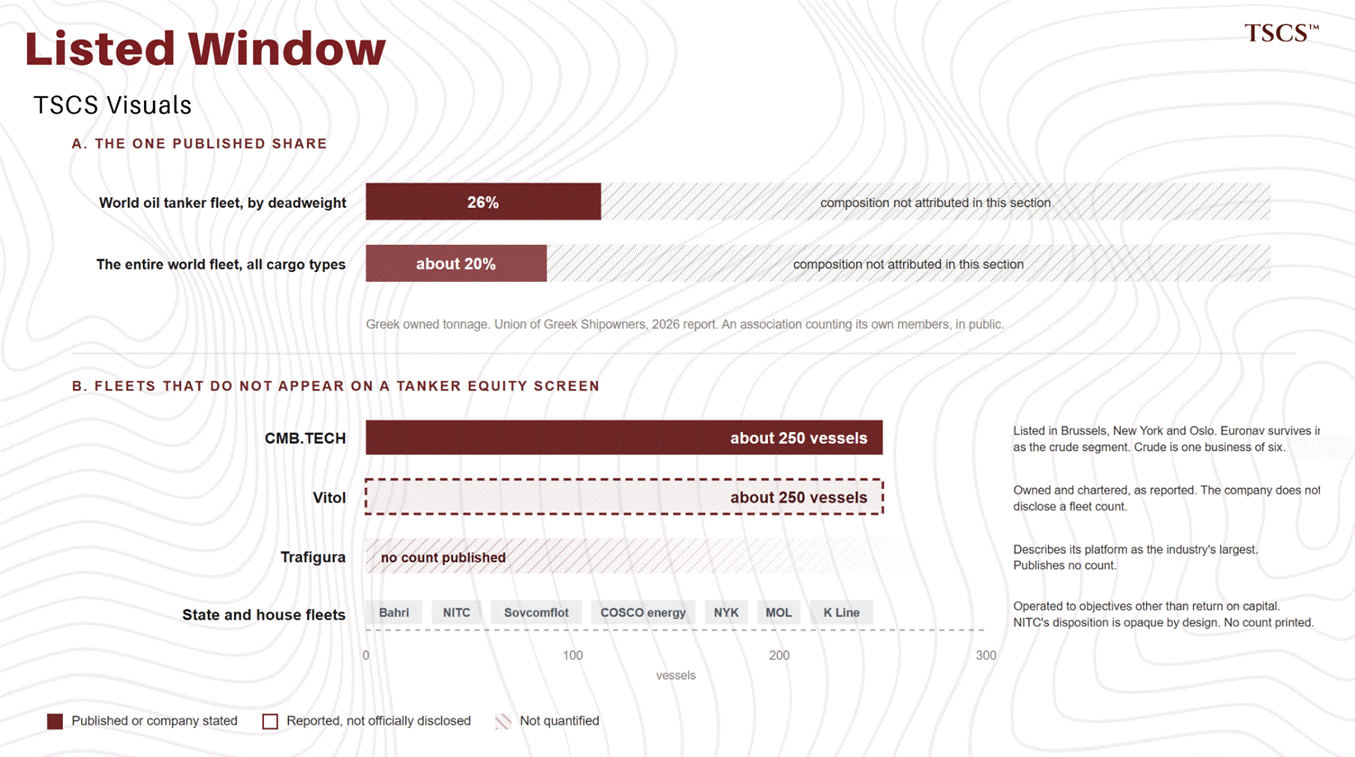
The valuation language was set in Part 4 and bears one line here: NAV, fleet age, orderbook exposure, never the earnings multiple, for the reason Part 1 gave.
We put the short version of this argument in a note earlier this month, if you want it in one screen:
Now widen the lens. The deep water of tanker ownership is private and dynastic. The Greek shipping families above all: Angelicoussis the largest of the private empires, the Economou and Martinos spheres, the broader Piraeus ecosystem that has treated shipping as a multigenerational family business since before the supertanker existed. Alongside them, Fredriksen’s Norwegian sphere, controlling listed vehicles from a private centre, and the Ofer family’s Eastern Pacific and Zodiac operations. The scale is not folklore. The Union of Greek Shipowners’ 2026 report puts Greek-owned tonnage at 26% of the world’s oil tanker fleet by deadweight, about a fifth of the entire world fleet, an association counting its own members, admittedly, but counting them in public. Characterise the caste rather than count it: these owners buy ships the way Part 3’s merchants buy optionality. Countercyclically, near steel value, with patience measured in generations. And they sell the same way, which produced one of the quiet fortunes of the sanctions era: elderly tonnage exiting the mainstream fleet into anonymous hands at extraordinary prices as the shadow fleet assembled itself. The dynasties were the shadow fleet’s used-car dealers. Legally, profitably, and with the plausible deniability of a bill of sale.
Then the state fleets, where shipping becomes policy. Bahri carries the kingdom’s crude in the kingdom’s VLCCs. NITC carries Iran’s, and the census entry is that its true disposition is opaque by design; this primer prints no count. Sovcomflot, designated since 2024, is the closest thing the shadow system has to a flagship company. COSCO’s energy fleet is Chinese import security expressed as steel, and the Japanese house fleets, NYK, MOL, K Line, are the quiet giants of the compliant trade. None of these owners answers to a NAV screen. A meaningful share of the world’s tanker capacity is operated to objectives other than return on capital, and every freight model that forgets this is modelling a market smaller than the real one.
If pipes are the most buyable caste and ships a partial window, storage is where the public market nearly runs out of product. Vopak stands almost alone as a listed pure-play: 35.5 million cubic metres of total capacity at end-2025 by its own reporting, about 20.4 million proportional to its actual ownership stakes.
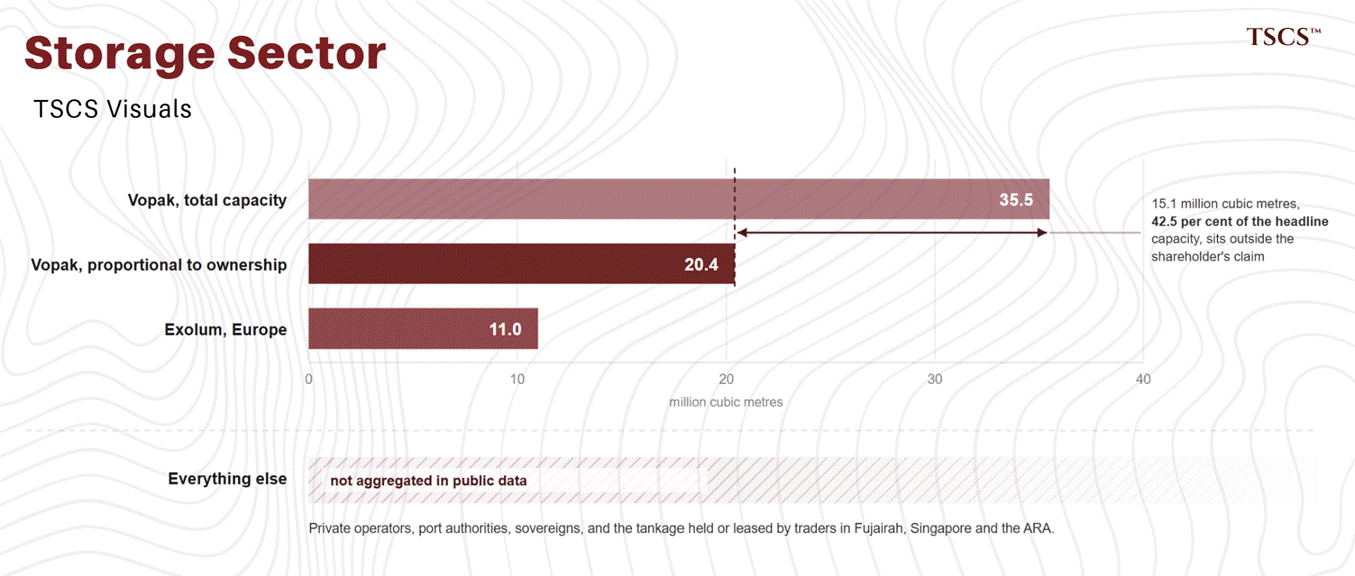
Exolum follows in Europe at about 11 million. After that the register fragments into private operators, port authorities, sovereigns and, most importantly, the tankage that never appears in any storage company’s accounts because it belongs to the people with the trading book attached. Parts 2 and 3 established that a tank’s highest value lives in its blending rights and its option value. Both are worth most to an owner who also runs a book, which is why the best tankage in Fujairah, Singapore and the ARA is disproportionately held or leased by traders. The listed storage layer is adversely selected. The strategic steel was bought by people who understood Part 3 before we wrote it.
For the last five years, four private firms have been quietly out-earning the largest integrated oil companies on earth at the specific business of moving barrels between prices. This section, written with Giacomo, says how, ranks the machinery, and marks the boundary between what is known and what is guessed.
The record first, because the numbers are the argument. Trafigura publishes audited accounts because it issues bonds. It cleared $7.0 billion in fiscal 2022 and a record $7.4 billion in 2023. Its first half of fiscal 2026 printed $4.09 billion, more than its entire prior year, in a half containing only the war’s first month. Vitol, triangulated across Luxembourg filings and newswires, made roughly $15.1 billion in 2022 and $13.2 in 2023, settling to about $4.5 billion in 2025. Gunvor’s $2.36 billion in 2022 was its all-time record. Mercuria’s $2.98 billion more than doubled its prior year. Aggregate the four and 2022 delivered over $25 billion dollars of private trading profit, in a business the popular imagination still files under middlemen.
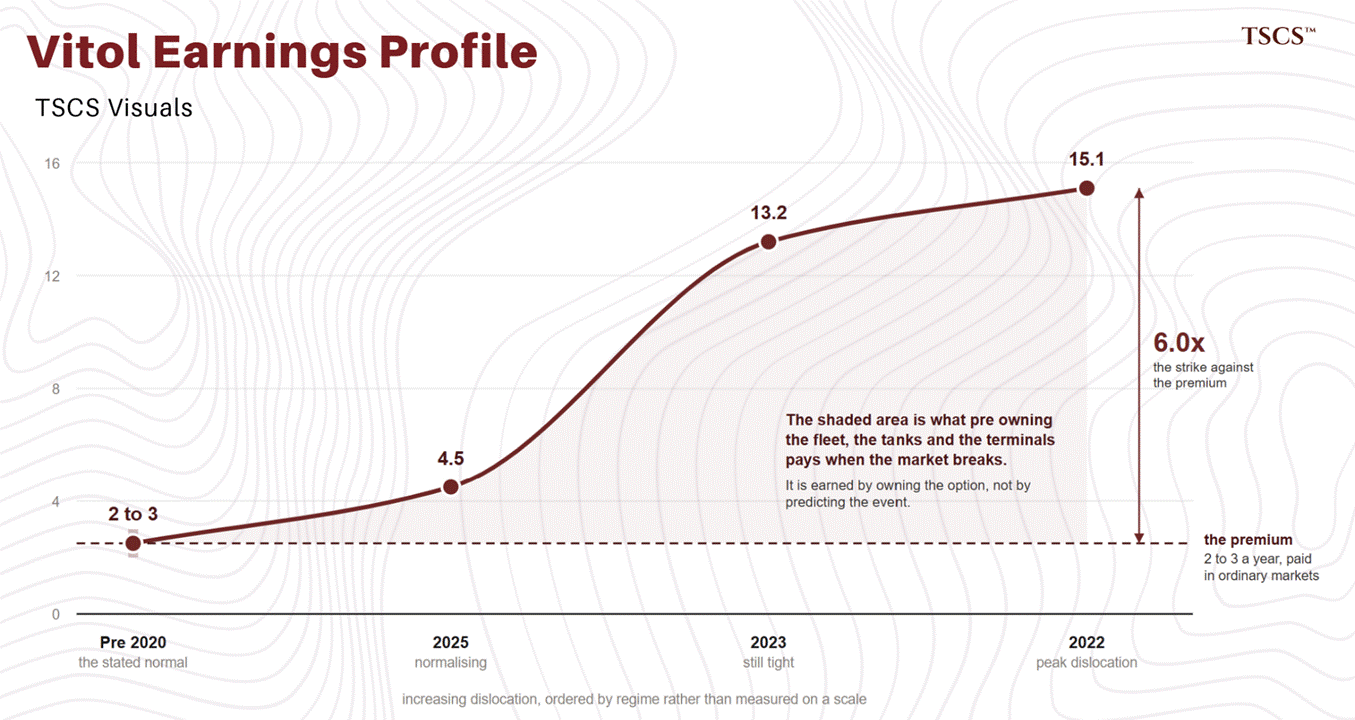
For scale, the closest public benchmark, Glencore’s Marketing division, describes its own through-cycle range as $2.3 to $3.5 billion of adjusted EBIT and printed $6.4 in its 2022 outlier. And the majors, in this war, showed the other side of the trade: Exxon’s Energy Products segment lost $1.26 billion in the first quarter of 2026, including a $706 million hedge loss related to Hormuz. Chevron took $2.9 billion of negative derivative and inventory timing in the same quarter. Total guided its LNG segment down on weaker trading. The same dislocation, run through a listed structure with quarterly reporting and hedge accounting, printed as damage. Run through a private structure, it printed as the best half in Trafigura’s history. Something structural separates the two groups.
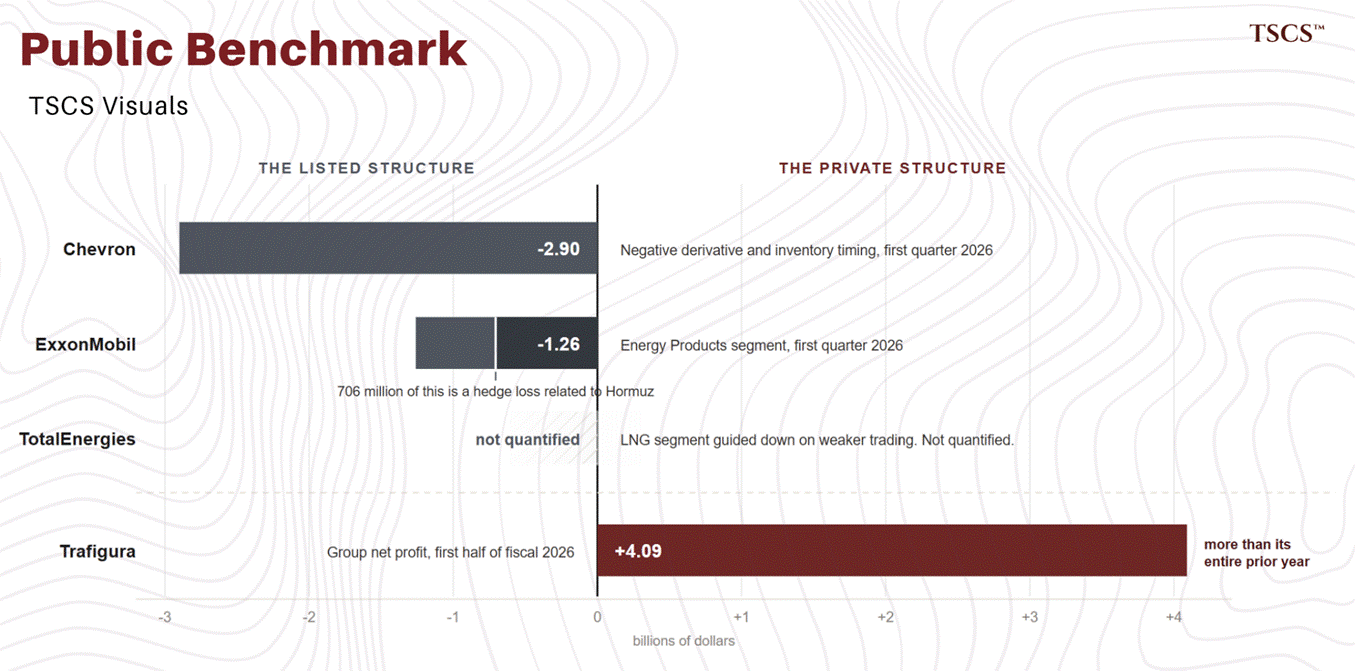
What separates them is that they’re infrastructure companies with trading books attached.
Part 3.4 already looked at the machinery, terminals, refineries, chartered fleets, prepay finance, so one paragraph of additions suffices here: Trafigura consolidates Puma Energy’s global downstream footprint at 93% and describes its own tanker platform as the industry’s largest without publishing a count. Vitol’s fleet is reported around 250 vessels, owned and chartered, a figure the company does not officially disclose. Gunvor’s refining story is instructive in the other direction, Ingolstadt still running, Rotterdam Europoort halted in late 2024 on feedstock economics, Antwerp effectively wound down years earlier: infrastructure is an option, and options get abandoned too. Mercuria is the portfolio outlier, with over half its long-term asset book in energy-transition assets by its own accounting. (One correction our collaborator supplies to a circulating error: Mercuria did not buy Aethon Energy. Mitsubishi did, in January 2026, at 5.2 billion dollars enterprise value. File under why primary sources exist.)
Now the section’s centrepiece: the profit mechanisms, ranked, calm market against dislocated market.
The ranking is informed inference, assembled from disclosures, segment commentary and years of watching. It is not an audit. It is what a serious observer would defend. In a calm market the money comes, in order, from basis trading, time spreads, blending, logistics optionality, prepay financing, and political access. Information asymmetry, once the sector’s first advantage, barely makes the list. In the dislocated market of 2026 the order inverts: logistics optionality first, political access second, prepay third, time spreads fourth, basis fifth, blending sixth. Three moves in that inversion tell the whole modern story of the sector.
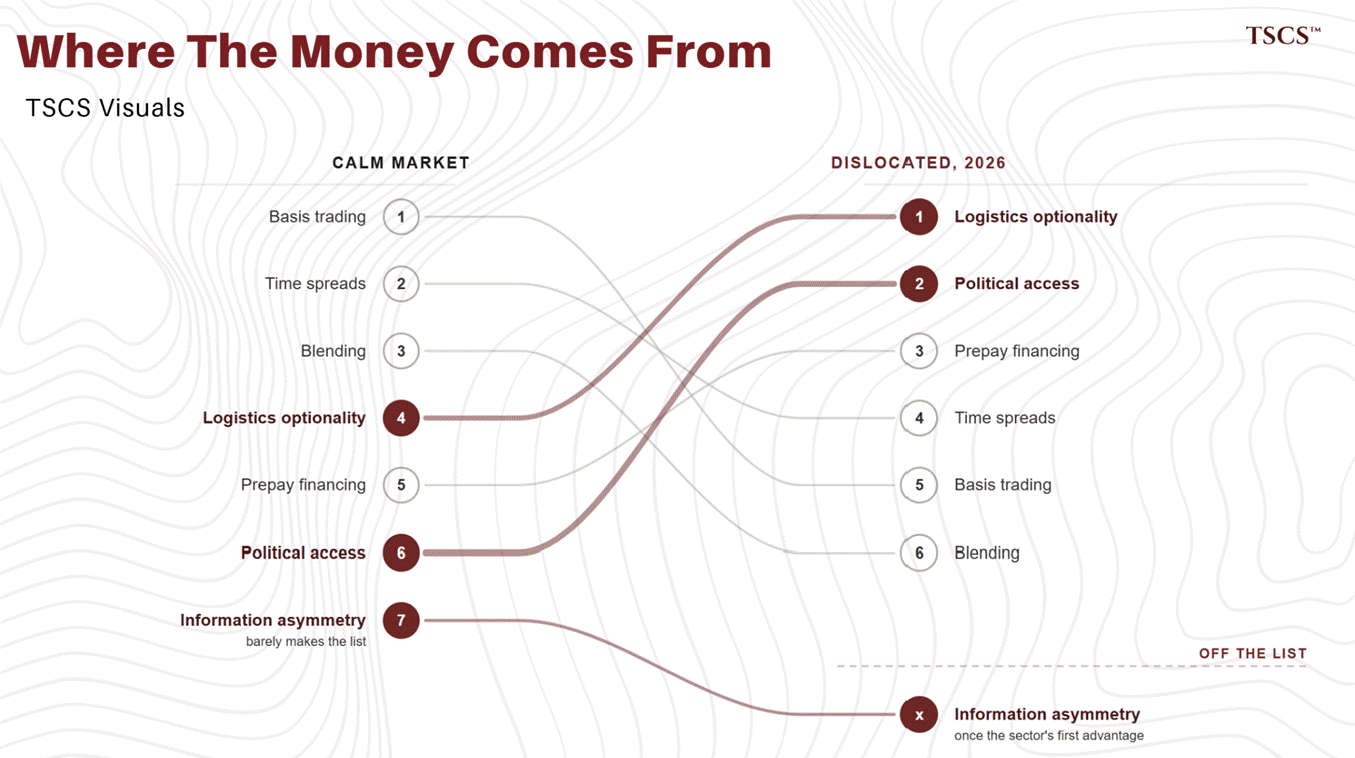
The first is logistics optionality going from fourth to first, which is just Part 3.4 marking to market. When war-risk premium went from a quarter of a percent of hull value toward ten, whoever pre-owns the fleet and the tanks earns the entire dislocation premium. The 2022-to-2026 profit numbers are largely this mechanism.
The second is political access going from last to second. The Iranian general licence lived for three weeks between issuance and revocation; houses with pre-positioned relationships captured cargoes inside that window and paid the repositioning bill when it slammed.
On the Russian side, Washington’s shift from naming individual ships to mass-designating 183 vessels in a single January 2025 action rewrote, in one business day, which tonnage, which transfer points and which counterparties could touch a barrel. And Venezuela ran the tape in reverse, two general licences in early 2026 reopening, under conditions, what had been shut. The compliance work behind a Russian barrel today would be unrecognisable to a trader from 2019, and structuring the compliance around a flow has become as central to profitability as the flow itself.
Giacomo makes it granular. An Asian products trader describes second-tier houses treating Malaysia as a blending hub, laundering sanctioned barrels into new paperwork. He describes a quiet arms race for product off Russia’s drone-degraded refineries. And he describes Indian and Chinese refiners running discounted Russian crude and selling the products back into Russia through intermediaries, at a premium. The constraint, in his words, is now compliance.
The third move is information asymmetry falling from first to nowhere, and it is the largest structural shift in the sector’s economics in a decade. Kpler, Vortexa and their peers commoditised vessel positions. The EIA, JODI and the ARA weeklies publicised flows. What was a decades-long proprietary advantage is now a subscription, the residual edge measured in hours and cargo sub-splits, and the houses’ response was to double down on everything else.
A firm holding only information has no moat left.
The three-legged stool is information, logistics and finance.
Which is the right place to correct the books, because the popular canon, The World for Sale, The King of Oil, gets the cultural texture right and the modern model wrong in four ways.
The adventurer era is over: Vitol settled with the DOJ and CFTC in 2020 for about $164 million over conduct in Ecuador, Mexico and Brazil. Glencore’s coordinated 2022 resolution exceeded $1.2 billion, the sector’s largest. Trafigura paid about $127 million in 2024 over historical Petrobras-linked payments. Then it handed the CEO chair to Richard Holtum on schedule: an orderly, layered, documented succession with the CFO staying put. The houses walk into Geneva and Singapore in 2026 with compliance apparatus that would embarrass some banks.
Second, they are not information plays; see above.
Third, the 2022 windfall was not luck: Vitol’s pre-2020 normal was $2 to $3 billion a year, that normal was the option premium, and $15 billion was the model working as designed.
And fourth, they are not invincible. Trafigura lost about $1.1 billion across two fiscal years to a counterfeit nickel-cargo scheme. Gunvor’s 2025 profit fell 85% to $104 million, with $462 million of impairments and a US Treasury designation as a “Kremlin puppet” during its blocked Lukoil deal, presence being necessary and not sufficient, as Part 3.4 said. And Mercuria once paid for a copper cargo that arrived as spray-painted paving stones. Roughly $36 million for painted fucking rocks. The private structure absorbs these losses without the public panic a listed company would face. Absence of panic is not absence of loss.
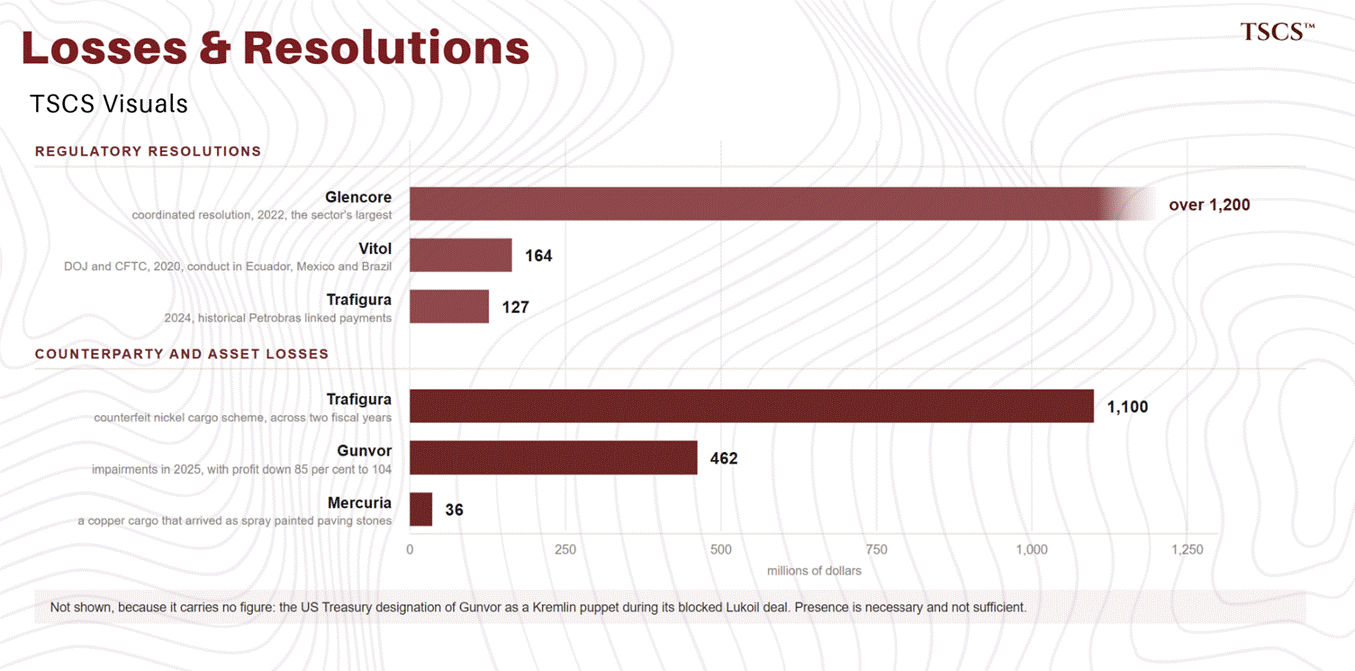
The boundary of knowledge, stated per the house standard, because on these firms the boundary is unusually sharp.
Public and fully sourceable: Trafigura’s audited accounts, Glencore Marketing’s disclosures, registered asset ownership, every OFAC action and settlement cited above, the succession.
Informed inference, defensible but unaudited: Vitol’s and Mercuria’s profits, the mechanism ranking, sector-level fleet, storage and prepay aggregates, low tens of billions for the latter. Guess, and therefore left out: desk-level P&L, position sizing, counterparty exposures, compensation, and any attribution of profit to specific sanctioned routings. Where a figure would have fallen in the third tier, this section does not contain it. That restraint is the difference between a primer that ages well and one a market participant can dismiss.
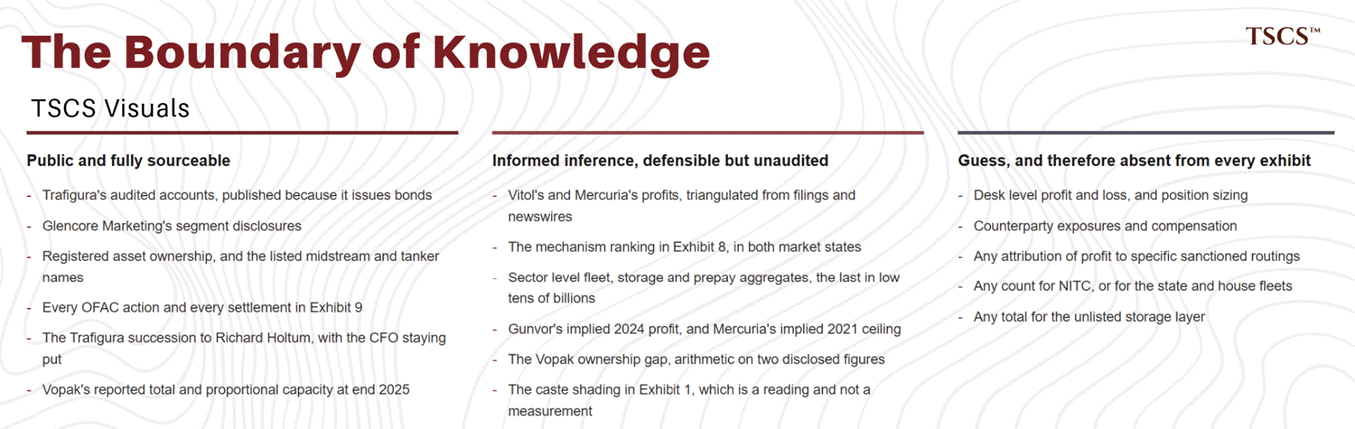
The working edge for the reader, three leading indicators, none of them spot prices.
Watch the ratio of one-year time-charter rates to spot earnings: when spot vastly exceeds term, the houses’ pre-chartered fleets are minting money the equity market has not marked anywhere.
Watch prepay disclosures in producer-country accounts: rising prepay is rising trading-house credit extension, and fee income follows.
And watch the gap between the majors’ derivative-timing damage and the houses’ reported income in the same periods: that gap is the private structure’s arbitrage over the public one.
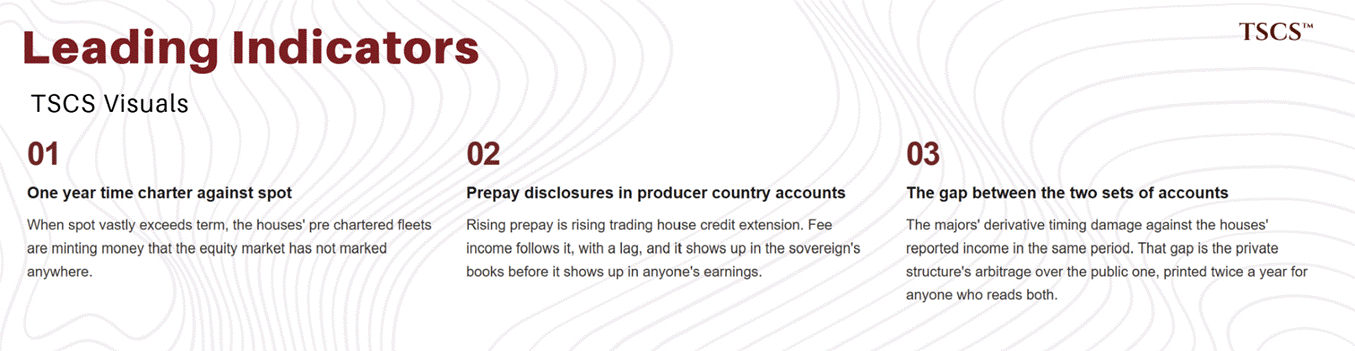
Everything in this module so far has treated the middle as machinery: steel, water, tanks, formulas. This part is about the fact that none of the machinery is allowed to move without paperwork, and that the paperwork is not one thing but a stack, five permissions deep, each issued by a different authority, each independently revocable, and each repricing at its own characteristic speed.
Lay the stack out once, because the rest of the part is a tour of it. At the bottom, tariff and siting permission: the state’s terms for the pipes and docks, repricing over years and five-year cycles. Then flag and class: the quasi-private registry and classification system that says a ship is a ship, repricing over months when it moves at all. Then insurance, the private layer, hull, cargo, liability, war, repricing in days, and in 2026, in hours. Then sanctions compliance, the legality gap from Part 3, repricing at the speed of a subscriber notice from OFAC or Brussels. And on top, liability, the courts’ retroactive permission, which reprices rarely and then catastrophically, one bad casualty at a time.
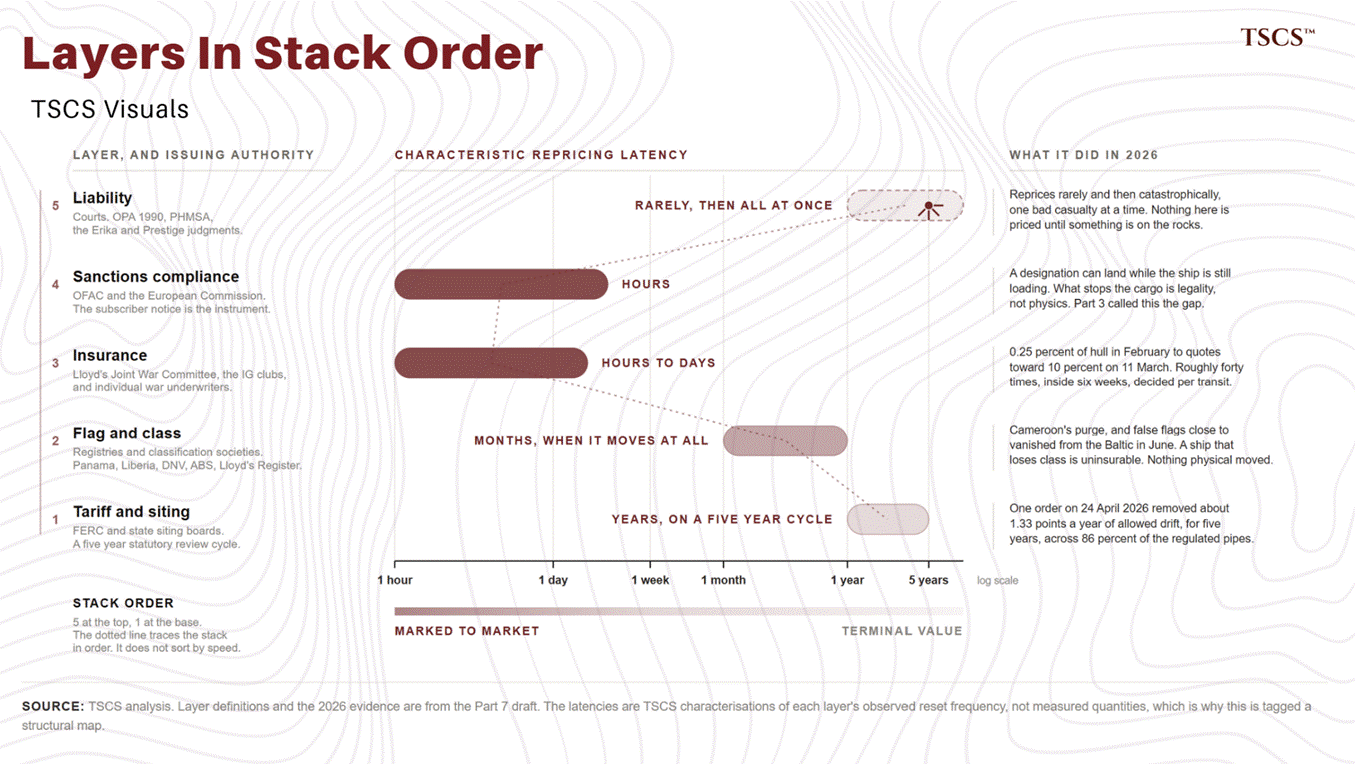
The investable observation that organises the part: the speed hierarchy is the volatility hierarchy. The slow layers quietly set the terminal economics of the toll assets; the fast layers produce the most violent repricings in the entire complex, and none of them come from OPEC. If Part 5 taught you to watch the map, this part teaches you to watch the filing cabinet, because in 2026 the filing cabinet moved markets that navies could not.
Part 3 carried the mechanics, so here is the political economy in brief.
Most US interstate liquids pipeline rates, about 86% of them, drift with a FERC index rather than being set freely, and every five years the commission recalibrates the formula in a proceeding that midstream investors mostly ignore and should not.
The current cycle is the object lesson: the prior index of PPI plus 0.78% had itself been through litigation, vacatur and reinstatement, complete with retroactive true-up invoicing, and the reset finalised on 24 April 2026 landed at PPI minus 0.55% for July 2026 through June 2031, against a proposed -1.42 that the industry fought back from, worth, by one commissioner’s arithmetic, about $4.5 billion over the period.
Appeals are anticipated, because they always are. The through-line for a pipe investor: roughly 1.3 points a year of allowed tariff drift vanished with one order, across most of the regulated universe, and the market barely repriced anything. Slow layers are like that.
Siting belongs here too, the permitting wars that decide whether new rungs get built at all, and its lesson is symmetrical: the same state that trims your tariff also, by blocking your would-be competitor, protects your scarcity.
One national law deserves its own section.
The Jones Act of 1920 requires that cargo moving between two US ports travel on ships that are US-built, US-flagged, US-crewed and US-owned, and since such tankers are few and cost multiples of foreign-built equivalents to construct and operate, the practical effect is that America’s coasts are, for oil logistics purposes, foreign countries to each other. Hence the standing absurdity this module files under the ladder law: Gulf Coast refineries export gasoline to Latin America while the US Northeast imports gasoline from Europe, because the sea lane between Houston and New York is legally more expensive than the Atlantic Ocean.
The rung between two American ports is priced not by distance but by statute. Repeal debates recur, and stall on shipyard and security politics, and the investable point is modest but real: Jones Act tonnage is a tiny, protected, weirdly valuable fleet, and the law’s occasional emergency waivers, granted after hurricanes, are one-day case studies in what the moat is worth.
A ship’s nationality is a product you can buy. Most of the world fleet flies flags of convenience, Panama, Liberia, the Marshall Islands, registries that sell regulatory domicile, and the system works, when it works, because beneath the flag sits classification, the private societies, DNV, ABS, Lloyd’s Register and peers, whose surveys certify that the steel is sound, and whose certificates are what insurers and charterers actually rely on. Flag and class are the permission layer most exposed by the shadow fleet: Part 5 recorded what happens when registries are gamed, false flags, and what happens when the system fights back, Cameroon’s purge and the near-disappearance of false flags from the Baltic in June. A ship that loses class is uninsurable; a ship that loses its flag is stateless; both are commercially dead without a single physical thing changing. Paperwork, again, moving steel.
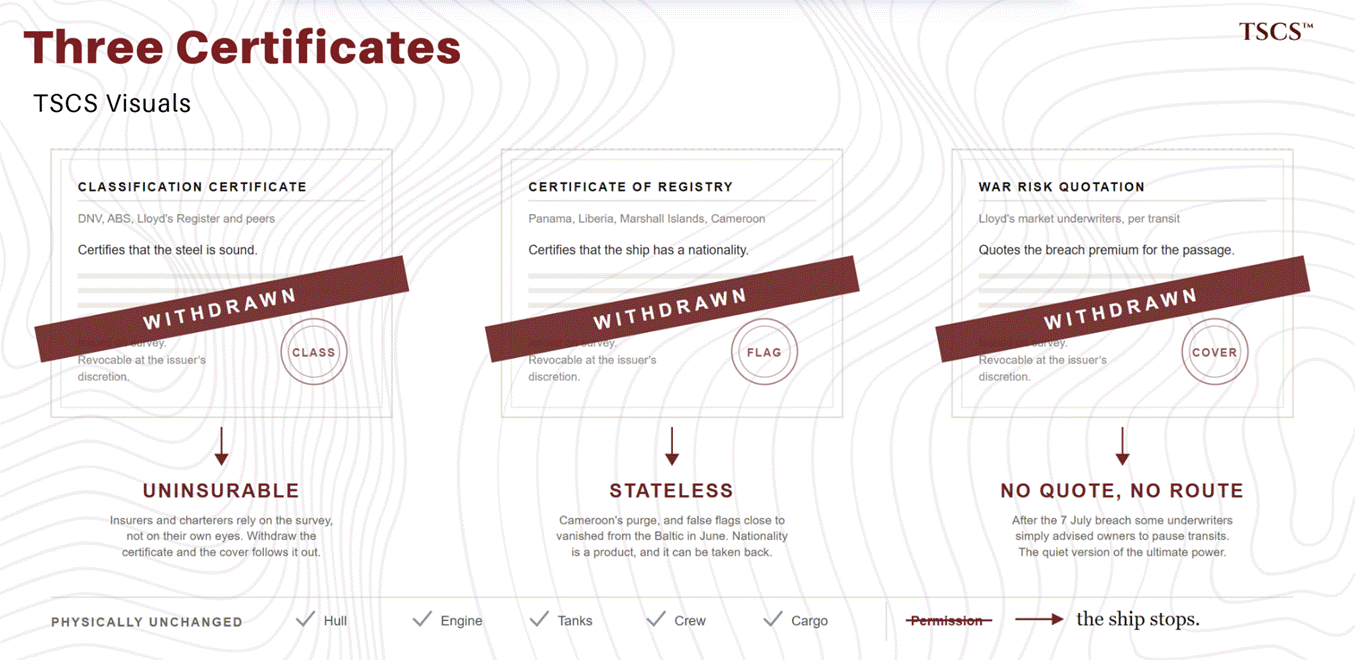
The same layer carries the industry’s safety history written in law: the double-hull mandate that followed the Exxon Valdez and Europe’s Erika and Prestige casualties retired an entire generation of tankers by statute, the clearest precedent that regulation can execute fleet renewal that markets will not. And it now carries the decarbonisation stack, which is best understood, for this module’s purposes, as a slow-moving cost wedge with a fast-moving political fight on top.
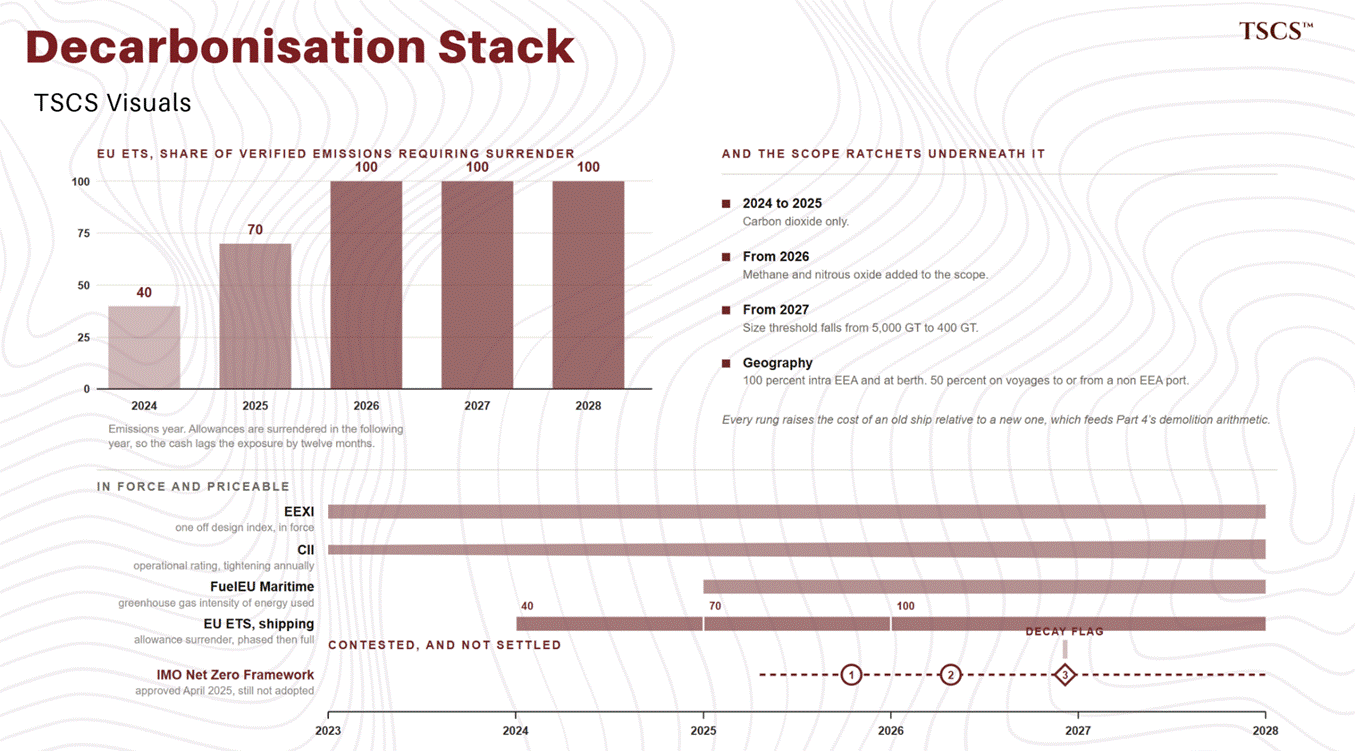
In force and priceable: the IMO’s efficiency and carbon-intensity regimes, EEXI and CII, which quietly handicap older tonnage; the EU’s emissions trading extension to shipping, phased by emissions year, 40% of 2024’s emissions, 70% of 2025’s, 100% from 2026, each surrendered the following year; and FuelEU’s fuel-intensity rules alongside. Contested and, as we write, not settled: the IMO’s global net-zero framework, whose adoption fight in late 2025 was postponed under open great-power pressure, and whose current status this draft deliberately leaves as a flagged line rather than a guess.
The investable through-line does not depend on the fight’s outcome: every layer of the green stack raises the cost of old ships relative to new ones, which feeds directly into Part 4’s demolition mathematics, except, as Part 4 recorded, the sanctions economy is currently paying old ships too well to die.
Now the layer where repricing is measured in hours.
Hull and machinery covers the ship, cargo insurance covers the barrels, and protection and indemnity, the liability layer, is dominated by the International Group’s mutual clubs, which together insure roughly 9/10 of ocean-going tonnage and pool their large claims into a shared reinsurance programme. Its market power is why the price cap was built on it: the cap is enforced by the attestation a shipowner needs to keep that insurance, which is why the shadow fleet’s defining feature is not its flags or its age but its exit from the IG system into Russian and unknown cover, AlfaStrakhovanie, Balance, Sogaz, with an uninsured casualty as the tail everyone is pricing by ignoring.
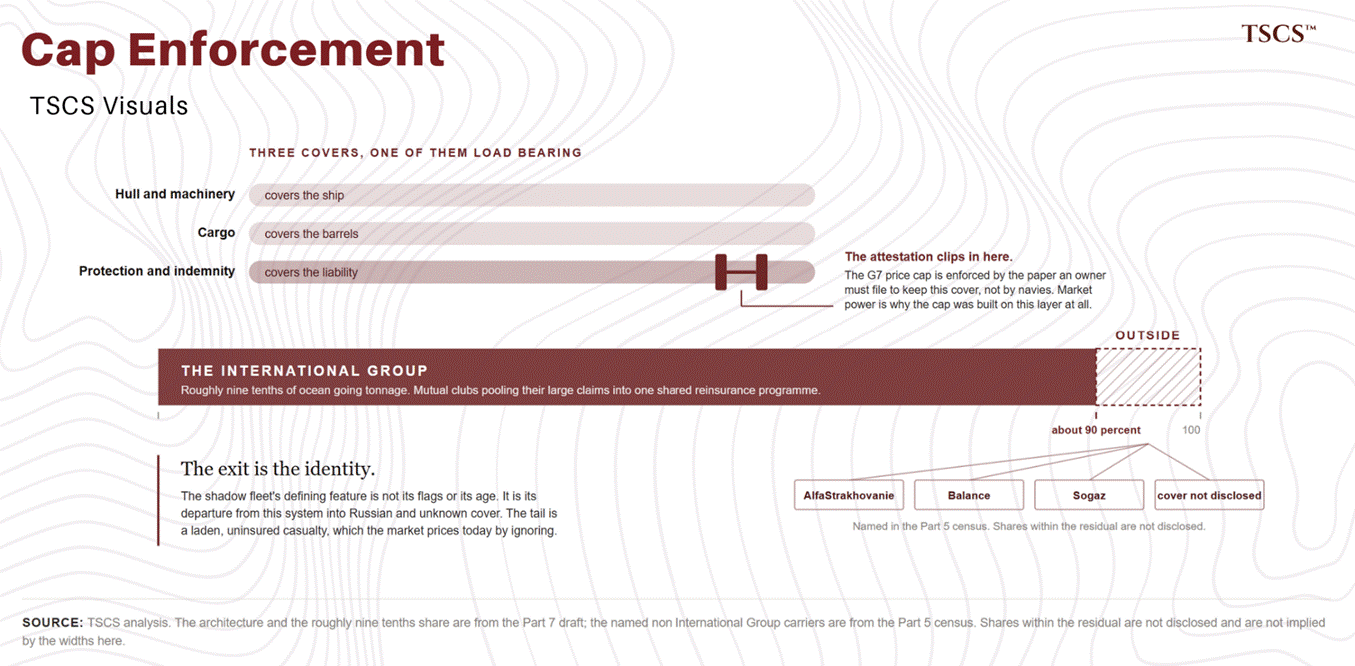
War risk is the layer’s fast twitch. The Lloyd’s market’s Joint War Committee maintains the listed areas, waters where standard annual war cover stops applying automatically; entering one requires notifying underwriters and paying a breach premium quoted per transit, typically on 24-to-48-hour validity, repriced continuously.
In 2026 the committee listed the entire Persian Gulf faster than any cartel, parliament or admiralty could convene. When this module says the middle repriced the war first, this is the desk it happened on. And the sequel matters as much: in the days after the 7 July breach, some war underwriters simply advised owners to pause transits, which is the quiet version of the ultimate power this layer holds, the power not to quote. An unquoted route is a closed route, whatever the water is doing.
Which is why the state came shopping in this layer specifically, per Part 5.6: forty billion dollars of announced reinsurance capacity, aimed at the one permission that was actually binding, and no policies written.
The open question this module keeps refusing to close: whether 2026 makes the sovereign a permanent resident of the insurance layer or its most expensive tourist.
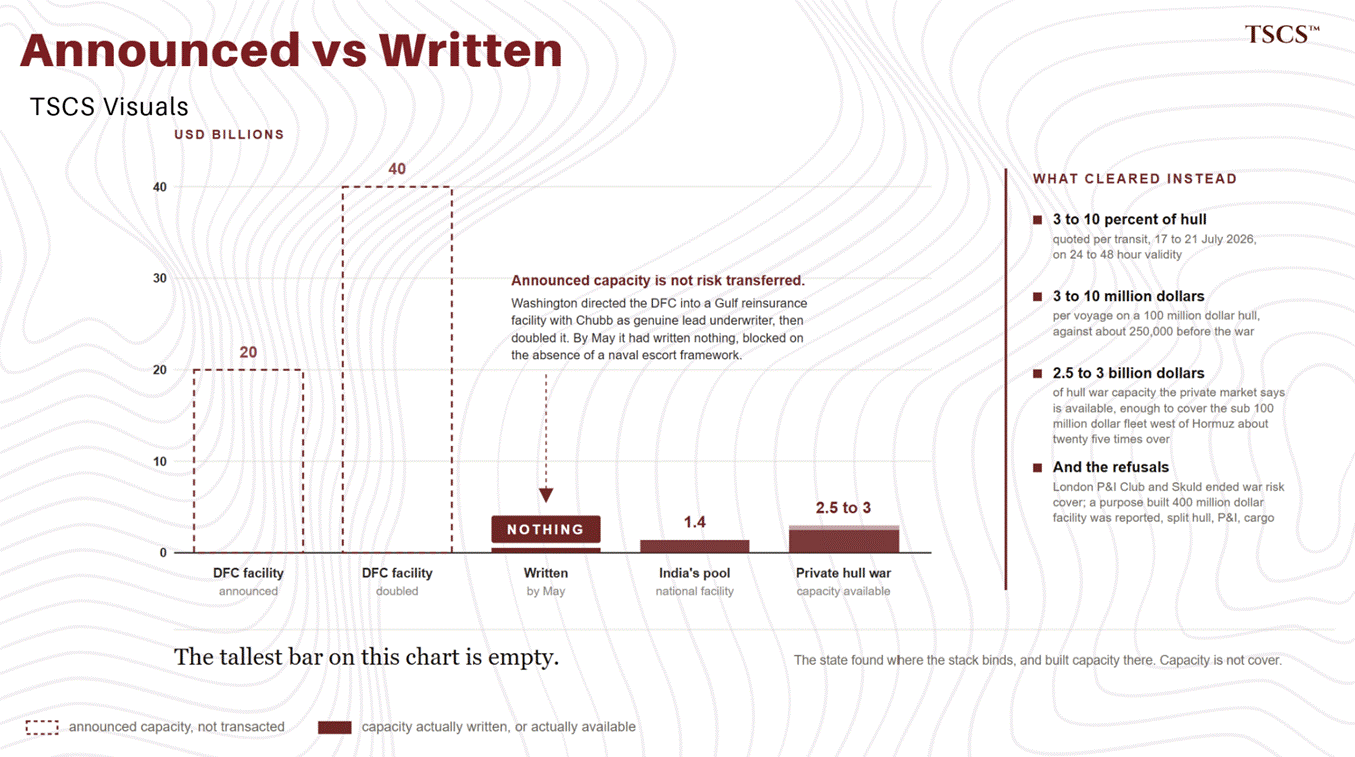
The top of the stack reprices least often and hardest. The Oil Pollution Act of 1990, itself the Valdez’s legislative ghost, made spill liability in US waters functionally existential, certificates of financial responsibility required at the door, and the Erika and Prestige judgments did the European equivalent; onshore, PHMSA writes the safety code that a pipeline rupture converts into franchise risk. The regime works by terror, and mostly it works.
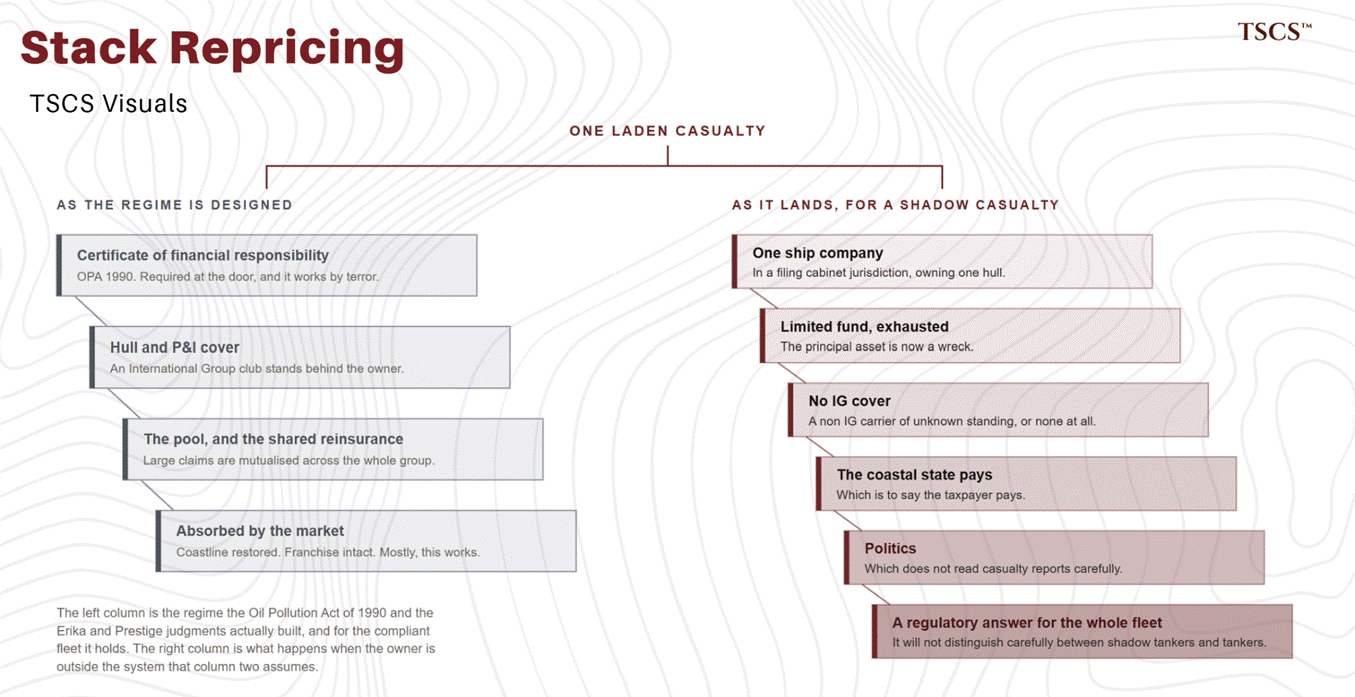
The unpriced exposure is the one this whole part has been building toward. The cleanup bill lands on a one-ship company in a filing-cabinet jurisdiction, which is to say on the coastal state, which is to say on politics, and the political answer will not sort carefully between the dark fleet and everyone else.
Every owner in the compliant fleet is short that headline, and none of them is paid for it.
A five-year-old supertanker now costs more than a brand-new one.
Fearnleys’ current sheet prices a VLCC newbuild at $129 million. Seatrade reported five-year-old tonnage at $138 million in May, and even the conservative print, Breakwave’s “above 120” from March, sits within shouting distance of the yard.
The inversion is not a typo. A newbuild is a promise of a ship in 2029, ordered from yards whose slots Part 4 already told you are sold out, delivering into whatever market that year turns out to be. A five-year-old ship is cash flow this afternoon.
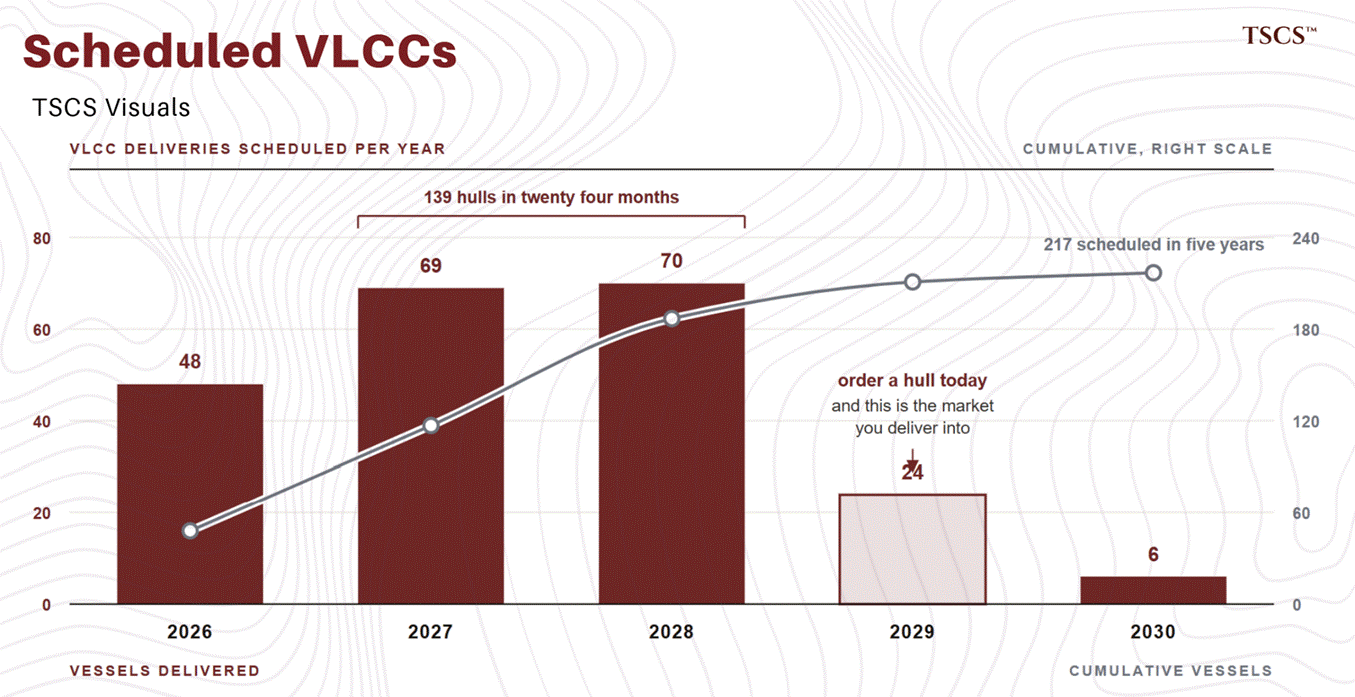
When the present outbids the future by $9 million, the market is stating its belief about the next three years in public, and this part is about how to own some of that belief without being the person who pays the top for it.
The pipes convert contracted capacity into distributions, and the return has three parts: the yield, the modest growth behind it, and the terminal-value question that Part 7’s tariff machinery governs.
The useful discovery in the data as of 23 July is that the market has already sorted the sector for you, and it publishes the sorting as a yield column.
Targa pays about 1.8%, Williams about 2.8%, TC Energy about 5%, Enbridge roughly 6.9% across a currency mismatch, MPLX about 7.6%. Read that spread as the market’s opinion of each name’s reinvestment options: a sub-2% midstream company is a growth stock wearing overalls, a 7.6% one is an income instrument with a terminal-value discount attached. The way to shop the sector is to decide which of those two things you are actually trying to buy.
The safety metrics travel alongside. Coverage runs from MPLX’s 1.3 times through Enterprise’s 1.8 to Williams’ 2.76. Leverage clusters near the sector’s post-trauma religion: Kinder at 3.6 times, MPLX 3.7, Williams around 4.1, Pembina guiding 3.5 to 3.7. Plains promises the low end of its range once the NGL sale closes and it becomes, in its own words, a premier pure-play crude midstream provider. That phrase is doing a lot of marketing for a business Part 2 taught you to read as recontracting risk on a schedule. Where a commonly cited number was not visible in the current disclosures, this part leaves it out rather than backfilling. TC Energy reports roughly 98% of comparable EBITDA from regulated or take-or-pay sources. ONEOK’s widely quoted 90% fee-based figure traces to a September 2025 deck and is flagged stale. Several peers’ equivalents we could not reconfirm this week.
The ships convert spot rates into dividends, and here the 2026 discovery is structural: the listed tanker sector has pre-committed, in writing, to handing you the cycle. Frontline aims to distribute essentially its adjusted profit. DHT pays 100% of ordinary net income. Teekay pays a fixed quarter dollar plus specials while sitting on $996 million of cash and no interest-bearing debt at all. Scorpio pays a dividend, holds net cash, and replenished a $500 million buyback in May. TORM distributes excess liquidity, 58% of profit last quarter. Hafnia runs a sliding scale bolted to its loan-to-value, paying 80% of profit at the current tier. Ardmore adopted two-thirds of adjusted earnings this year. International Seaways runs a variable model whose older 75% framing we could not reconfirm this week. Okeanis pays at the board’s discretion, two dollars last quarter, carrying 41% book leverage as the group’s outlier. Stand back from the list and see what it is: a set of payout algorithms attached to fleet ledgers. The purchase is a formula that converts the cycle into cash, plus a balance sheet that decides whether the formula survives the next trough, and management’s quarterly judgment barely enters it.
And the balance sheets are the part a veteran of the last cycle finds hardest to believe. Teekay unlevered. Scorpio in net cash. International Seaways below 7% loan-to-value. DHT at 16.8% marked to market. The strongest tanker market in a generation is being run, in several boardrooms, with essentially no debt. The sector spent two decades learning its lesson in public and, for now, remembers it. Whether the memory survives the orderbook those same boardrooms just signed is Part 4’s question, and the answer is that nobody knows, which is why the formulas and the leverage, not the earnings, are the things to watch.
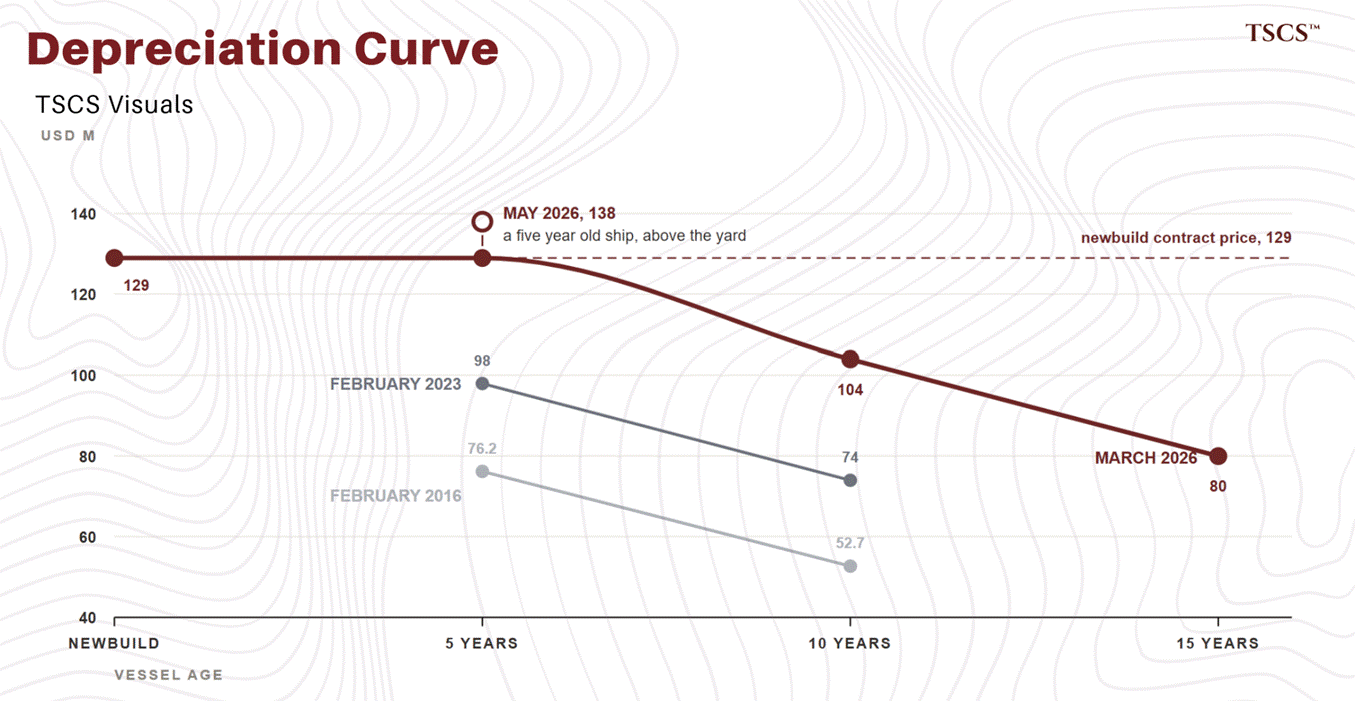
On the number everyone asks for: NAV is the sector’s valuation language.
Hafnia puts its NAV near $4 billion, $8.09 per share. TORM puts its own at $3.04 billion, $29.70 per share, against a share price of $29.48. A product tanker company is trading at the appraised value of its steel, no premium for the platform, the charters or the management, in the middle of a freight boom.
Everything else in the NAV conversation, for every other name, is private marks and paywalled estimates, which is worth knowing in itself: the most quoted number in tanker investing is mostly a number the public cannot check.
Which is why the specialists matter more than the screens here. Edward Finley—Richardson at Misadventures in Shipping publishes his own marks on this universe and shows the working, and where our framework and his conclusions diverge, his inbox beats ours.
Two smaller machines round out the universe. Storage is Part 6’s thinnest caste and stays that way; nothing has changed Vopak and Exolum’s near-monopoly on listedness. And the brokers are the overlooked instrument. Clarksons at 3,795 pence, $1.3 billion of market value, is a toll on shipping activity itself, clipping fixtures whether rates rise or fall. It is the only listed way to own volume rather than price. Its smaller peer could not be verified. The traders, the machine everyone actually wants, remain exactly where Part 6 left them: private, and not coming to a screen near you.
 "{"src":"https://substack-post-media
Comments
Nothing yet. Say the first thing.
Sign in to join the conversation.