
BY DAVID LOHEYDE · PITTSBURGH PA
Part I ended on a claim: the money can come from Pittsburgh or Tokyo, but the approval comes from Tokyo, and Japan’s cost of capital is rising for the first time in thirty-five years.
That’s true as far as it goes, and it’s half the bargain. What I didn’t do was test how much it’s worth against everything else in the decision.
Start with the fact that organizes everything else. Section 232 is a national security trade authority. It directs Commerce to investigate whether imports of a particular article threaten to impair national security, and authorizes the President, following that process, to adjust them. Steel sits under that authority because Commerce and successive presidents determined that it does.
That legal foundation mattered in February. In Learning Resources v. Trump, the Supreme Court held that IEEPA did not authorize tariffs. The principal opinion contrasted that open-ended claim with sector-specific authorities such as Section 232, which expressly contemplate duties and require an article-specific investigation and report. Section 232 was not challenged, and the steel tariffs remained untouched.
Steel still trades as a commodity. But the American market in which it trades has been enclosed as a matter of national security. Hold that, because it’s what makes the arithmetic below come out the way it does.
An integrated mill makes iron before it makes steel. Ore, coke and flux go into the top of a blast furnace; hot air goes in at the bottom; carbon monoxide strips oxygen off the ore and molten iron collects in the hearth. That iron goes to a basic oxygen furnace where oxygen burns the carbon out and turns it into steel.
Three features of that process govern the economics of everything downstream.
It cannot be cycled cheaply. A blast furnace runs a campaign — fifteen to twenty years of continuous operation. Idling one is possible and U.S. Steel has restarted an idled furnace, but banking and restarting carries real cost and risk, and taking one down for good means a reline in the hundreds of millions to bring it back. Gary Works’ blast furnace 14 is the current example: an approved $350 million reline to extend its life another twenty years.
Its operating leverage is punishingly high.Coke ovens, sinter plant, the furnace itself, the BOF shop, the ore yard — that infrastructure runs whether the order book supports it or not. Which produces the cruelest feature of integrated economics: cost per ton rises as volume falls.Demand weakens, you run below capacity, fixed cost spreads across fewer tons, unit cost climbs — precisely when price is falling. The margin gets squeezed from both ends of the same cycle.
Its inputs are a supply chain, not a purchase. Metallurgical coal, coke capacity, iron ore pellets, and the logistics to move all three. Each link is capital-intensive and each has its own price cycle.
Now you can see the 1980 decision clearly. U.S. Steel faced a choice between funding that whole chain into modernity or harvesting it. Harvesting looked rational because the fixed-cost burden made returns look bad in any soft year, and there were a lot of soft years coming. What harvesting doesn’t do is remove the cost. It defers it. Physics runs the campaign clock whether or not anyone budgets for the reline.
That deferred bill is what the $11 billion is now paying.
An electric arc furnace skips the iron-making step. Scrap goes in; three graphite electrodes strike an arc above 3,000°C; the charge melts. Oxygen lances and injected carbon do chemical work that offsets electricity, and foamed slag keeps the arc submerged so heat goes into the bath instead of the sidewalls.
Everything about the cost structure inverts.
It can be idled. Tap-to-tap on a modern furnace is thirty to forty minutes. You can run one heat or none. There is no campaign clock.
A much larger share of its cost moves with production. Specific electricity consumption runs 350 to 550 kWh per ton, which at industrial rates is roughly $35 to $60 a ton — real money, and not the main event. Roughly 70 to 80 percent of the cost of a ton of arc furnace steel is the metallic charge itself.
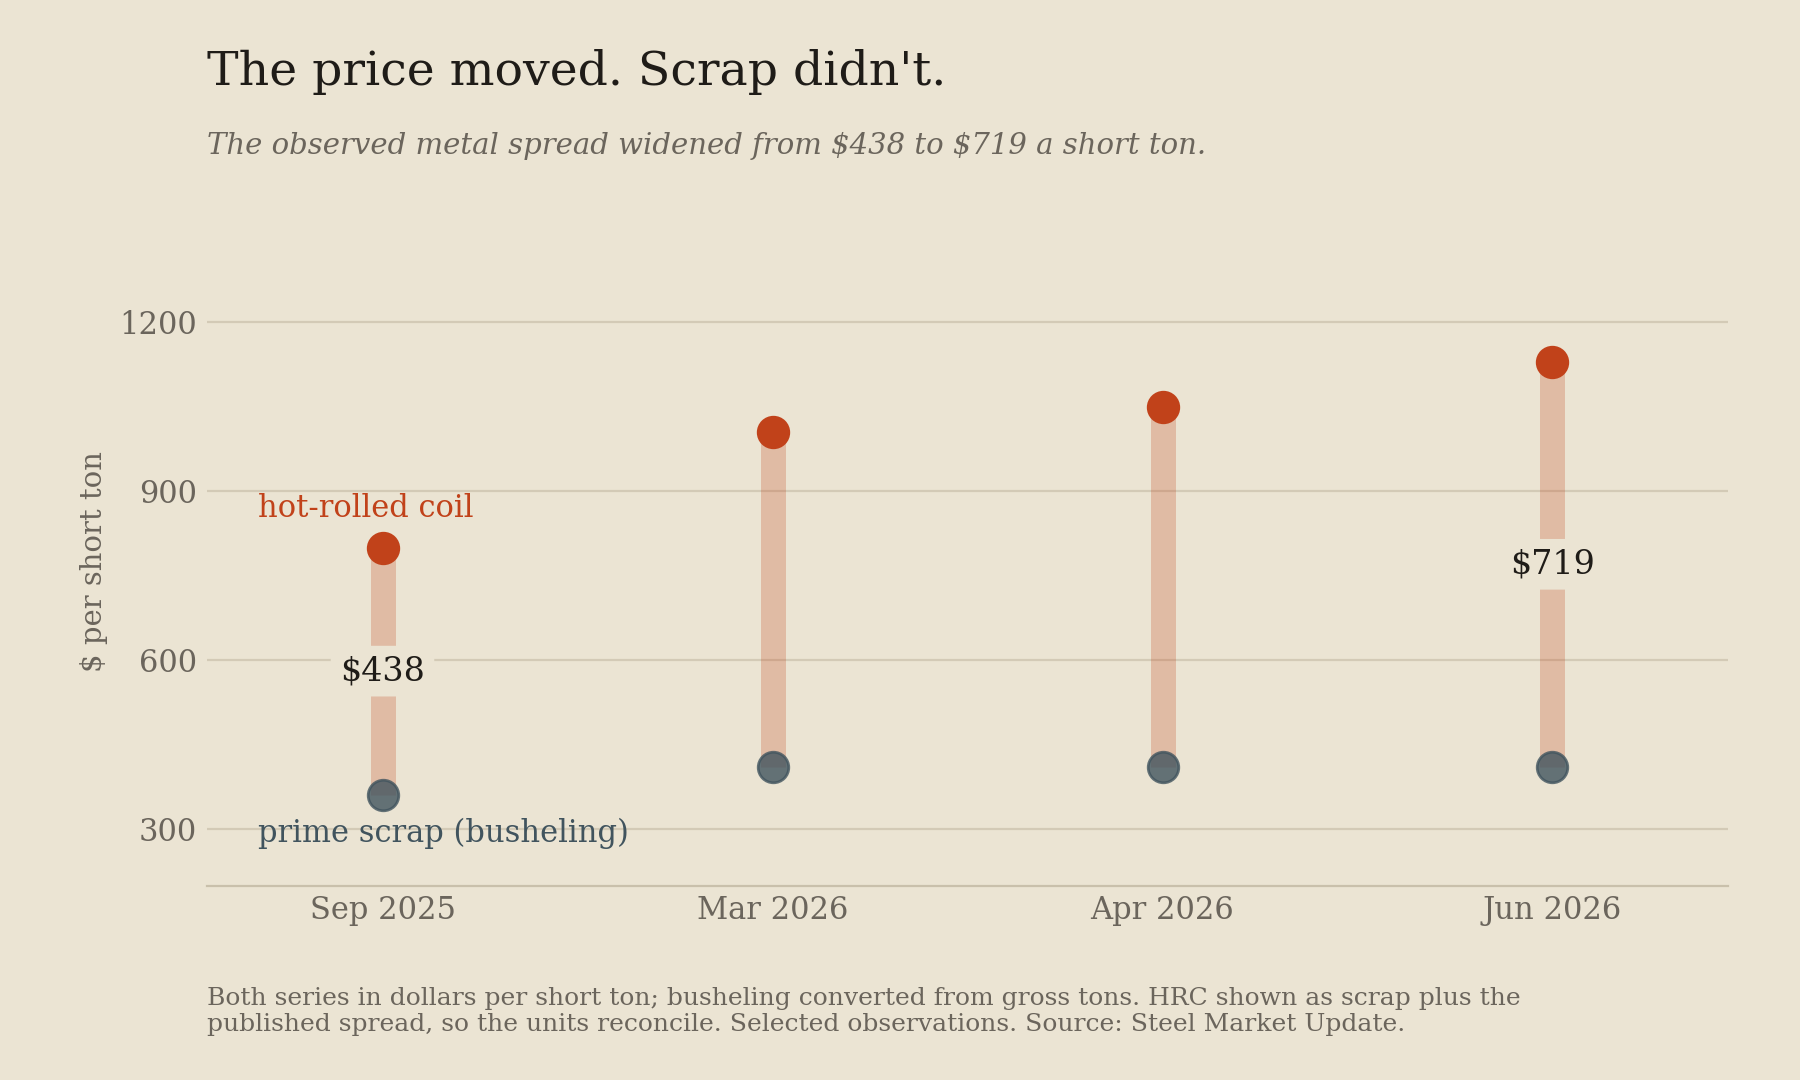
Which collapses its headline margin proxy to a single spread. Hot-rolled coil price minus scrap price. That spread went from $438 a short ton in September 2025 to $719 by June 2026 — while prime scrap sat near $460 a gross ton, about $411 a short ton, from March through June. Flat.
One caveat before anyone maps this onto Braddock. That is the company-wide growth engine, not a direct project margin for Mon Valley. The integrated mill earns against ore, coke and conversion costs; the new strip mill earns through greater throughput — roughly 2.2 million tons rising toward 3.5 — better yield, the elimination of slab movement to Irvin, a richer product mix, and the avoidance of closure. Different economics, same policy umbrella.
How much control does the United States have over the price of its own steel?
A great deal — Europe has substantial protection of its own now, but the American numbers aren’t subtle.
US hot-rolled band: $1,208 a metric tonne in late June
Western Europe: $780
World export market: $490
Section 232 sits at 50 percent and was extended in April 2026 to the full customs value of covered articles. Imports fell 26 percent by volume in the first five months of the year. The Cato Institute’s estimate is that stripping the tariff out would leave American steel roughly $363 a short ton above Italian.
And note where the wedge lands. The tariff applies to covered imported steel articles. It does not apply to scrap in an Arkansas shredder yard. Protection appears first and most visibly in the metal spread. With busheling flat, the observed widening came mechanically from the price of steel. Section 232 helped preserve the price umbrella — though the series alone cannot tell us how much of that $280 a ton policy caused.
Here is where Part I’s framing needs replacing rather than extending, and the replacement uses only figures the company has published.
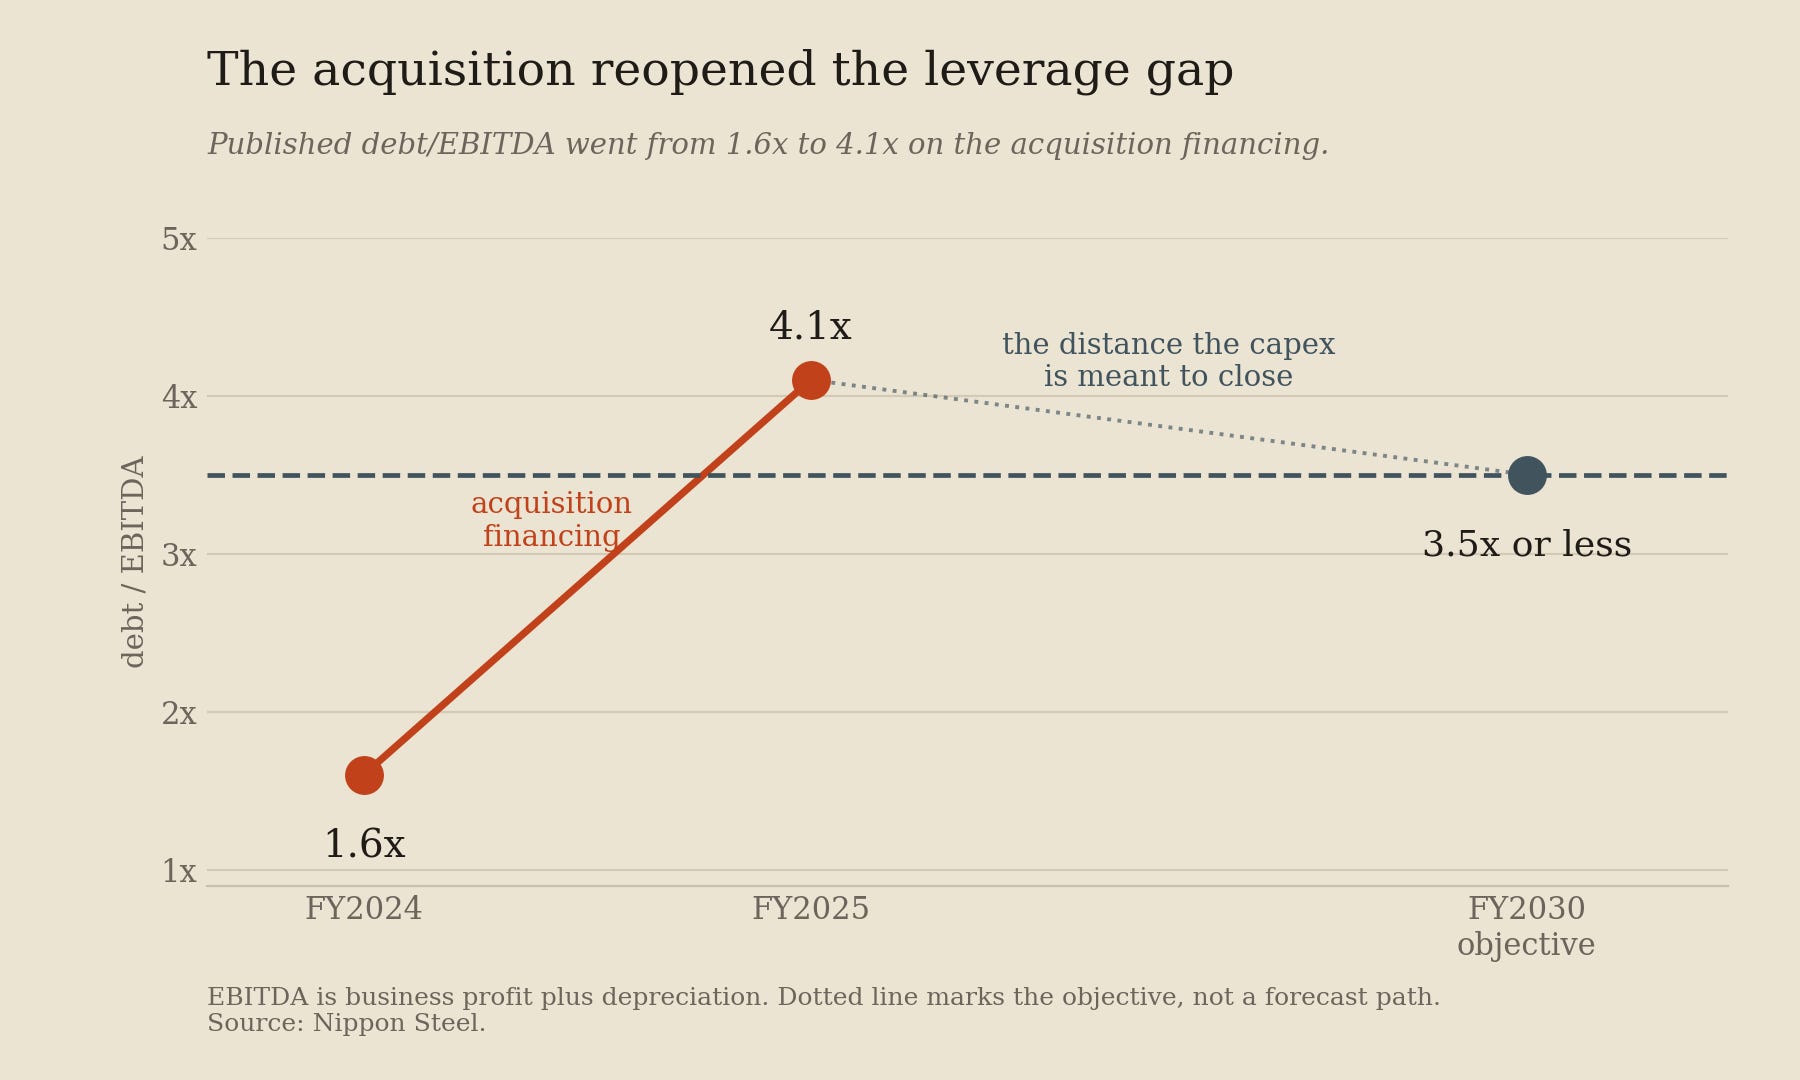
Nippon has told the market it intends to be at a debt/EBITDA ratio of 3.5x or below by FY2030. That’s a public, self-imposed objective, and it’s the kind of number a board actually weighs when it approves a tranche.
Its own published series shows where that stands, and the movement is the point. Debt/EBITDA ran 1.6x in FY2024. After the acquisition financing it printed 4.1x in FY2025. Interest-bearing debt was about ¥5.52 trillion by June 2026, against FY2025 EBITDA of ¥1.088 trillion — business profit plus depreciation — with ¥1.33 trillion forecast for FY2026. Debt-to-equity moved to 0.74 against a target near 0.7.
Two things about that number are worth stating carefully, because it’s easy to over-read.
It is not a covenant and not a present test. It’s a 2030 objective, and the company has said plainly that debt may rise in the interim while investment precedes earnings. A gap between roughly 4x now and 3.5x by FY2030 is the plan working as described, not the plan failing.
And the distance is real. Closing it means either less debt or materially more earnings, and the company has been explicit that the debt side goes the wrong way first.
Which is where the $11 billion sits, and the company is more specific about this than I gave it credit for. The 2030 plan labels the $3 billion explicitly as EBITDA improvement compared to FY2024 — $2.5 billion from capital investment effects, $500 million from synergies, reaching run-rate in 2030.
That matters, because EBITDA is the denominator of the ratio they’ve committed to. The investment isn’t producing some adjacent benefit that happens to help; it’s producing the exact line the leverage target is measured against.
The investment program is central to management’s path back toward 3.5x. The capex worsens the balance sheet before it repairs it. It is also what management expects to produce the earnings that complete the repair. I’d still stop short of adding $3 billion to a denominator and calling the result arithmetic: the timing, the FX, and the base year all move. But the direction is the company’s own.
Which qualifies a claim I made in Part I. Slowing the capex would protect near-term cash. It would also delay the earnings growth management is relying on to repair leverage.
The same constraint explains the instruments, which had puzzled me.
A company sitting above its own long-term leverage objective, in the middle of a multi-year capex program, with earnings expected to arrive after the spending — that company has an incentive to limit conventional senior debt and favor instruments that conserve cash interest, receive partial equity treatment, or preserve a route to eventual conversion.
Which is exactly the observed behavior. Hybrid financing that carries partial equity credit with the agencies. Zero-coupon convertible bonds that eliminate near-term cash interest and preserve a route to equity conversion, even though they remain debt until converted. Cross-shareholdings sold down — more than 80 percent already gone, with the CFO putting further disposals within reach and naming U.S. Steel furnace upgrades as the use.
None of that is distress. The June yen offering was upsized to ¥90 billion on demand. It’s a company working through its cheaper levers in the order a stated target requires.
There’s a currency wrinkle worth noting, because it cuts the opposite way from the usual telling. The structural impact is dollar-denominated and the debt is largely yen. A weaker yen therefore flatters the translated earnings against a yen-denominated balance sheet. The currency cuts both ways — raising the yen cost of dollar capex while increasing the translated value of dollar earnings — and the net depends on timing.
Yes, and it matters through the timing rather than the go/no-go.
Take a mill-scale project at $2.5 billion — roughly the Mon Valley hot strip mill. Four-year construction draw, cash flows starting year five, three-year ramp, twenty-five-year asset life.
What steady-state annual unlevered free cash flow does it need to clear zero NPV?
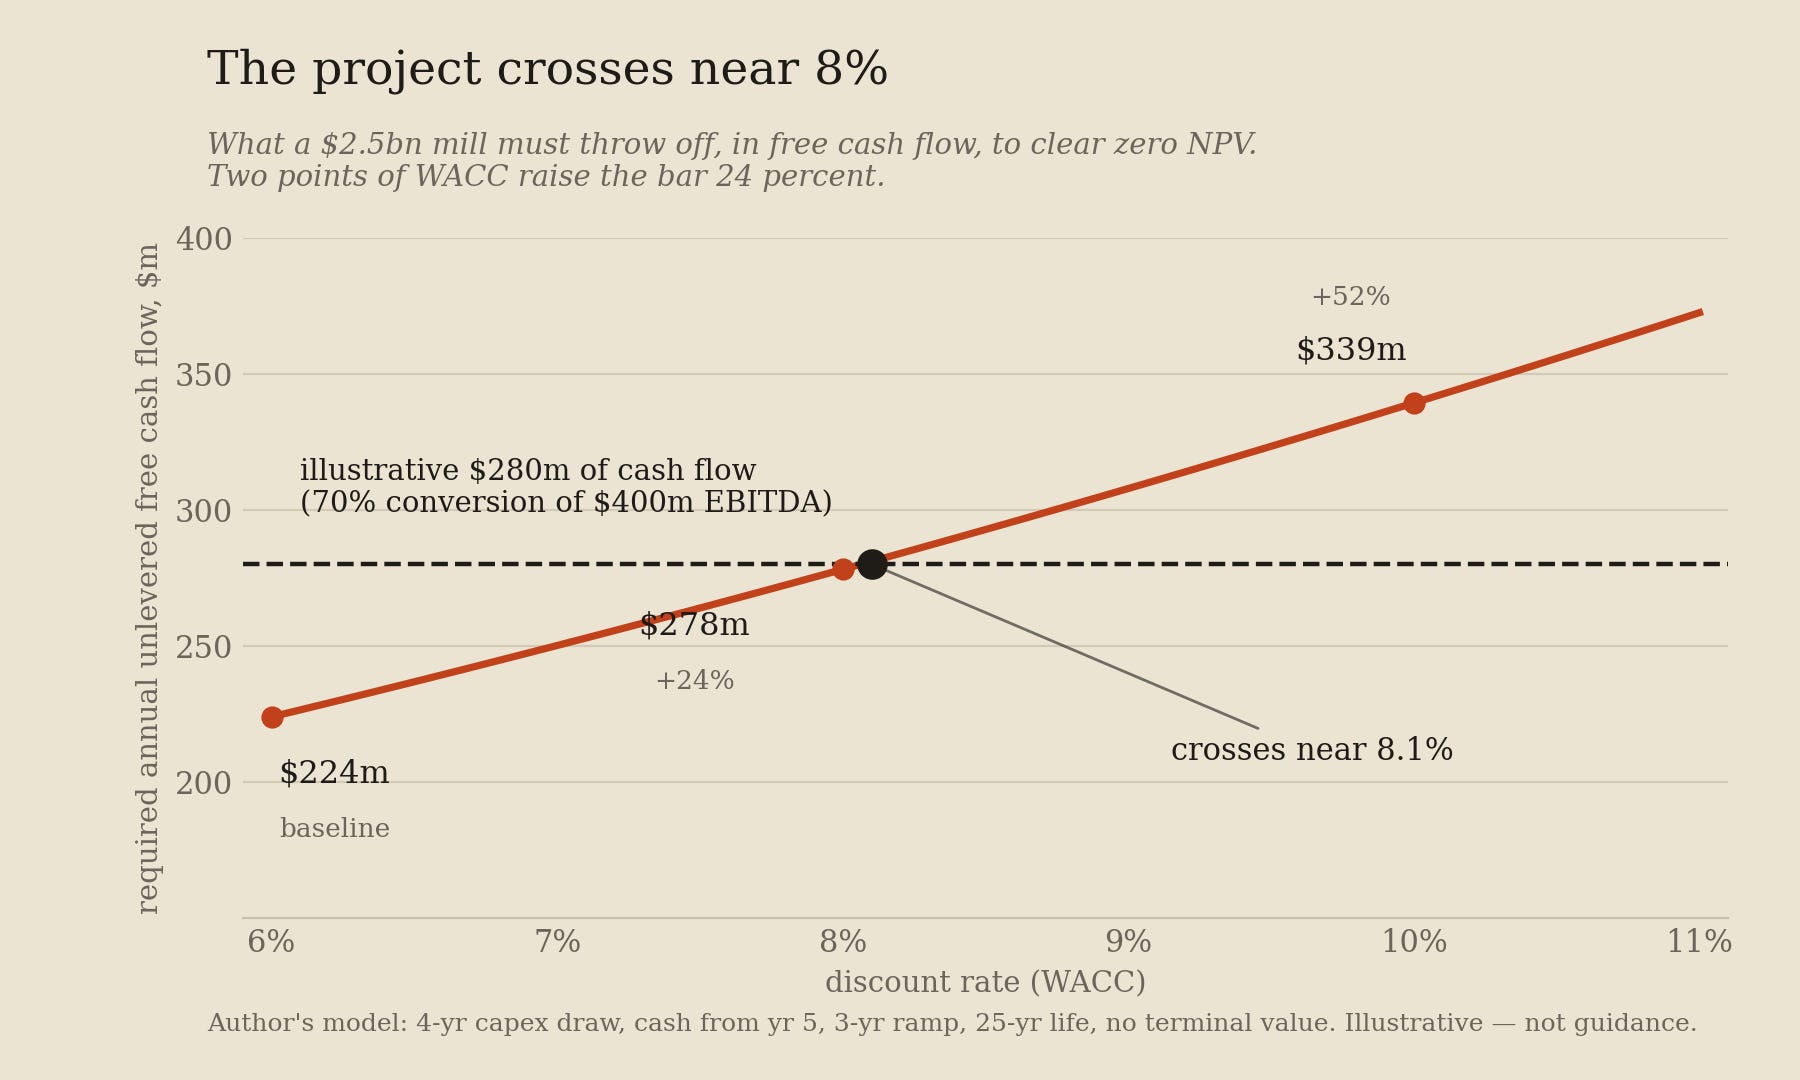
Note the units. That’s free cash flow, not EBITDA, and the distinction is the whole game on a project like this — EBITDA recovers years before cash does, while you’re still paying for construction, taxes, sustaining capex and working capital.
Put a plausible conversion on it. A project throwing off $400 million of steady-state EBITDA, converting at 70 percent to unlevered free cash flow, is worth roughly $539 million at 6 percent, about breakeven at 8, and solidly negative at 10.
So the discount rate can swap a marginal project. Not because these assets are weak, but because the cash arrives so late that its present value is unusually sensitive to what you charge for waiting.
But scale it against the policy variable. Two hundred basis points raises the project’s required annual cash flow by $54 million — about $15 a ton at full throughput. The policy-supported domestic price umbrella is measured in hundreds per ton. The tariff need not explain all of that difference, and U.S. Steel need not capture all of it. A small fraction would be enough to offset the modeled penalty from a two-point increase in WACC.
That’s the honest ordering. Trade policy dominates the operating upside. The cost of capital governs whether the position can be held long enough to collect it, and how fast marginal tranches clear.
Smith’s hand was invisible because no single actor directed it. This one is visible because the state does.
Section 232 at fifty percent, extended in April to full customs value. A golden share with veto rights over closures and the movement of production. A national security agreement specifying where the headquarters sits and who may sit on the board. An $11 billion commitment made enforceable as a condition of approval rather than left to ordinary business discretion.
The hand is visible. It’s wearing a glove, and the glove has a name on it.
Readers of this letter will know where I’m going.
For eleven years Andrew Mellon ran the Treasury under three presidents, and the line that circulated about him — half admiration, half accusation — was that the three had served under him. It wasn’t entirely unfair. Harding died, Coolidge governed by absence, Hoover was an engineer with theories. Mellon was there the whole time and knew where every number came from.
The temptation is to see another Mellon in Bessent, and it should be resisted at least partway. Treasury’s part of this architecture falls within Bessent’s institutional remit: CFIUS, the national security agreement, currency intervention, the FIMA push. But the architecture is wider than one department. Commerce administers Section 232 and supplied the recommendations behind the 2026 structure. The Fed controls FIMA. The President decides both the tariff and the transaction.
The parallel survives at one point, which happens to be the important one. Delegated authority remains delegated.
Mellon’s authority was revocable. In 1932, when Hoover needed distance from the Depression, Mellon was moved to the Court of St. James’s and then pursued over his taxes. Eleven years of being the most powerful man in Washington ended in an afternoon, because the power was never his. It was lent.
The same structure holds now. Commerce can build the statutory case and recommend an adjustment. Treasury can negotiate the financial and national security architecture around the transaction. The President retains decisive authority over the tariff and exercises the government’s golden-share rights — and has to be satisfactorily convinced, every time, including the times when the political value of the tariff has changed.
Which puts the risk in two places rather than one, and Part I only found the second.
Washington creates the return. The tariff establishes a domestic price umbrella that materially improves the spread. Remove enough of that umbrella and projects stop clearing even at cheap capital — and, more to the point of Part Four, the earnings that close the leverage gap never arrive.
Tokyo finances the wait. Construction cash leaves years before the incremental project cash returns, and strategic capex runs into billions annually. Something has to carry the gap between reported earnings recovering and cash actually generating, and that something is a parent balance sheet already above its stated long-term leverage objective.
Part I located the decision in Tokyo. That was incomplete rather than wrong. The rebuild requires both governments’ choices to outlast the construction schedule — a price umbrella maintained in Washington, and patience maintained in a Japanese boardroom, for roughly a decade.
And notice how tightly the two are now coupled. The tariff supports the spread. The spread produces the earnings. The earnings are what carry Nippon back toward 3.5x. A company sitting above its own stated leverage objective, mid-program, is a company whose path back to that objective runs directly through American trade policy.
Neither leg is guaranteed, and they can fail independently.
Blast furnaces run on twenty-year campaigns. Presidents run on four-year terms. Section 232 expires with neither — it stands until modified — but its rate, its scope and its exemptions all move by proclamation. Nobody has to repeal the architecture. A president only has to alter the price umbrella enough to change the economics.
Mellon’s system lasted eleven years and ended the week it became inconvenient. That’s not an argument against building. It’s an argument for knowing exactly what the building is standing on.
Method note: leverage figures are Nippon Steel’s own published series — debt/EBITDA of 1.6x in FY2024 and 4.1x in FY2025, a debt-to-equity ratio of 0.74 against a target near 0.7, and a stated objective of 3.5x or below by FY2030. Interest-bearing debt of roughly ¥5.52tn at June 2026; EBITDA of ¥1.088tn FY2025 with ¥1.33tn forecast for FY2026. I have not reproduced the company’s numerator adjustments, so gross debt divided by the target ratio will not reconcile to the published figure. The $3bn is the company’s stated EBITDA improvement versus FY2024 — $2.5bn from capital investment effects and $500m from synergies, at run-rate in 2030. The project sensitivity assumes a $2.5bn capex drawn 15/30/35/20 over four years, unlevered free cash flow beginning in year five, a 50/80/100 percent ramp, a 25-year operating life, and no terminal value; the $400m EBITDA case and 70 percent conversion rate are illustrative sensitivities, not management guidance. EAF operating ranges are published industry benchmarks. Prices as of mid-2026 and subject to the cycle. S&P currently rates Nippon BBB with a negative outlook, explicitly citing heavy investment and delayed deleveraging — consistent with treating 3.5x as a 2030 repair objective rather than a near-term base case.
No posts
Comments
Nothing yet. Say the first thing.
Sign in to join the conversation.