
Happy Thursday! Every fund pitches LPs on a 3-5x target, and plenty talk about getting to 10x. But as PitchBook's Kyle Stanford put it earlier this month, the current venture recovery is "all IRR, no DPI." Today we're pulling apart the actual math behind fund targets like these using data from Correlation Ventures, Commonfund, AngelList, and Value Add VC, deal by deal and fund by fund, to show what it really takes to get there, and why paper gains and real cash are telling two very different stories right now. More on that below.
AngelList - As VC firms scale their institutional LP base, finance is no longer just back-office hygiene—it’s a strategic advantage. AngelList’s fund admin operates like an outsourced COO, streamlining operations, meeting institutional diligence standards, and delivering timely, accurate reporting. See why 25k funds and syndicates trust AngelList.
Pliancy - Experience the freedom of IT that just works. Partnering with Pliancy means regaining the time & energy to focus on your mission—without having to worry about the day-to-day tech that makes it possible. Discover why VC firms from coast to coast choose Pliancy (or ask about us in VCBC).
Standard Metrics - Structured portfolio data and LLMs are enabling VC firms to automate portfolio reporting, from tear sheets to valuation memos. Explore 17 workflows that modern fund teams are automating with AI.
Airstream Alpha CFO - Modern CFO support for venture funds and investment firms. With 50+ CFO mandates, Airstream Alpha brings structured, tech-forward oversight and guidance to fund finance, from reporting and compliance to service-provider coordination, so partners stay focused on investing and LP relationships. Learn how funds work with Airstream Alpha from first close through scale.
Before a fund can return 5x or 10x, every individual check inside it has to clear a filter that’s brutal by design, and the market has been chasing the wrong end of it.
What the data shows:
Correlation Ventures’ latest analysis found just 92 companies accounted for over half of all profits realized in US venture over the past decade.
The same analysis found capital invested at $100M+ valuations, traditionally “growth” rather than early-stage venture, has grown to 81% of all US venture dollars last year, up from almost nothing in 2006, and the share at $1B+ valuations has gone from near zero to over half. But those larger, later checks generated average returns below the industry average.
Early-stage investments (sub-$50M pre-money valuations) still delivered the highest average returns: $150B invested at those valuations returned $416B (2.8x), even as capital keeps shifting toward bigger, later checks.
AngelList’s platform data found a similarly shaped filter at the deal level: roughly 10% of deals returned 10x or more, and up to the 90th percentile, early-stage investments net out close to zero on their own.
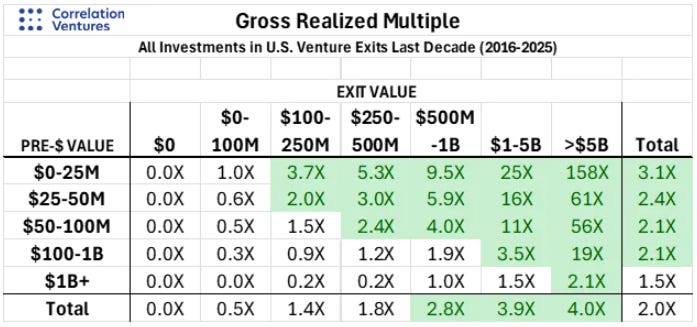
What this means for you: a fund's return comes almost entirely from landing one rare winner, not the average bet. The industry's been piling into larger, later checks that actually underperform, while early-stage deals still drive most of the return. The decile that matters skews earlier than the headlines suggest.
The deal-level filter above explains why fund-level outcomes are even more concentrated than they look, and current data shows that concentration is accelerating, not holding steady.
What the data shows:
Commonfund’s analysis found that since 2023, the top 1% of venture-backed companies have captured 80% of total US exit value (45% excluding SpaceX’s $1.77T IPO alone), up from 34% in 2017-2022 and just 17% in 2005-2010. Commonfund attributes the steepening curve partly to AI.
That’s not a new dynamic, just a steeper one. Horsley Bridge, a fund-of-funds that has backed venture managers since the 1980s, reviewed roughly 7,000 investments made between 1985 and 2014, per Sebastian Mallaby’s The Power Law. Every single fund in that historical dataset that returned 3x or more had at least one investment that returned 10x or more. No exceptions.
About 6% of the deals in Horsley Bridge’s dataset produced roughly 60% of the total returns, the same extreme skew Commonfund’s current data shows getting more pronounced, not less.
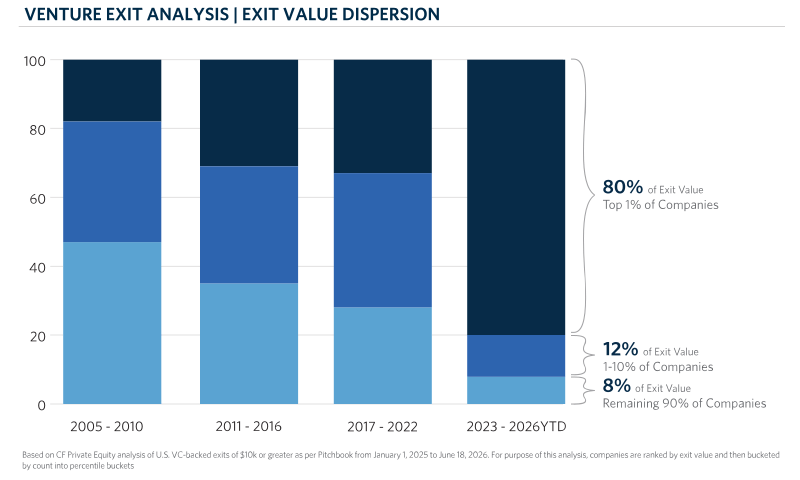
What this means for you: protect ownership in your winners rather than spreading reserves evenly. A GP isn't managing 20-25 independent bets, they're managing one likely outlier and 19-24 seats at the table, and that outlier is capturing a bigger share of the pie than it used to.
It’s worth checking that filter against what funds are actually delivering today.
What the data shows:
PitchBook’s Q2 2026 US VC Fundraising & Returns report found the average DPI for 2021-vintage funds is just 0.05x, the lowest five-year DPI multiple this century. The one-year horizon IRR looks strong at 17.1%, but that reflects rising valuations, not cash actually returned. Net cash flow to LPs has run negative $202 billion since 2022.
A separate analysis from Value Add VC puts the same 2021 cohort’s DPI at 0.08x five years in, and finds annual distributions industry-wide have been stuck at roughly 15% of NAV since late 2022, versus a 26% ten-year average.
Carta’s Q1 2026 data shows the same divide from a different angle: across nearly every vintage from 2017 through 2024, the 90th percentile for net IRR tops 20%, while the 75th percentile doesn’t break 15.5% in any of them. Even top-quartile is a different world from top-decile.
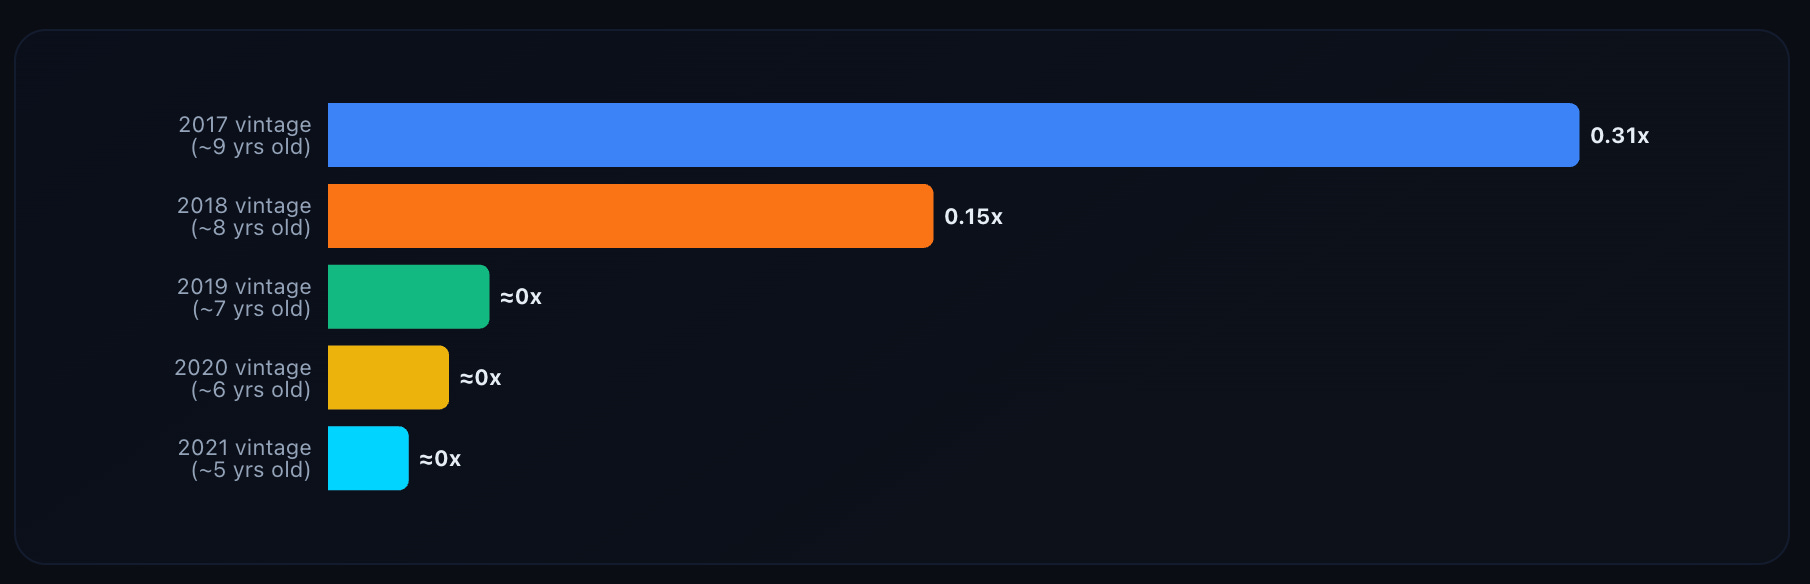
What this means for you: the recovery in headlines, valuations, IRR, deal volume, is real, but it's a paper recovery. Cash back to LPs is running at close to half its historical rate, and outperforming funds are landing in the top decile, not just beating the median. That's why DPI, not IRR or TVPI, is now the first thing LPs check before re-upping. If a deck says 'we're targeting 5x,' ask whether that's above what even the best funds have delivered in cash.
Put the deal-level and fund-level math together and the honest answer is more complicated than “just concentrate harder.”
What the data shows:
AngelList tested this directly. They simulated thousands of 10-investment portfolios, roughly what a “pick your best 7-10 bets” strategy looks like, drawn from their platform’s return data. A fully diversified market portfolio (an equal-sized check into every available deal) outperformed about 74-78% of those concentrated portfolios, even before fees.
In other words, guessing which handful of deals will be the winners is genuinely hard to do better than the broad market, because the power law’s extreme outliers are difficult to predict in advance.
That doesn’t contradict Horsley Bridge’s finding, it sharpens it: every high-performing fund needed a 10x+ deal, but concentration alone doesn’t guarantee landing one.
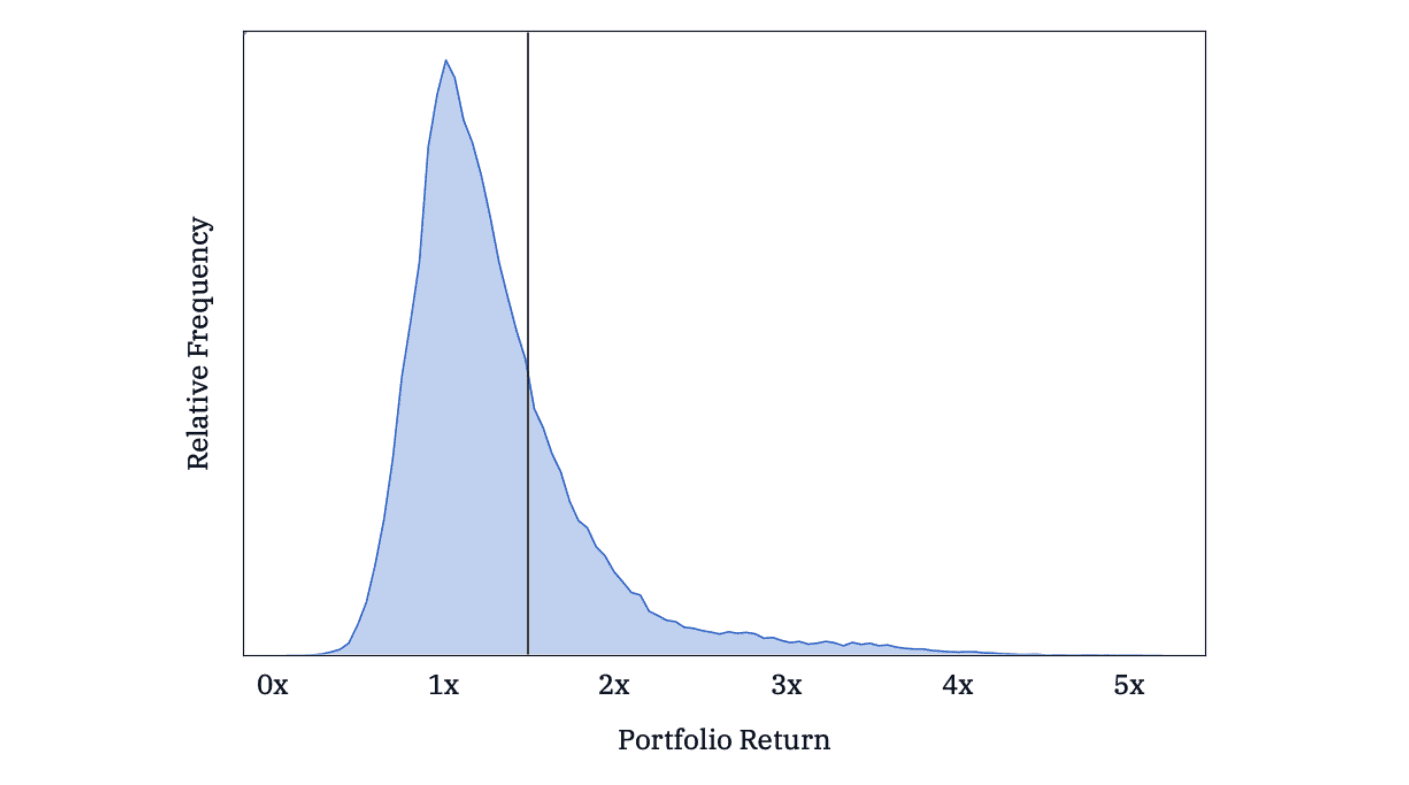
What this means for you: the lesson isn't 'make fewer, bigger bets and hope.' It's 'get enough access to deal flow that includes the top decile, then protect that position with reserves and ownership discipline.' Access and follow-on capacity do what conviction alone can't.
Everything above is an industry benchmark. The number that actually matters is where your own fund lands against it.
What this looks like in practice:
The VC Fund Model lets you run your fund’s actual check sizes, ownership targets, and reserve strategy against 3x, 5x, and 10x outcomes, instead of relying on industry averages.
It shows how many top-decile winners your current portfolio construction realistically needs to hit your target multiple, given your fund size and number of positions.
You can stress-test reserve allocation against the same power-law assumptions used in this issue, so you can see the real tradeoff between spreading capital and protecting ownership in your winners.
Get the VC Fund Model: if the math in this issue made you want to check your own fund’s odds rather than just the industry’s, this is built for exactly that.
Just 92 companies captured over half of all US venture profits realized in the past decade, and the industry has been chasing bigger, later checks that actually underperform early-stage deals on average, per Correlation Ventures.
The top 1% of companies now capture 80% of exit value, up from 34% a few years ago, per Commonfund, and every fund that hit 3x or more in the historical Horsley Bridge dataset had at least one 10x+ deal. No exceptions.
2021-vintage funds have returned just 0.05-0.08x DPI five years in, per PitchBook and Value Add VC, the lowest five-year mark this century, even as one-year IRR looks strong at 17.1%.
Fund returns are decided by access to the top decile of deals, not by spreading capital evenly across more of them.
Bottom Line: The math behind 5x and 10x funds isn’t really about hitting a return multiple, it’s about getting enough real shots at the top decile of outcomes and having the discipline to back them once you find them. Everything else, from check size to reserves to ownership targets, is downstream of that one constraint.
VC Fund Model - model the exact math behind this issue’s power-law odds: how many top-decile winners your fund actually needs to hit 3x, 5x, or 10x, and what your reserve strategy does to those odds.
Capital Call Forecast - plan capital calls around the follow-on reserves this issue’s power-law math says you’ll actually need, not a flat drawdown schedule.
VC Fund Budget - build the operating budget that actually supports a reserve-heavy, ownership-first strategy instead of working against it.
Comments
Nothing yet. Say the first thing.
Sign in to join the conversation.