
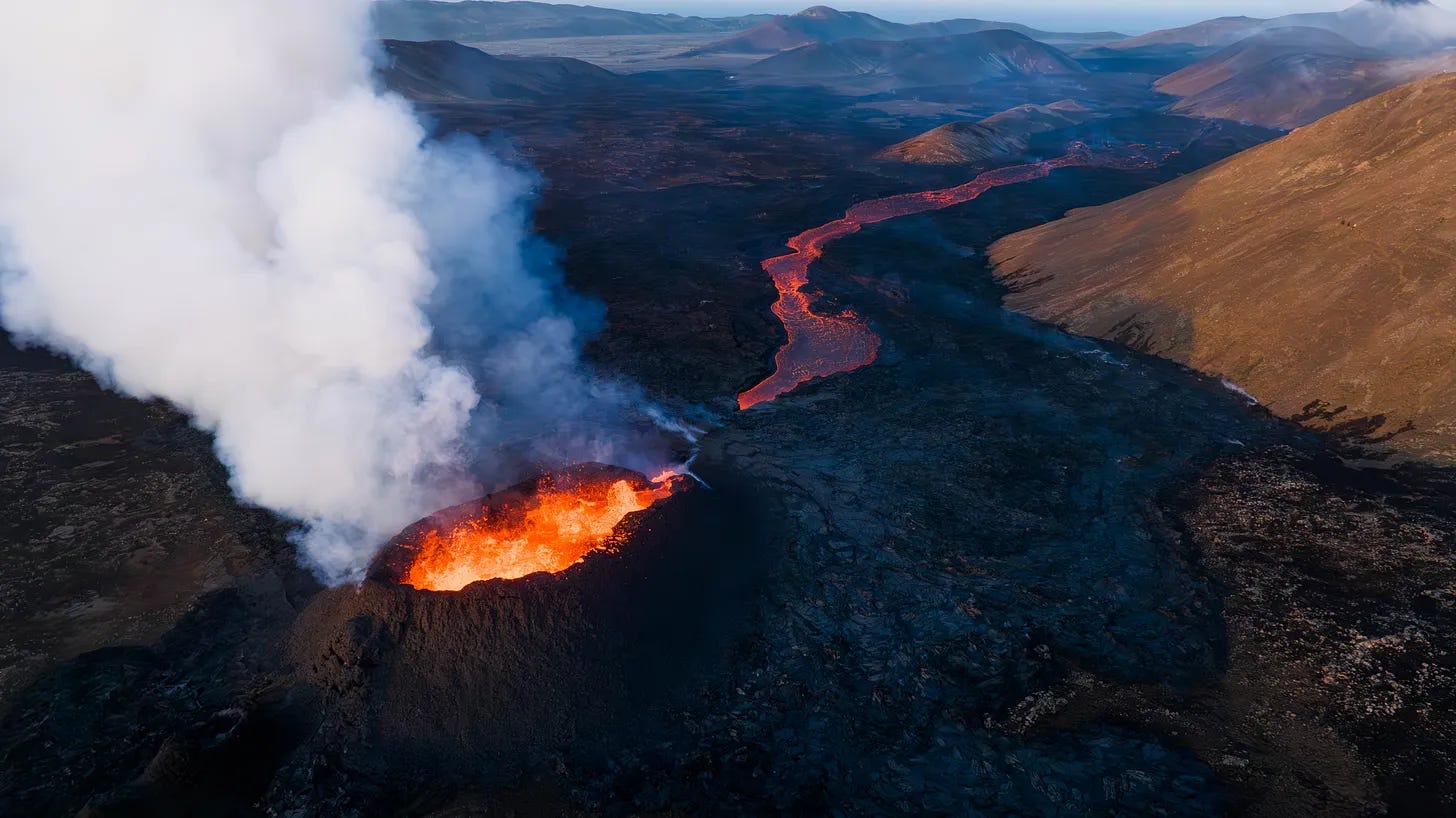
In June of 1783, a fissure broke open in southern Iceland and didn’t stop erupting for eight months. Accounts from the time describe what followed: sulfurous rain, dark ash falling on homes, people with irritated eyes and skin from the particulate matter, and animals getting sick and dying across the contaminated landscape just two weeks after the eruption. That was an ominous signal of a grim future for the dairy economy Icelanders relied on so heavily to feed their population.
Our most detailed mortality evidence for the crisis that arose from the Laki eruption comes from parish burial registers kept by parish priests across Iceland, though no surviving register was available for Skaftafellssýsla, the county that’s home to the Laki fissure. Despite the local gap in parish registers, we still have county-level deaths and population estimates for the whole island, farm abandonment data, official documents from the time and contemporary narratives, and parish burial registers that often note that the dead had come into the area from somewhere else. Sixty-one farms and cottages were abandoned in total: 42 after direct physical damage from lava flows, flooding from dammed rivers, volcanic rockfall, or windblown volcanic sand; another 19 for other reasons, including livestock loss. The physical destruction and subsequent mortality event had different geographic distributions, with the earliest and worst mortality appearing in the northeast of the island, far from the fissure itself. To explain that mismatch, we have to look at the food system that Laki disrupted.
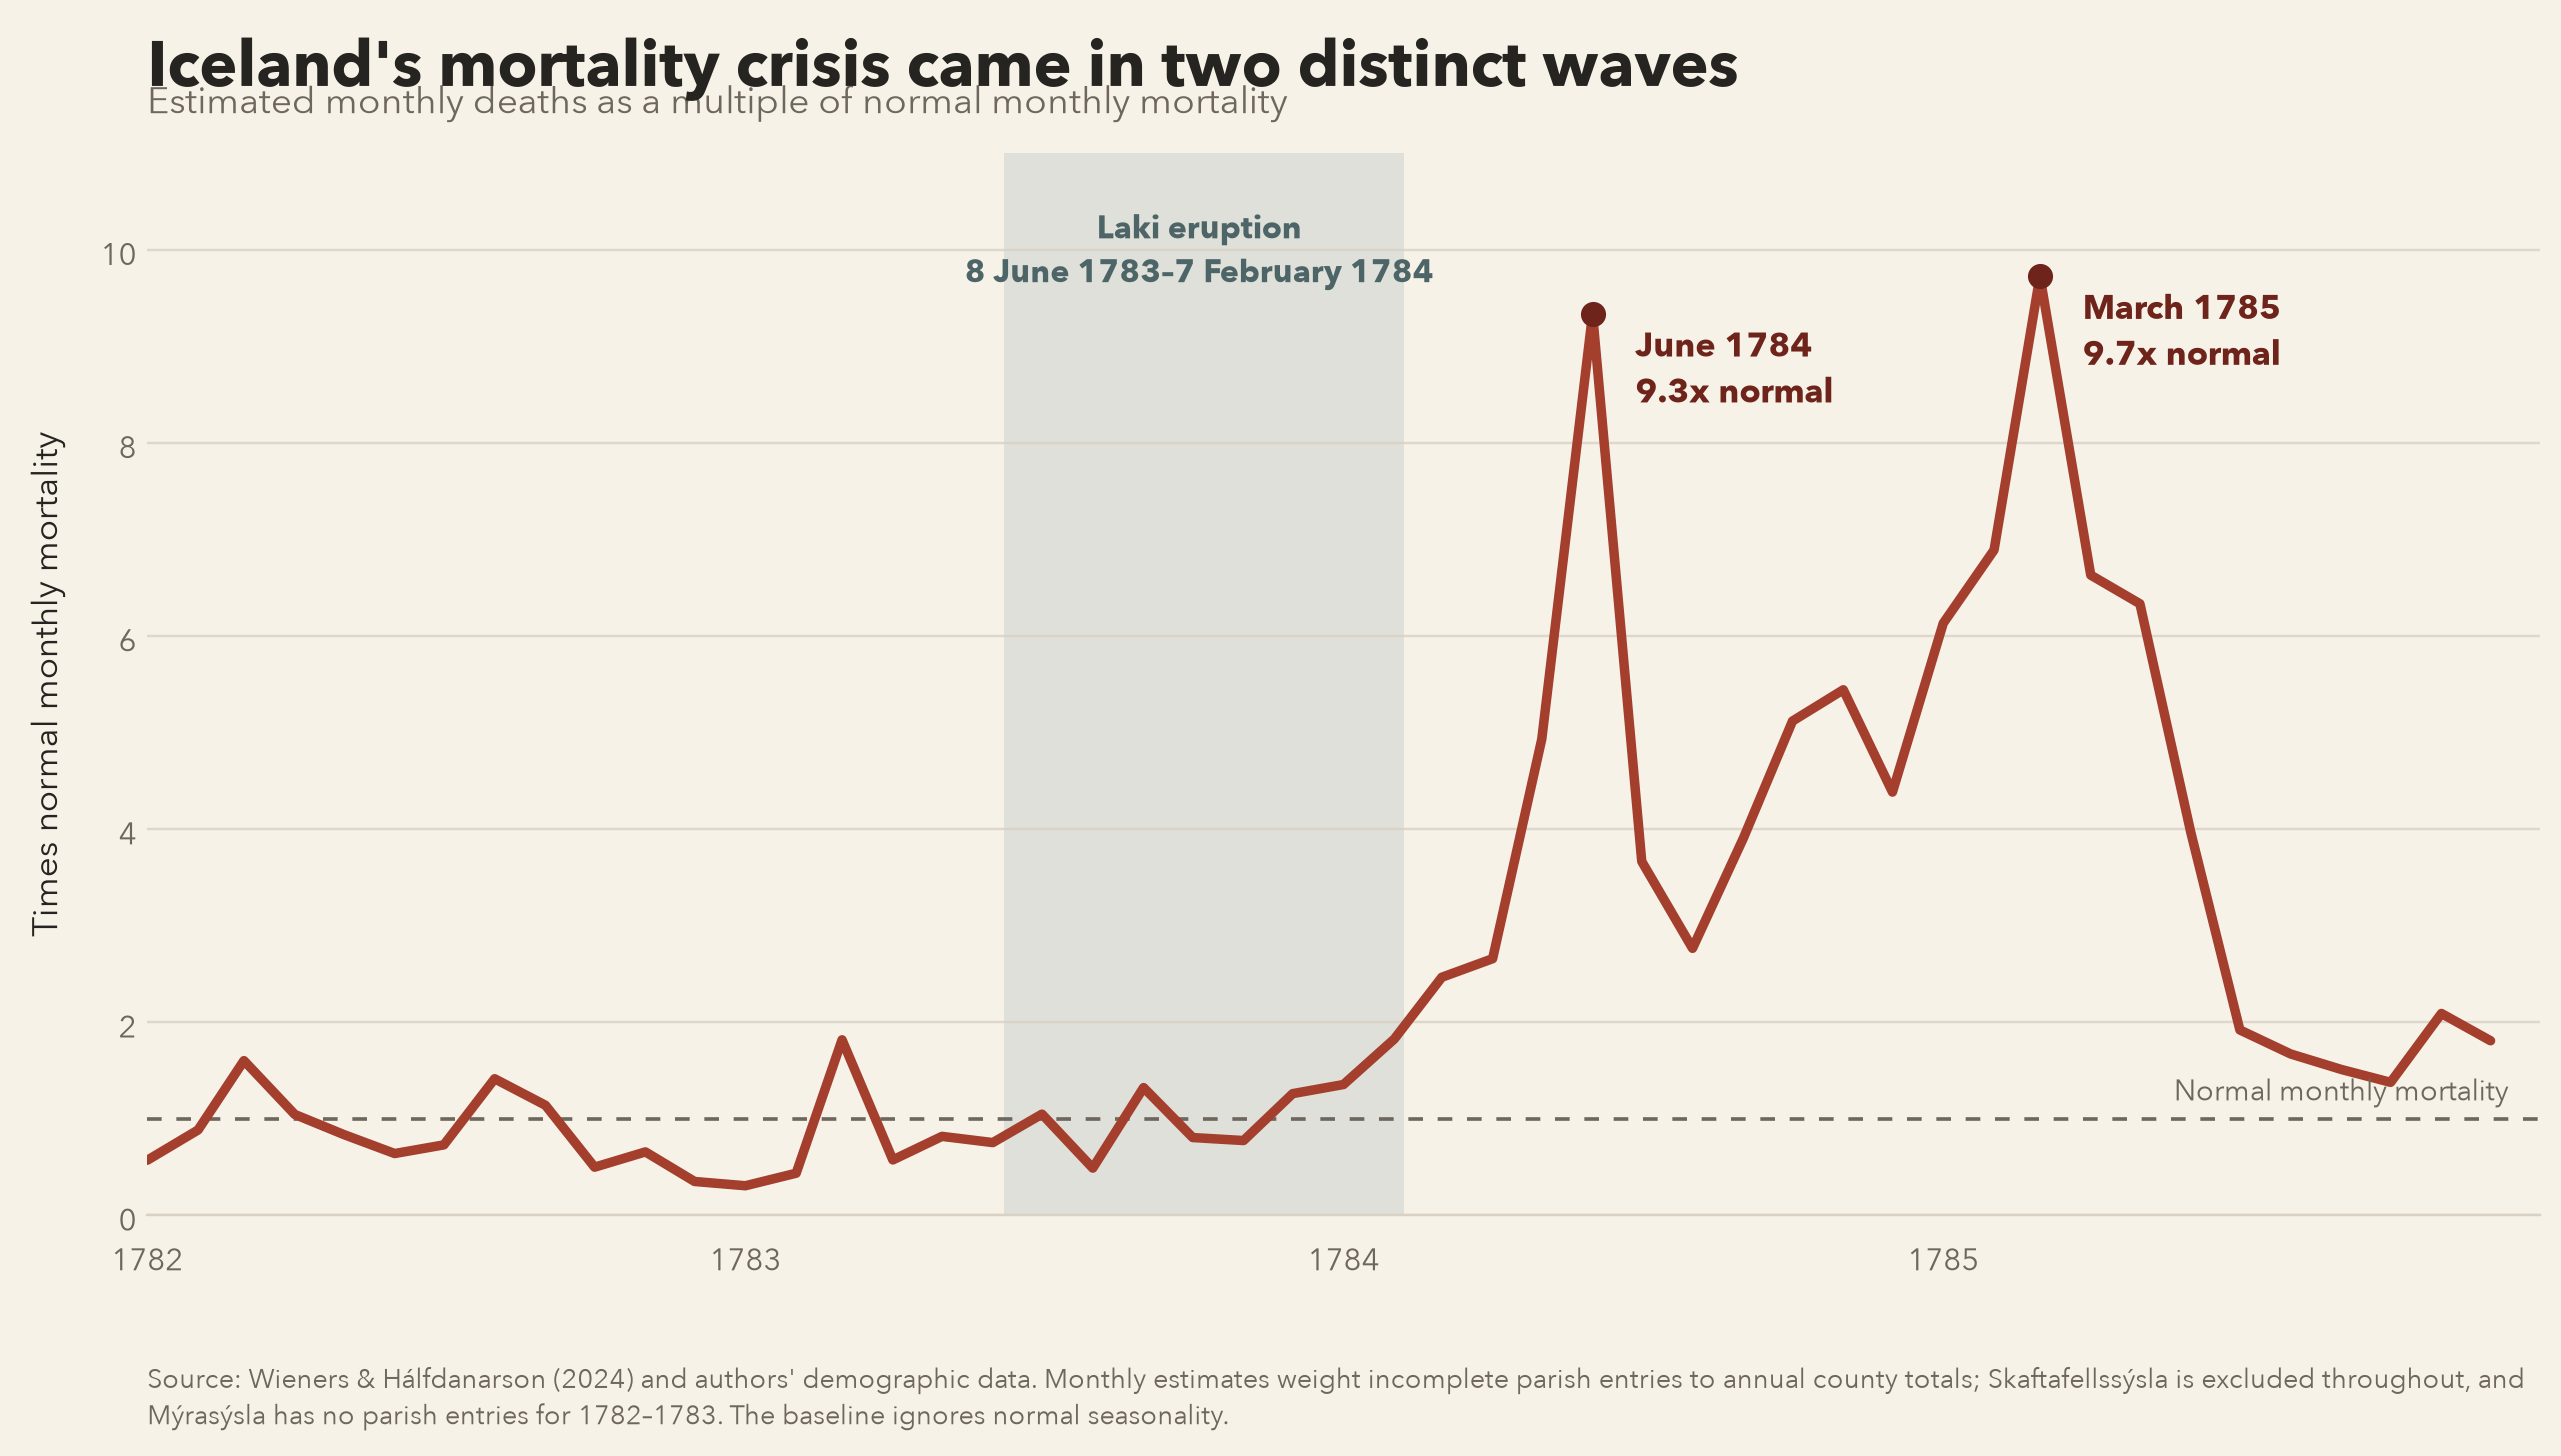
At the start of 1783, Iceland had a population of 49,609 and recorded roughly 1,500 deaths per year and 1,375 births. National totals from the years surrounding the eruption show that the severe mortality event didn’t start until 1784, with 1,231 deaths recorded in 1782, followed by 1,227 in 1783 before surging to 5,429 and 5,649 in the crisis years. By the beginning of 1786, Iceland’s population had fallen to just over 40,000, while excess deaths in 1784–85 totaled about 8,000, roughly one-sixth of the pre-eruption population. More than 11,000 people died when the expected toll would’ve been just over 3,000. The death toll was still slightly elevated in 1786 at 2,128, in part because of a smallpox epidemic starting late in 1785 (the 2024 paper by Wieners and Halfdanarson treats that as separate from Laki and shouldn’t be brought into the popular ‘one in six’ statistic). Reported births fell from 1,375 in 1783 to 1,100 in 1784, then to 604 in 1785. There was a partial recovery in 1786 with 925 births counted. That timeline narrows the plausible explanations for the mortality increase, as deaths rose the year after the eruption, after food production and shipping had been disrupted. Even those downstream effects were uneven across the island.
Those numbers come from annual vital statistics gathered by parish priests, who would send the counts of reported births and deaths to higher authorities in Iceland. Those officials would then compile the numbers into county-level tables that could give a national and county-level count of how many people were born and died in a specific year. As yearly totals, they don’t indicate exactly what month a specific crisis started or contain individual data such as cause of death or a migrant’s region of birth. Those details appear only in the separate parish registers, and not uniformly: priests recorded them when they thought it helpful, since person-level records weren’t standardized at the time.
Most of the surviving parish registers leave us with burial dates, names, sex, age, household/social position, and occasionally a cause of death or migrant’s reported location of origin as stated by the priest. Nearly 5,000 parish burial records survived from 1782 to 1787 – clearly far from a national register based on the previous numbers – with them covering about a third of the deaths in those annual totals. Those two sources were built to do different jobs though, with annual county totals establishing a scale of mortality for the country and the parish registers showing the timing of those events and providing a partial description of those who died. The annual system was compared to the county parish burials to obtain a county-level estimate for a specific cause of death. For example, if a parish recorded a third of the county’s annual deaths from hunger, with 10 being counted, they would assume there were actually 30 deaths from hunger. It’s a method that assumes the surviving parish entries would reasonably represent the missing entries from that same county and year. Those records are where we can see peaks in the monthly mortality rates around June of 1784 and in March of the following year.
Variable mortality in Iceland after Laki
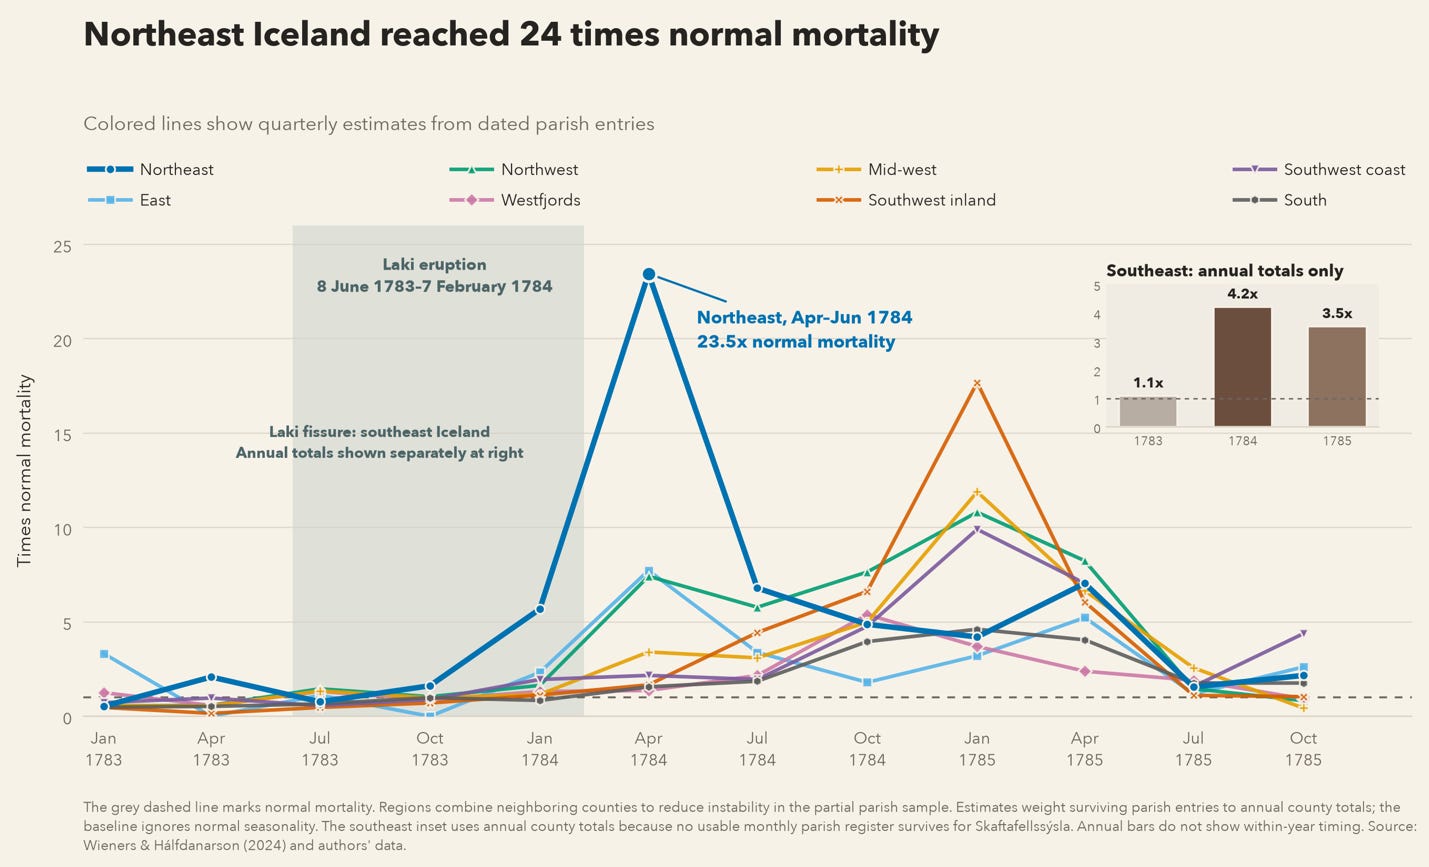
The phrase “normal mortality” in this instance refers to the county’s average annual deaths from 1773 to 1782, but it does not imply regional homogeneity as different regions had their own baselines. Most counties recorded a below-average mortality rate in 1783; however, Þingeyjarsýsla (pronounced THING-ay-yar-sees-lah according to the Google machine) in the northeast was already about 60% above its average before the eruption, having gone from a mean of 65.7 deaths up to 105 in 1783, though that includes seven months of post-eruption deaths, so evidence for a preexisting crisis has to come from elsewhere.
We see that evidence in the preceding winters, livestock losses, and an official report from April of 1783 that describes hunger, weakness, and people abandoning their farms. A harsh winter in 1781-82 led to poor grass growth, which meant poor livestock feed and less hay, the primary plant-based export of Iceland. Another harsh winter the following year meant the cycle repeated itself. No hay meant cattle and sheep were more difficult to keep alive through the winter. Along with meaning they had fewer animals to trade to others, it led to a decrease in dairy products, which provided over half of the daily calories per person. This was particularly severe in northern Þingeyjarsýsla, with historical weather accounts noting that only three cows remained on the Melrakkaslétta peninsula with similar numbers surviving in neighboring Langanes county. That preexisting depletion, followed by eruption-driven disruptions such as reduced trade, resulted in the northeast recording about 24 times the usual number of deaths across a three-month period. Þingeyjarsýsla had about 3,650 people at the beginning of 1783, which was a mid-sized county for Iceland at the time. That makes its recording of 898 deaths in 1784, the highest absolute total of any county in Iceland, stand out even more. That amounts to roughly 246 deaths per 1,000 residents, or nearly a quarter of the pre-crisis population dying in one year. That was 13.7 times its 1773-1782 annual average.
In the southwest, the highest mortality came in 1785, with the Westfjords and southern counties being comparatively less affected in the county-level comparisons. Those comparisons were done in two different ways. One compared the relative mortality for a county in 1784-85 to that rolling average from 1773-1782 to give a within-county estimate of increased mortality. The second measure compared the deaths recorded in 1784 and 1785 to an estimate of the population size at the beginning of 1783. This was done by using data from the 1769 census and carrying forward those county populations by adding each year’s recorded births and subtracting the deaths to produce an estimate of how many lived in each county immediately before the eruption. Those updates couldn’t continue during the crisis period as thousands moved after the eruption, often leaving the worst-afflicted farming districts for the fishing-based communities of the west, with surviving records not tracking everyone’s movements. So, the authors had to divide each county’s crisis death count by that estimated 1783 population, with the result best interpreted as the number of deaths across the two-year crisis per 1,000 pre-crisis residents.
The two methods don’t always perfectly match up in their county rankings, although they did broadly agree. I tested this with a Spearman rank correlation of 0.83 (with 1.0 indicating perfect agreement). Much of the disagreement is attributable to the southwest, which already had a high background death rate that produced a larger death toll relative to its population estimate without a correspondingly extreme increase over the previous years. There is also the fact that people could be recorded as a resident in one place while dying elsewhere. With proximity to the fissure only explaining part of the regional variation, the next question is why the timing also differed, with the northeast peaking early and the southwest crisis showing up a year later.
Why mortality differed across Iceland
Pollution was a poor explanation
While it’s almost certain the haze caused respiratory and eye irritation and possibly even some deaths, that direct effect can’t be calculated from the data we’re left with. A broader question of whether pollution can explain the scale, timing, and geographic distribution of the mortality crisis can be tested, though. As an explanation, it doesn’t fit well, with national deaths not rising during the strongest haze event in 1783. Respiratory events noted in surviving parish records accounted for 3.2% of deaths in the second half of 1783 compared to 3.0% in those same months of 1782. Not exactly evidence for widespread immediate cardiovascular trouble after the eruption. The fact that the worst early mortality was in the northeast also indicates that major causes of the mortality event lay elsewhere.
Food shortages
The sequence of harsh winters and poor growing seasons from 1781-1783, along with the accompanying livestock losses, had drastically reduced food and trade goods availability before the eruption. A county official in Þingeyjarsýsla noted in mid-April of 1783 that there were farms with no horses, cows, or sheep, with residents too weak to work, and residents leaving their farms for better prospects elsewhere.
Livestock losses were not uniform, either. Fluorine-rich ash had been deposited across the grasses the grazing animals relied on, with ash and acidic haze further damaging the vegetation. The sheep in parishes close to the eruption were dying within two weeks and months later in those further away, but in both cases milk production had decreased well before the animals had died. The historical accounts and the 2024 study underlying much of this piece support lethal fluorosis in the livestock. Still, northern counties experienced worse human mortality than would have been implied by animal losses alone, while some places near the eruption lost their animals without an accompanying relative human death toll. It’s a mismatch that indicates differences in what households could do once milk, meat, and livestock had been depleted, including food stores, access to fish, or easier trade routes that weren’t as compromised by lava and flooding.
Fish, trade, and delayed relief
For an island nation with most of its population living along the coast and fjords, fishing was a natural alternative to farming, but access was unevenly distributed. The west and southwest had the best late-winter and early spring fisheries, where fish could be dried and moved inland or be traded for farm or dairy products. Haze made the summer fishing season of 1783 more difficult, with the following winter and spring bringing mixed catches in the previously fertile west and southwest. For the north, sea ice eliminated the winter fishing almost entirely and delayed the following season until mid-May when fishing could resume. The catches stayed mediocre across most of the country and were basically nonexistent in the northern communities. The hardest-hit households from farming districts typically travelled west to fish or try and barter with dried fish, but the loss of livestock and goods to exchange made that a more difficult escape route.
Danish relief began arriving in July of 1784 through the monopoly-trade system that was the entry point for all imported grain, but that was after the northeast’s spring mortality peak. In her 2020 paper, Claudia Wieners calculated the 1784 relief grain supply to have amounted to roughly two weeks of additional food, which, while a real effort, couldn’t replace a year’s worth of lost animal food or be distributed as quickly as was needed. Roughly 440,000 kg of grain was imported while some 1.2 million kg of dried fish was exported, food that arguably could have been redirected toward famine relief in a time of disaster. Even that would have fed Iceland’s population for just over a month and would have required ships, harbors, horses, healthy workers, and new rules for distributing it to the population. In response to a letter sent by Stefán Þórarinsson in May of 1784 asking for grain and dried fish, in July the Danish government ordered part of the western fishing haul to be transported to the northern and eastern harbors where food was most scarce. Only one of the four ships sent to Iceland carried those instructions. It wrecked off Vestur-Skaftafellssýsla, taking the letter with it, and the redistribution never occurred.
Iceland’s differential mortality was indicative of a food crisis across counties that entered 1783 with unequal reserves and different routes to survival after Laki’s eruption had poisoned their pasture and killed their livestock. Households still faced distinct odds depending on their access to fish, trade, transport, and relief, with the northeast having already endured failed hay harvests and livestock losses. Once fishing and exchange also became difficult, mortality rose first and highest there. In the southwest, the sharpest losses came later. After the next major eruption somewhere in the world, a low immediate death toll should prompt a second set of questions: what will happen to the next harvest or fishing season? Can food still move, and will aid reach communities whose reserves are already gone?
Comments
Nothing yet. Say the first thing.
Sign in to join the conversation.