
TLDR; If you can’t understand what this chart shows about Pittsburgh, PA then you just might be lying…
That’s right. Pittsburgh’s CVR file is a failed coverup and for good measure it’s of a not previously seen variable vote adjustment scheme that comes in at a 1.1X framework of all things and applied through all of the counting. But it looks like lots of ballots were stuffed “marked correctly” after the counting stopped midway at an almost perfect 80% D / R ratio so it’s not clear how critical the algos were anyway. (The CVR’s do not have timestamps but it’s pretty obvious what happened here in relation to when the “counting stopped” ;)
It’s a thing of beauty, isn’t it?
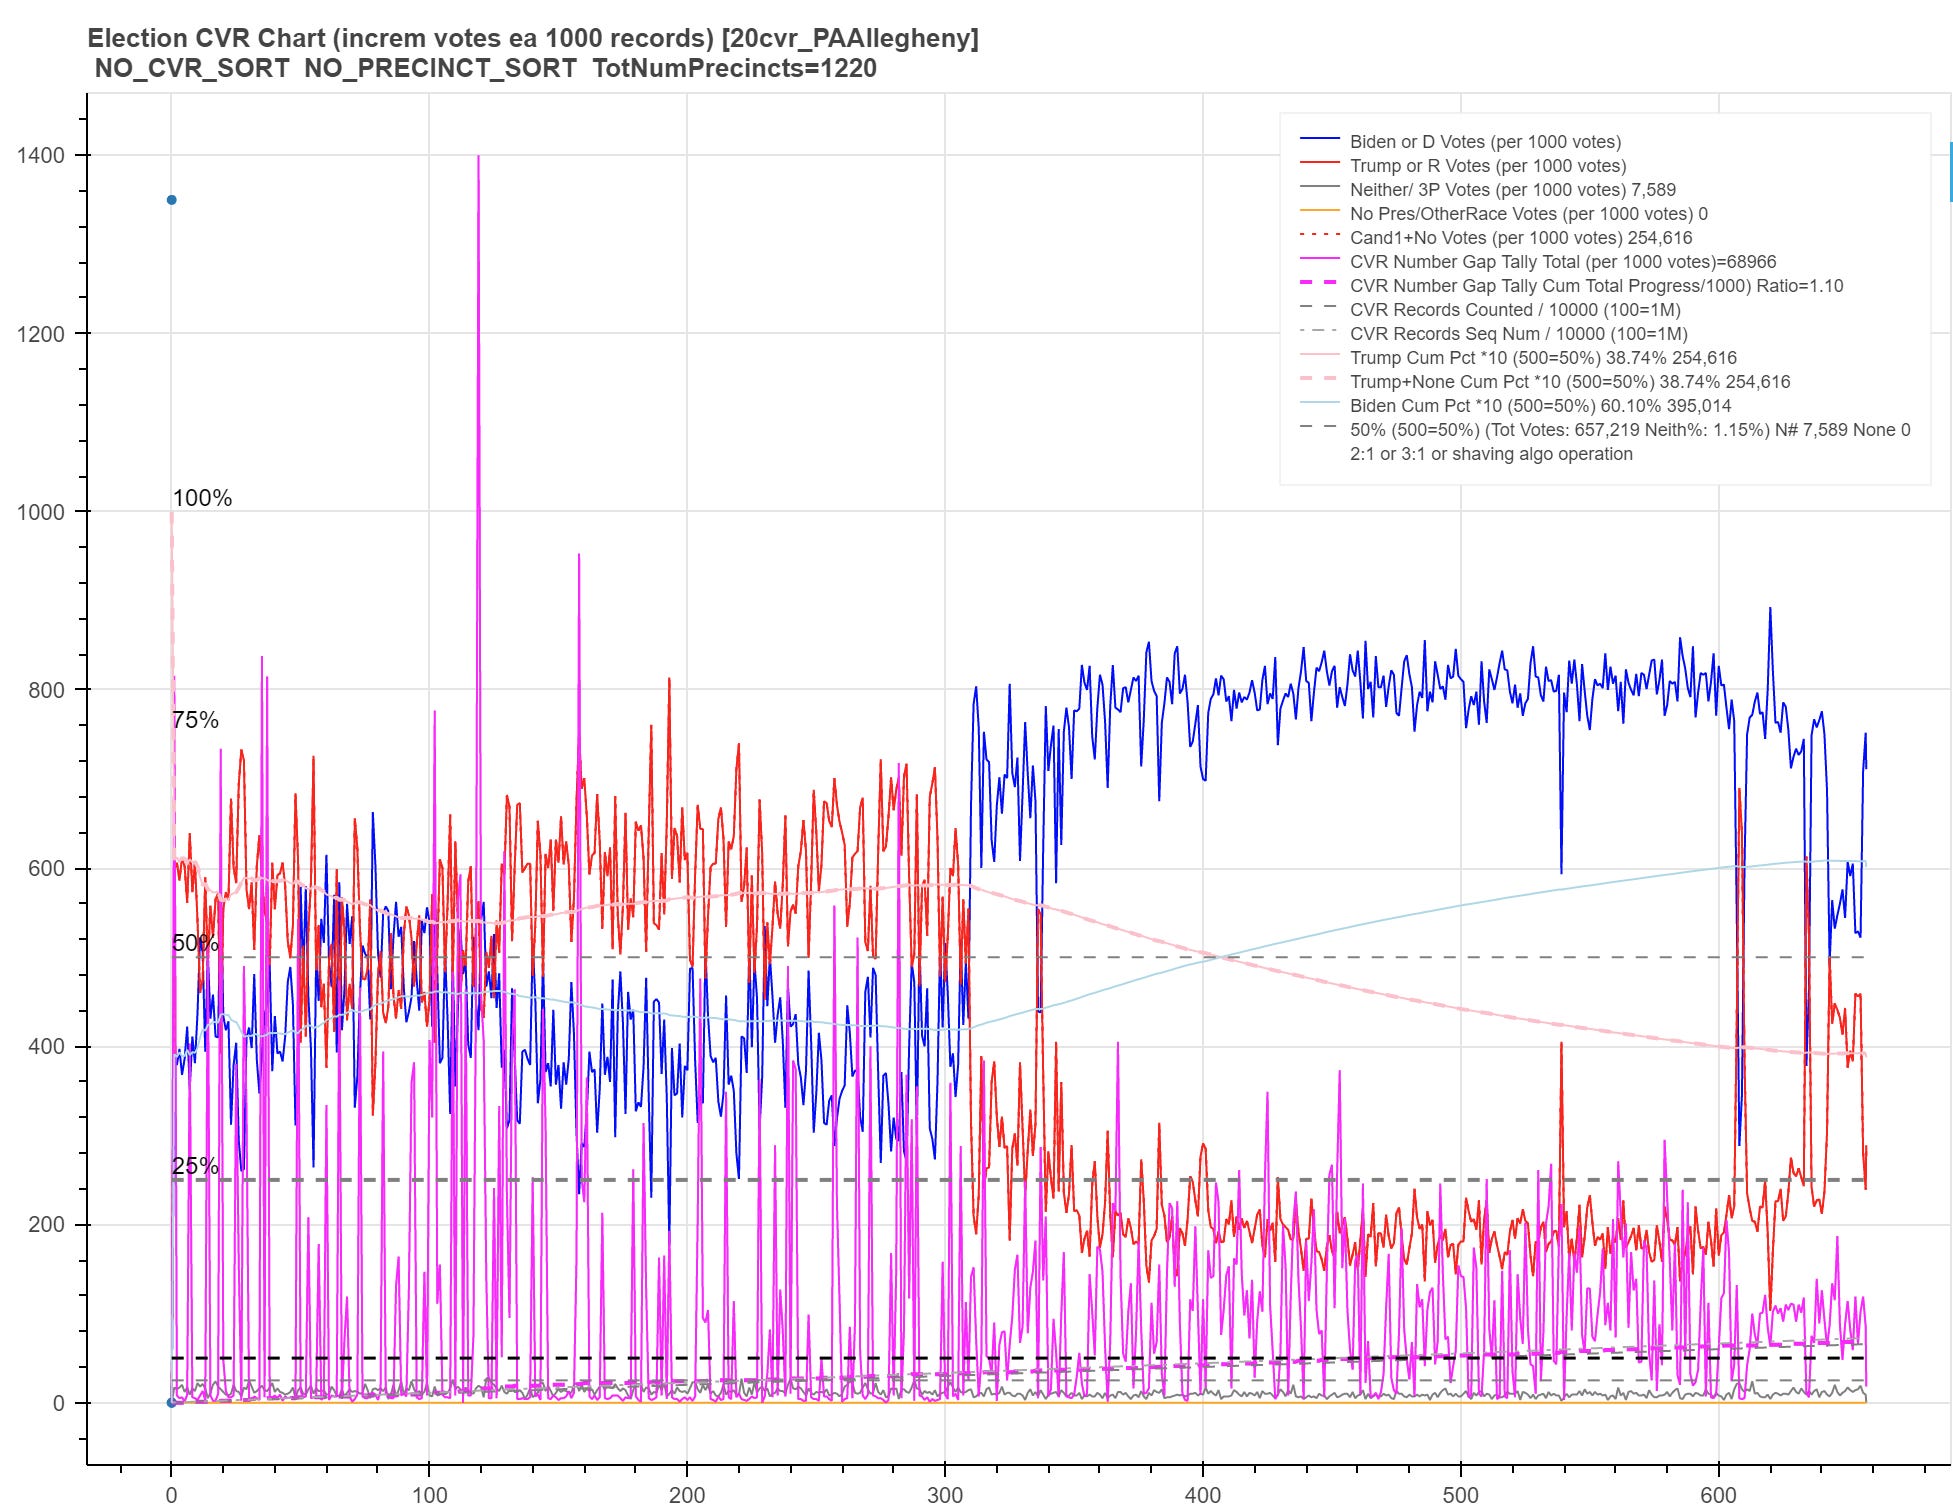
Look at that completely open “eye” for the last half of counting. And here it is with an 8 point boxcar filter smoothing applied in case you are feigning blindness LOL:
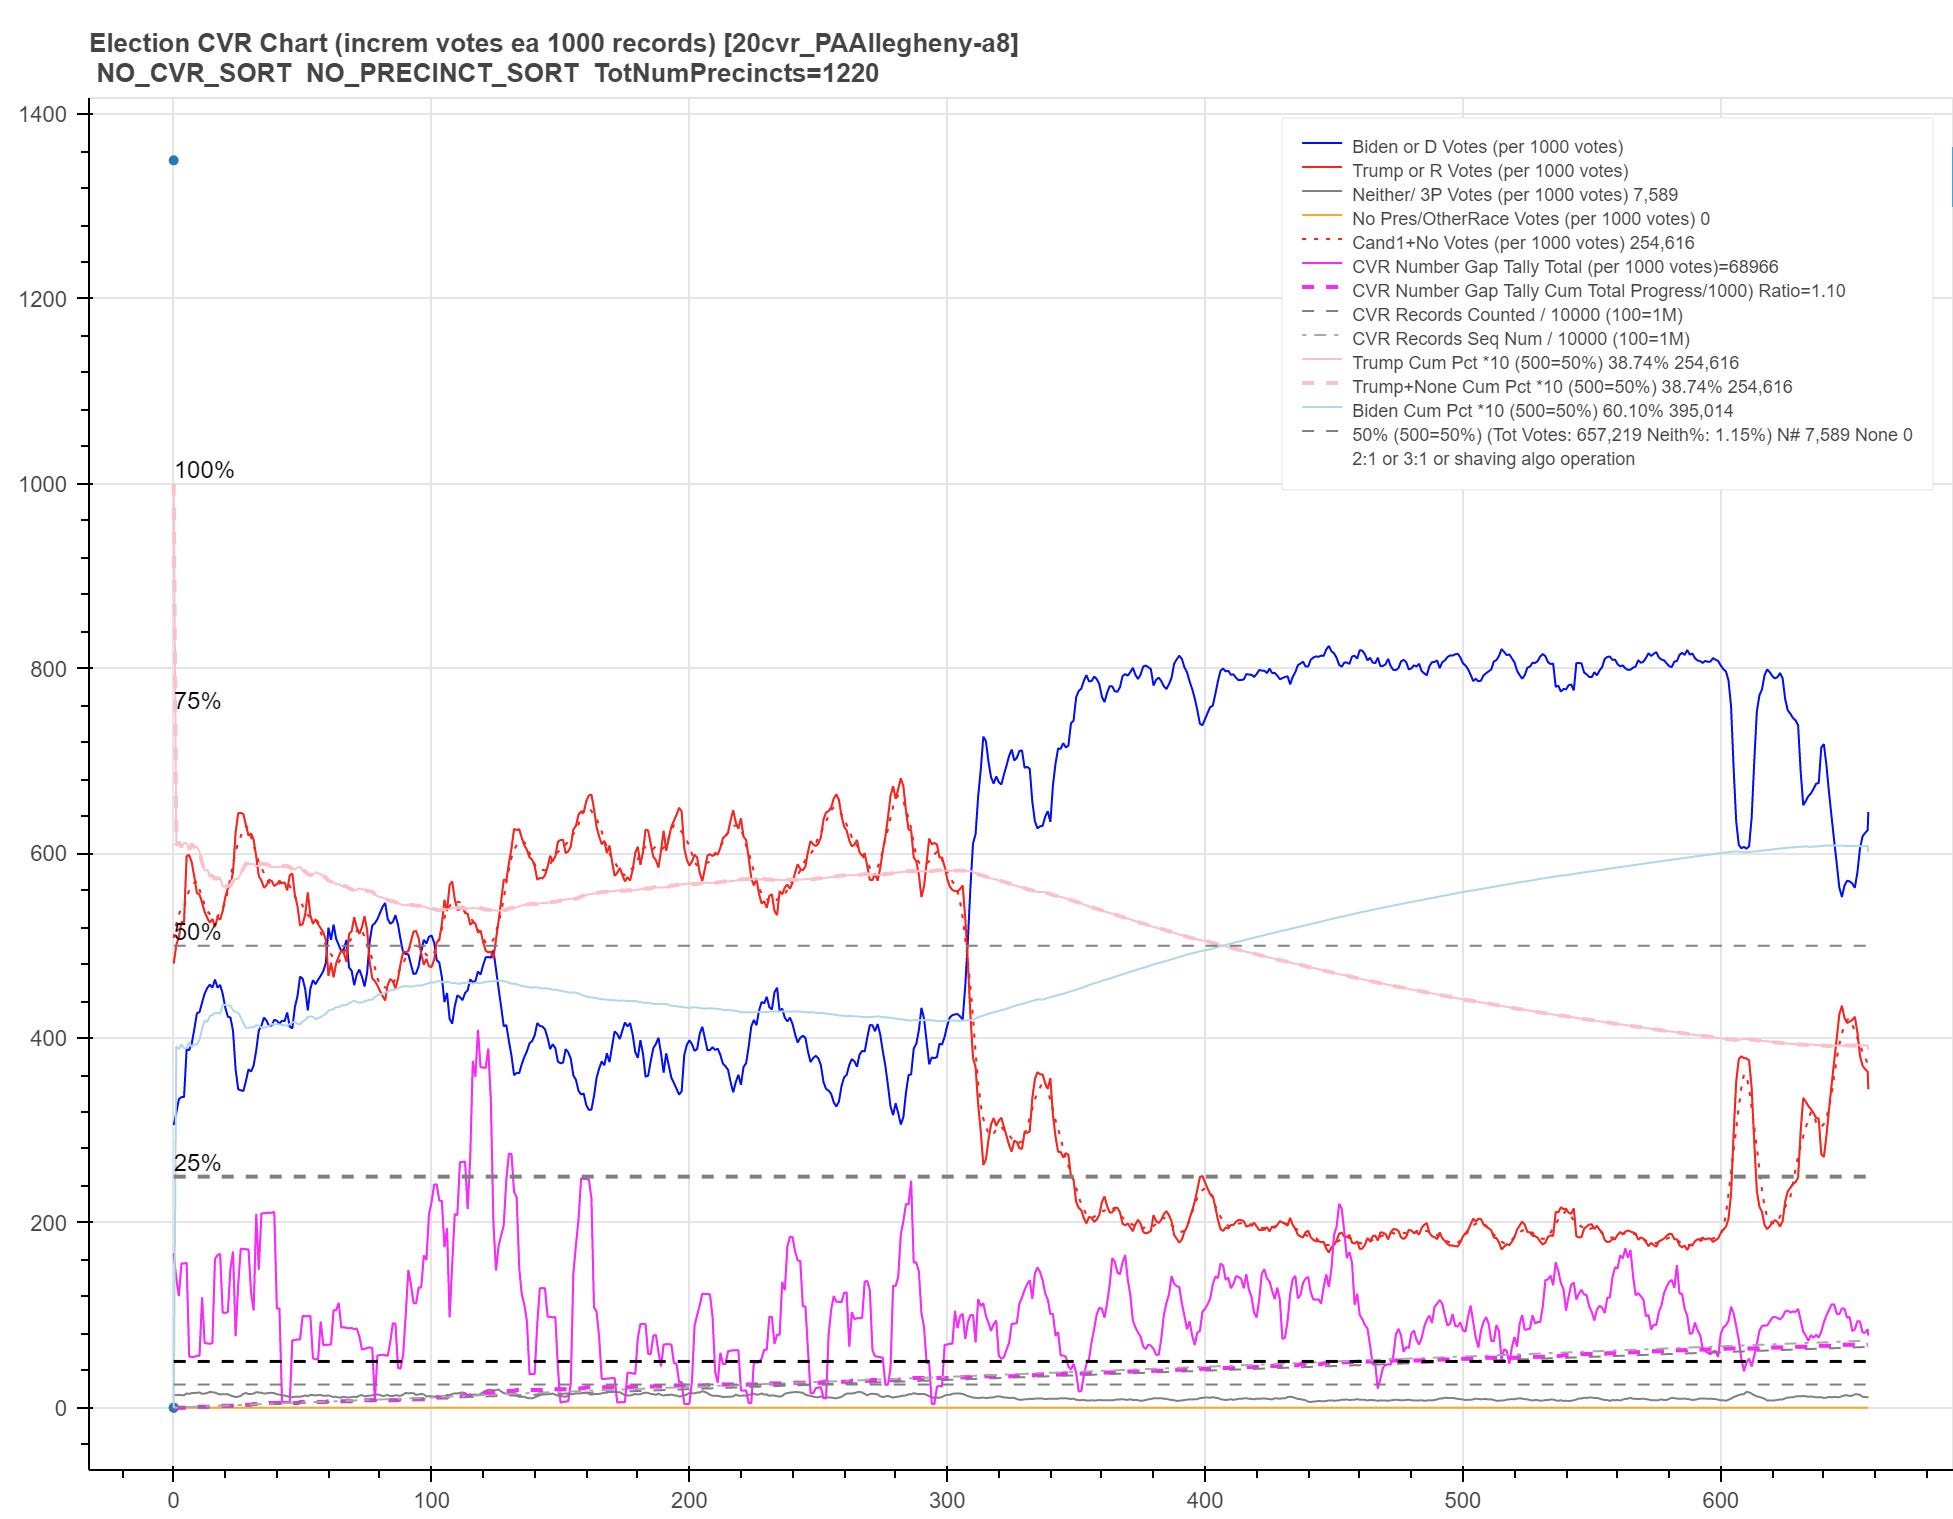
Lots of electronics GHz signal path designers would literally give a up month’s pay for an electrical signal “eye” that looks like the last half of this voting sequence! (Sorry but I couldn’t resist some more “signal processing … err, signal integrity … for dummies” ;)
That’s right: I’ll take “not natural” for $1,000,000 Alex …
And yes, it sure looks like Trump would have won if the counting stopped at the correct place, doesn’t it?
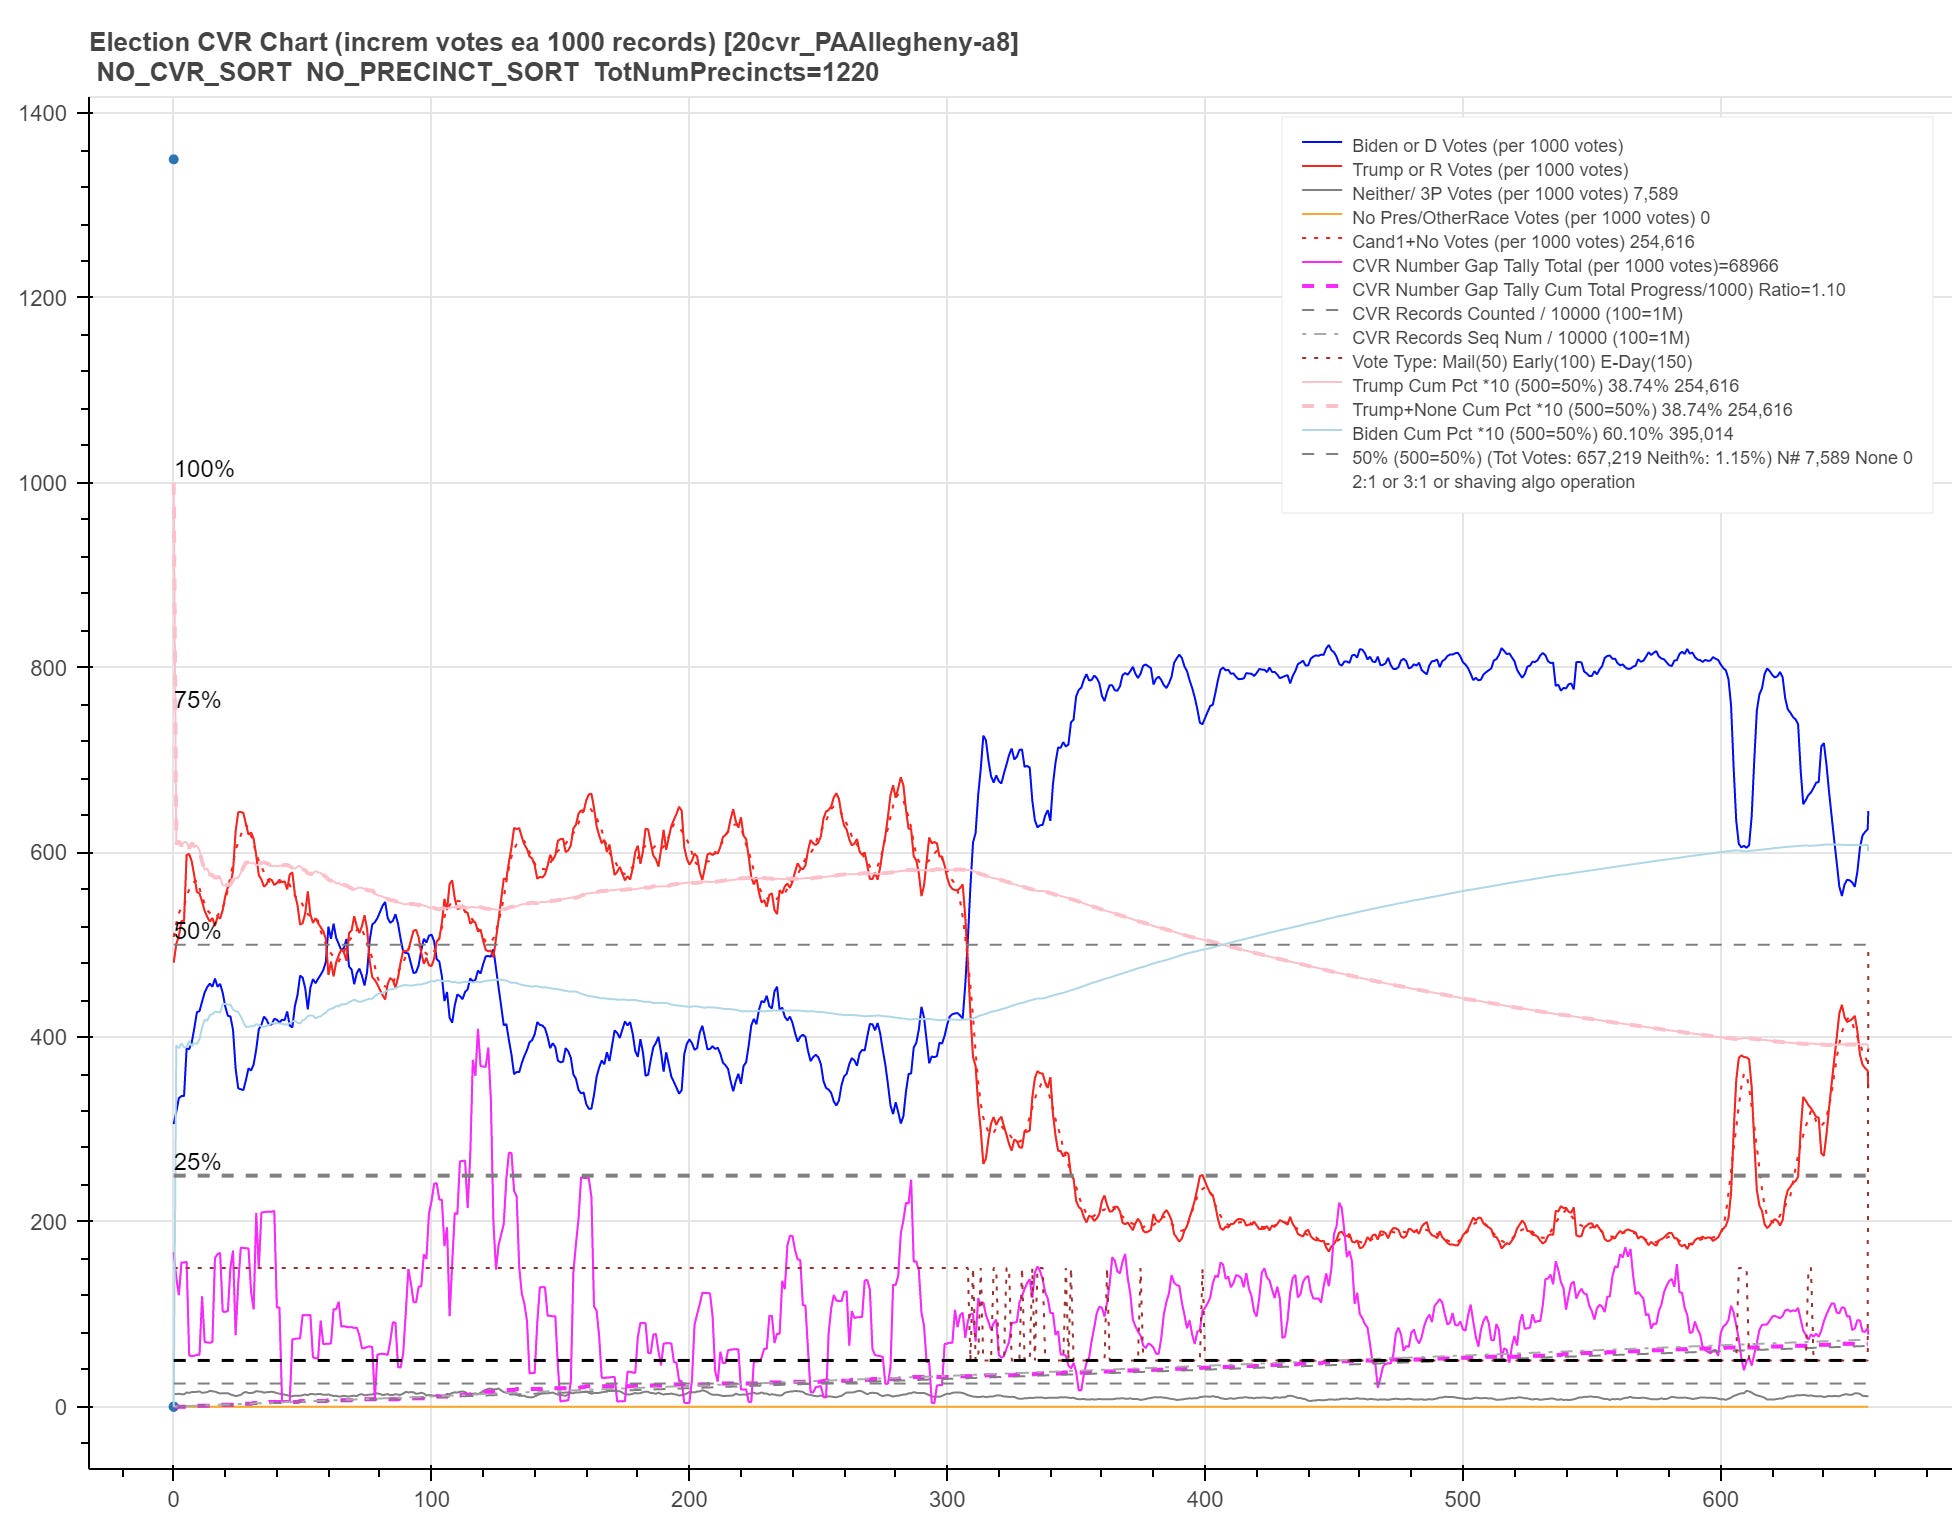
UPDATE 220822pm: Adjusting to also use the “Reporting Group” column in addition to “Counting Group” from other vendors/versions yields confirmation that Election Day votes were in fact almost entirely counted first (as shown by the dotted brown line plateau running at the 150 level as opposed to the 50 level for mail in):
More updates likely to come…
No posts
Comments
Nothing yet. Say the first thing.
Sign in to join the conversation.