
First, let’s remember the craziness of Clark County, Nevada (Las Vegas) that formed the initial theory about the 2:1 ballot framework for the algos:
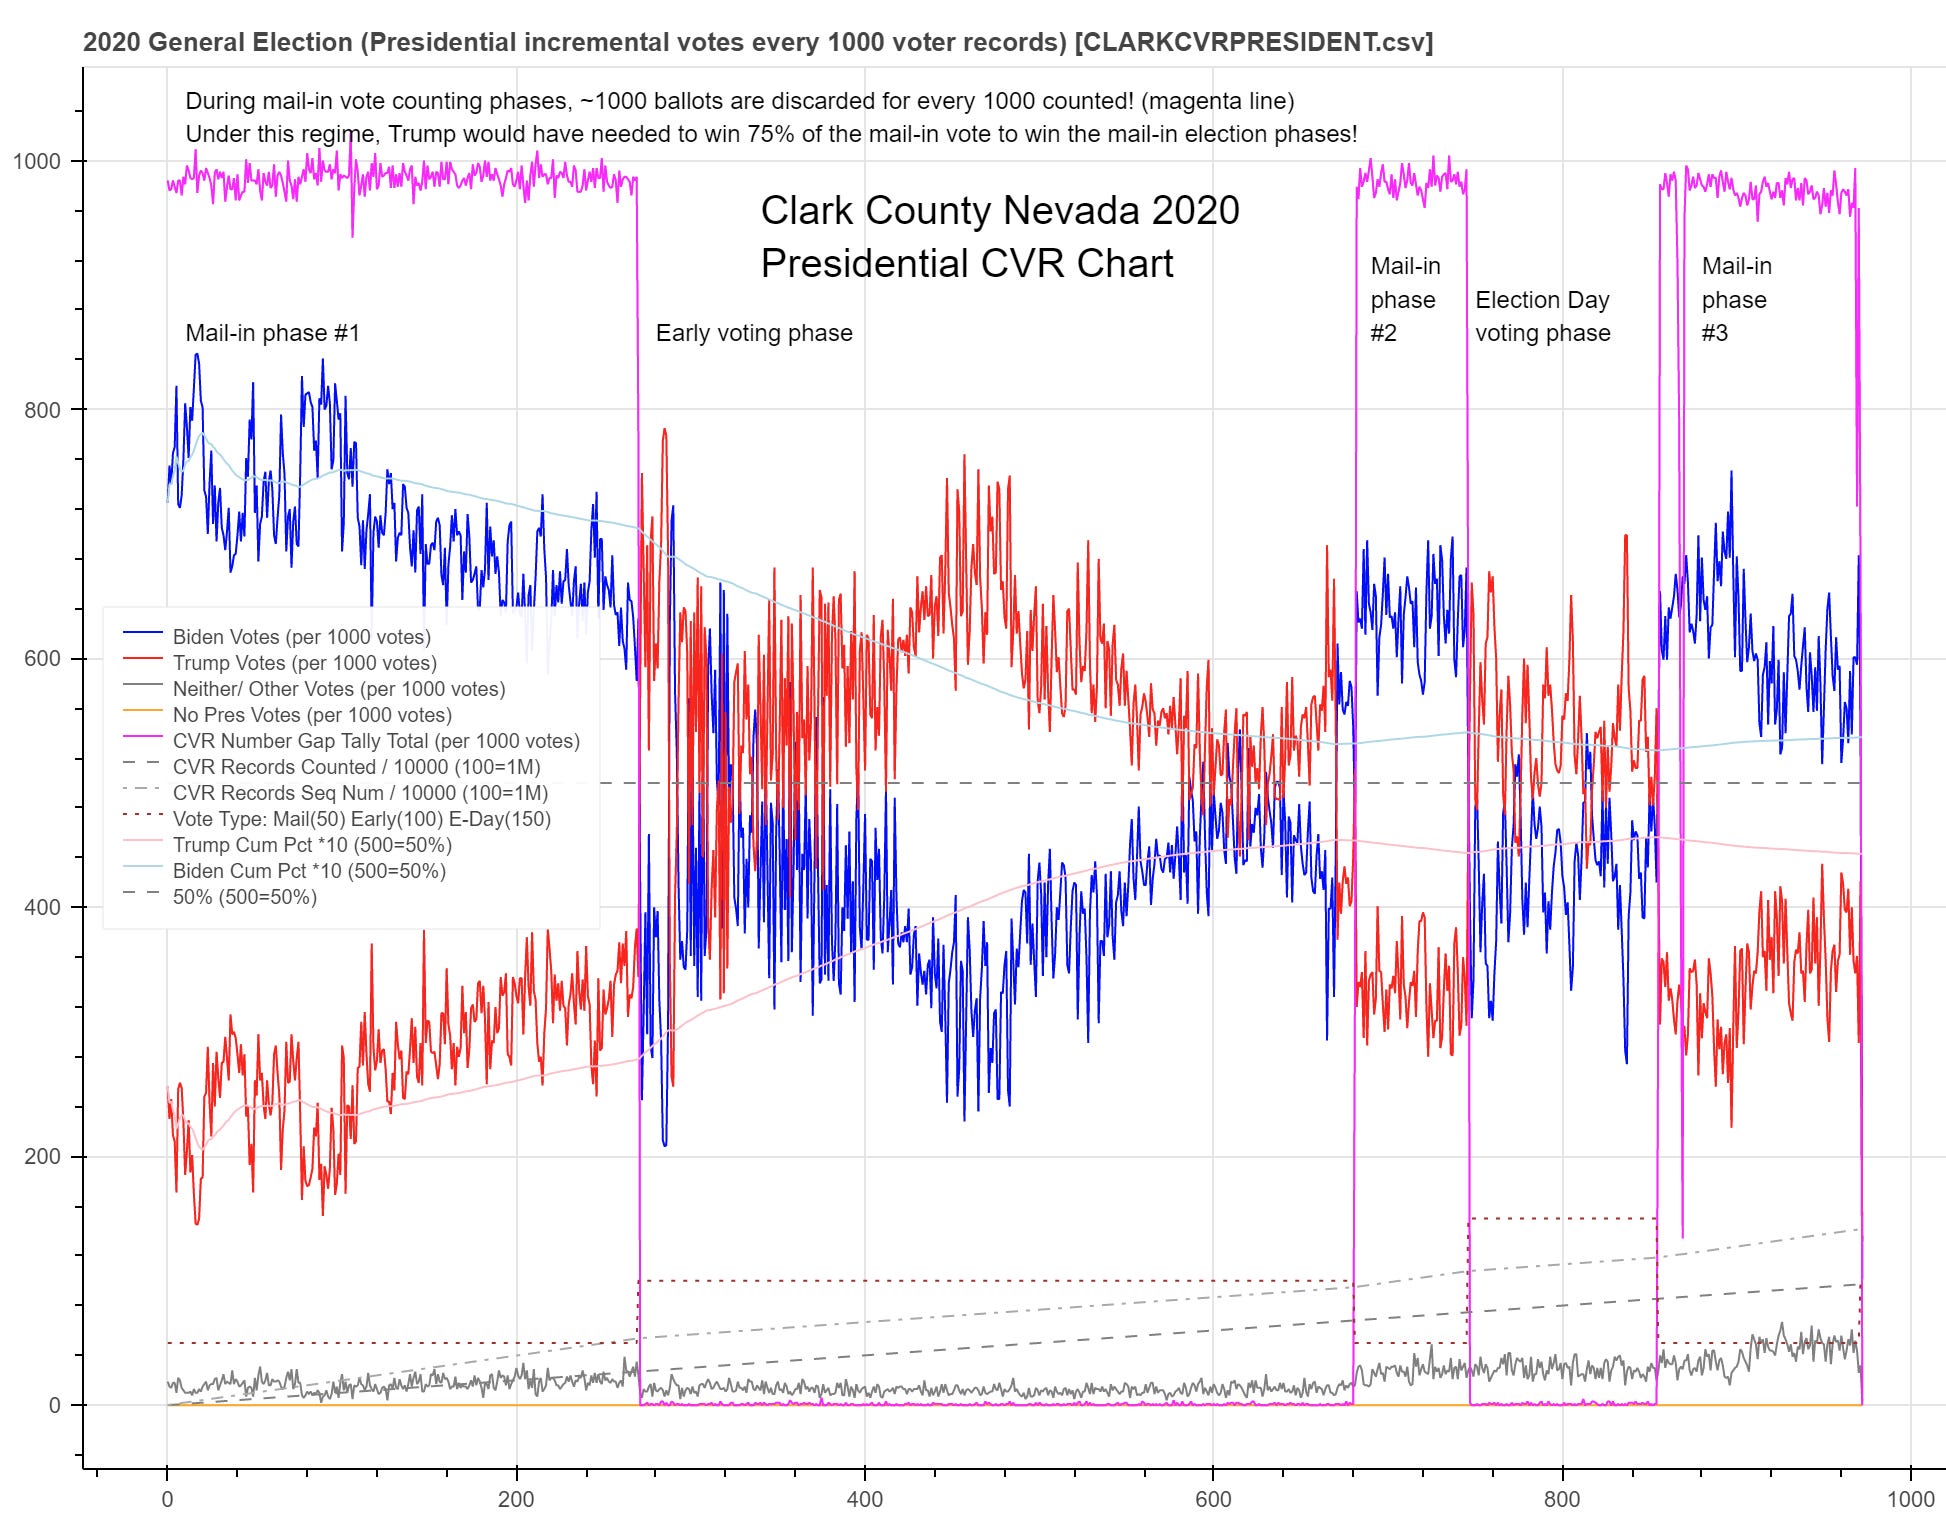
The high magenta near flat plateaus indicated that for every 1000 ballots cast DURING MAIL-IN COUNTING ONLY there were roughly 1000 “unused” ballots. This is what I call a 2:1 ballot framework where if you do the math, Trump would have to get over 75% of the vote to win the mail in phase (modulo the inefficiencies and defects of the algos used in the framework which were exhibited clearly in Pasco, FL). And only during mail-in ballots the Ds (Biden) took a large incremental lead out of the gate that decreased over time much like we see in Colorado in places like Larimer County.
When we filter Clark to only show the mail in phase we get this:
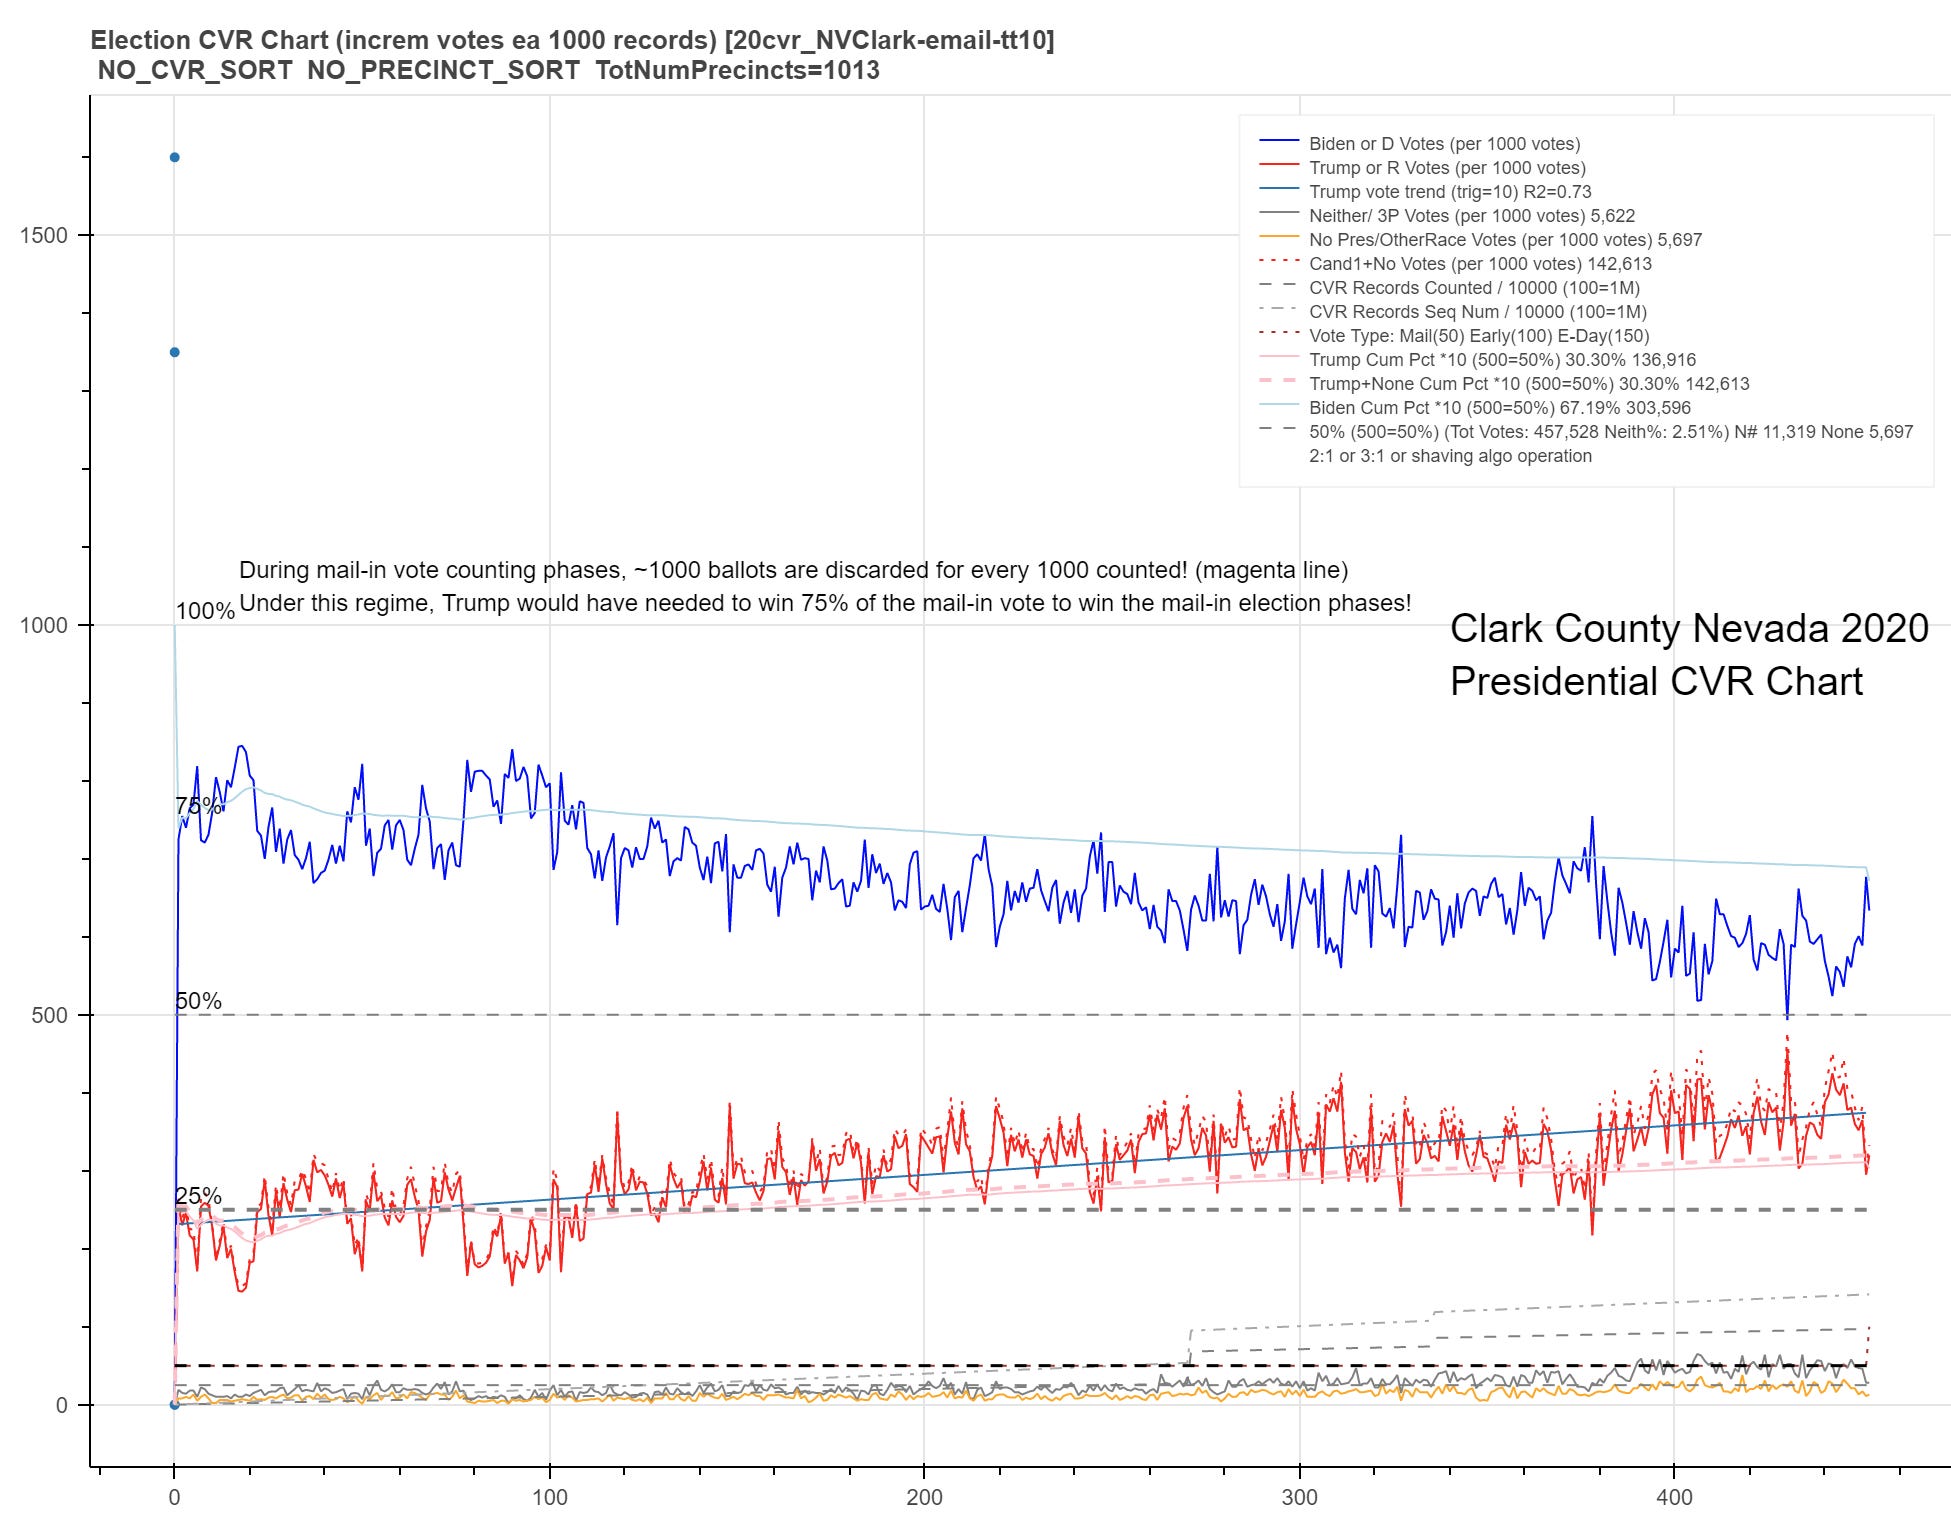
That’s right, they are attempting to draw straight vote level trend lines in the mail-in votes (as in Denver where they were even straighter given the 3:1 framework there).
Of course Clark is an actual failed coverup — the high magenta lines would not be there if it was a successful coverup. So what happens when we look at Washoe County, Nevada (Reno) which is a SUCCESSFUL coverup (no orange or magenta lines)?
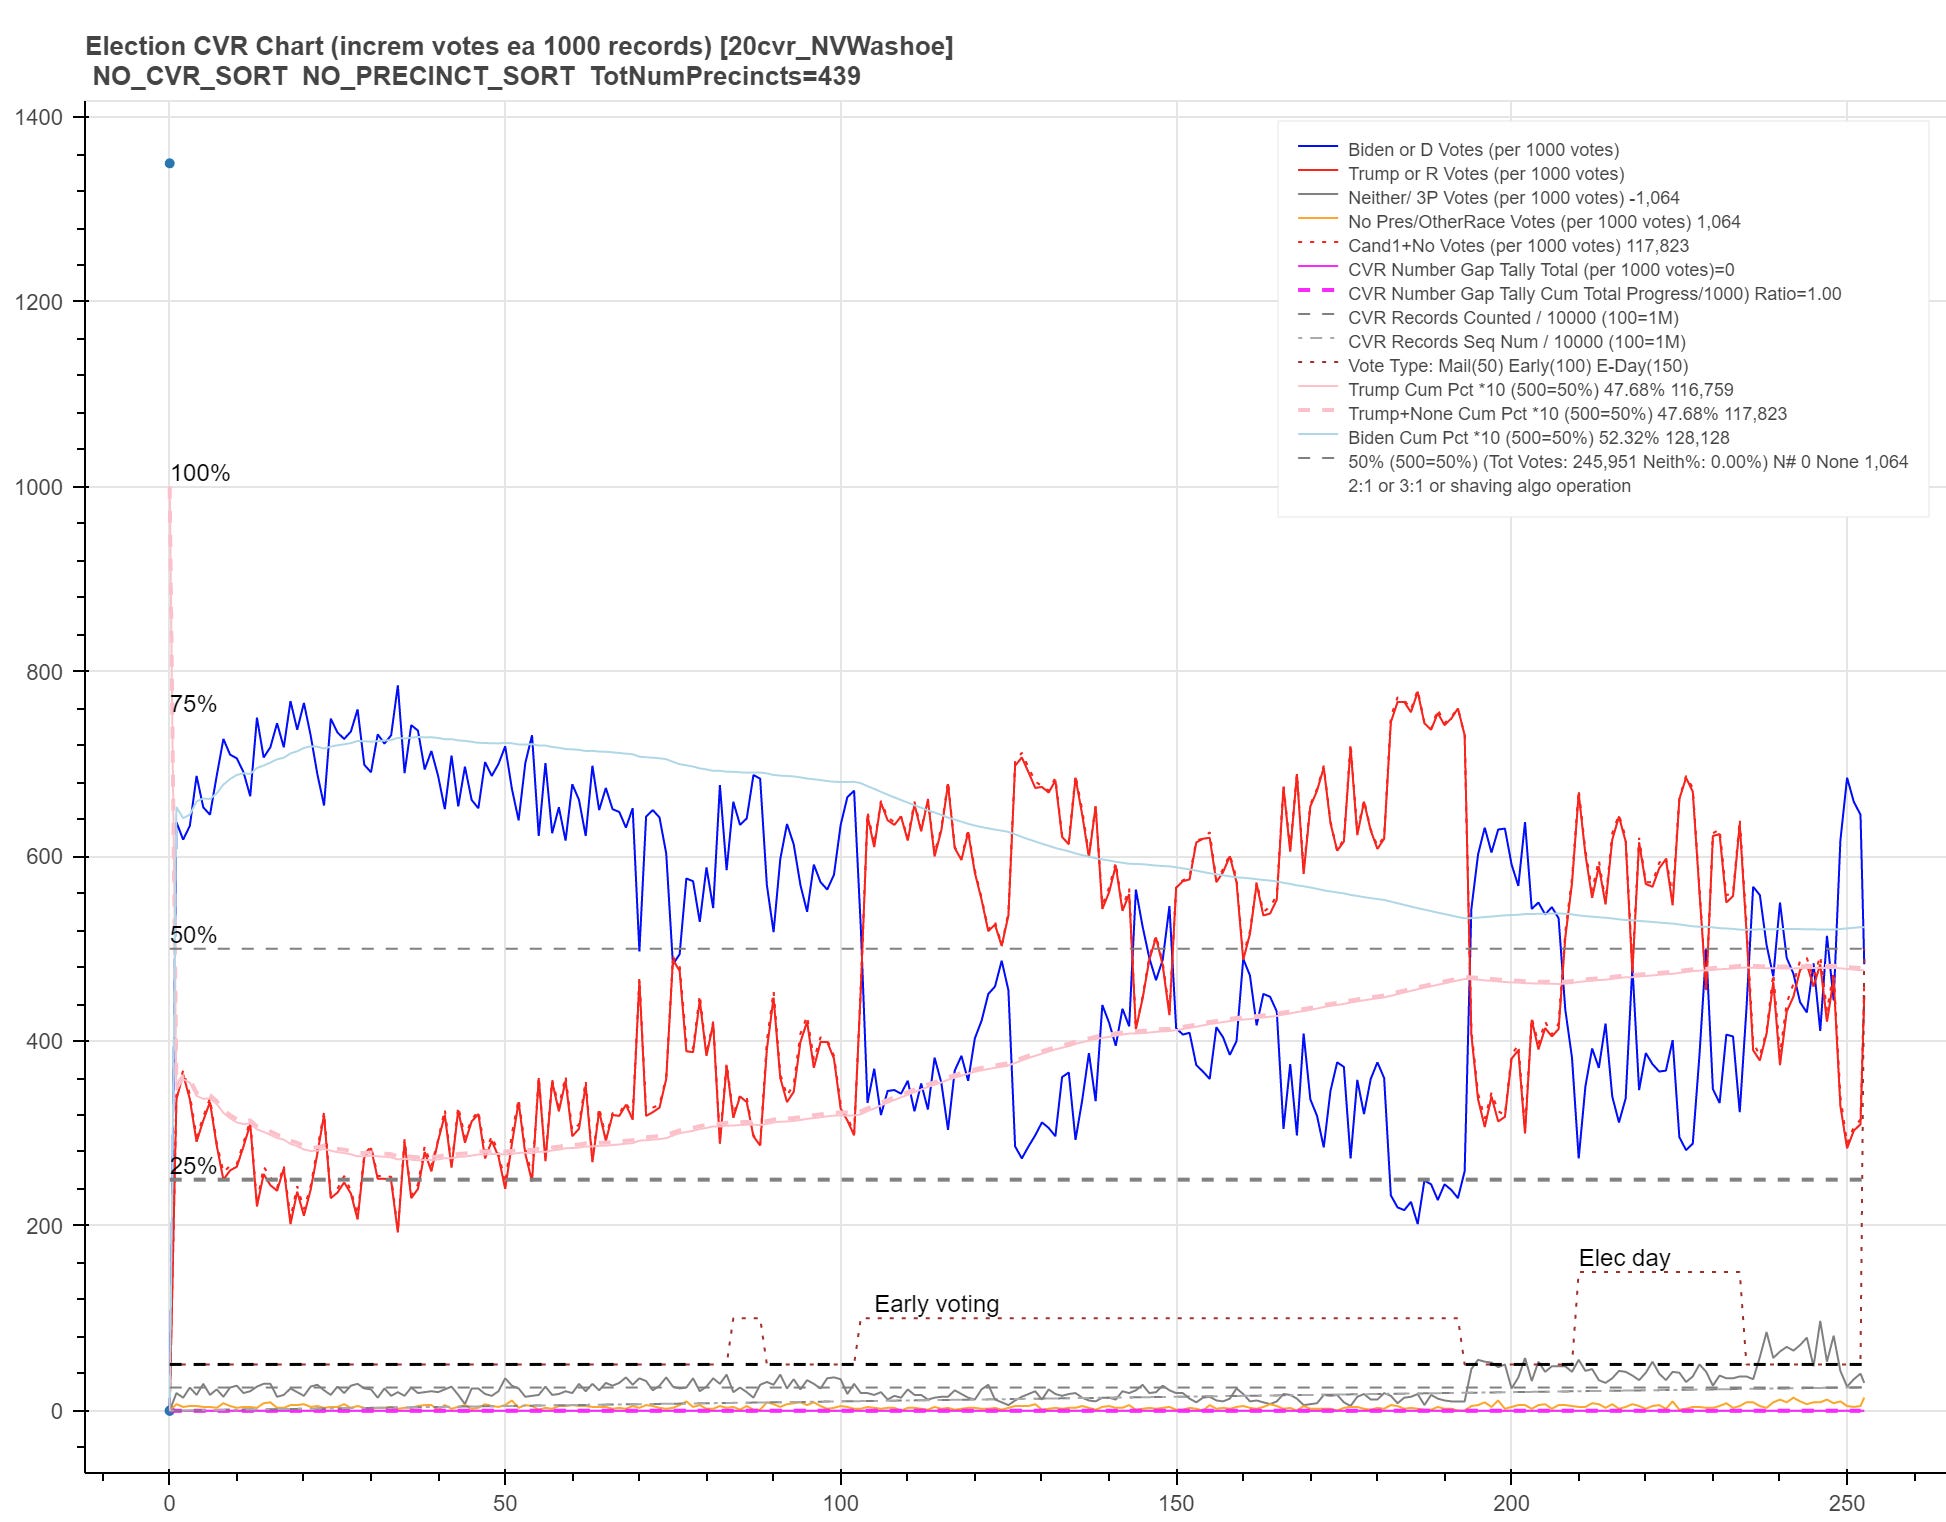
Hmm. This looks familiar! Just like down in Clark we see Trump winning handily during Early Voting and Election Day counting but losing during the mail-in phases. And if we look just at mail-in for Washoe what do we see?
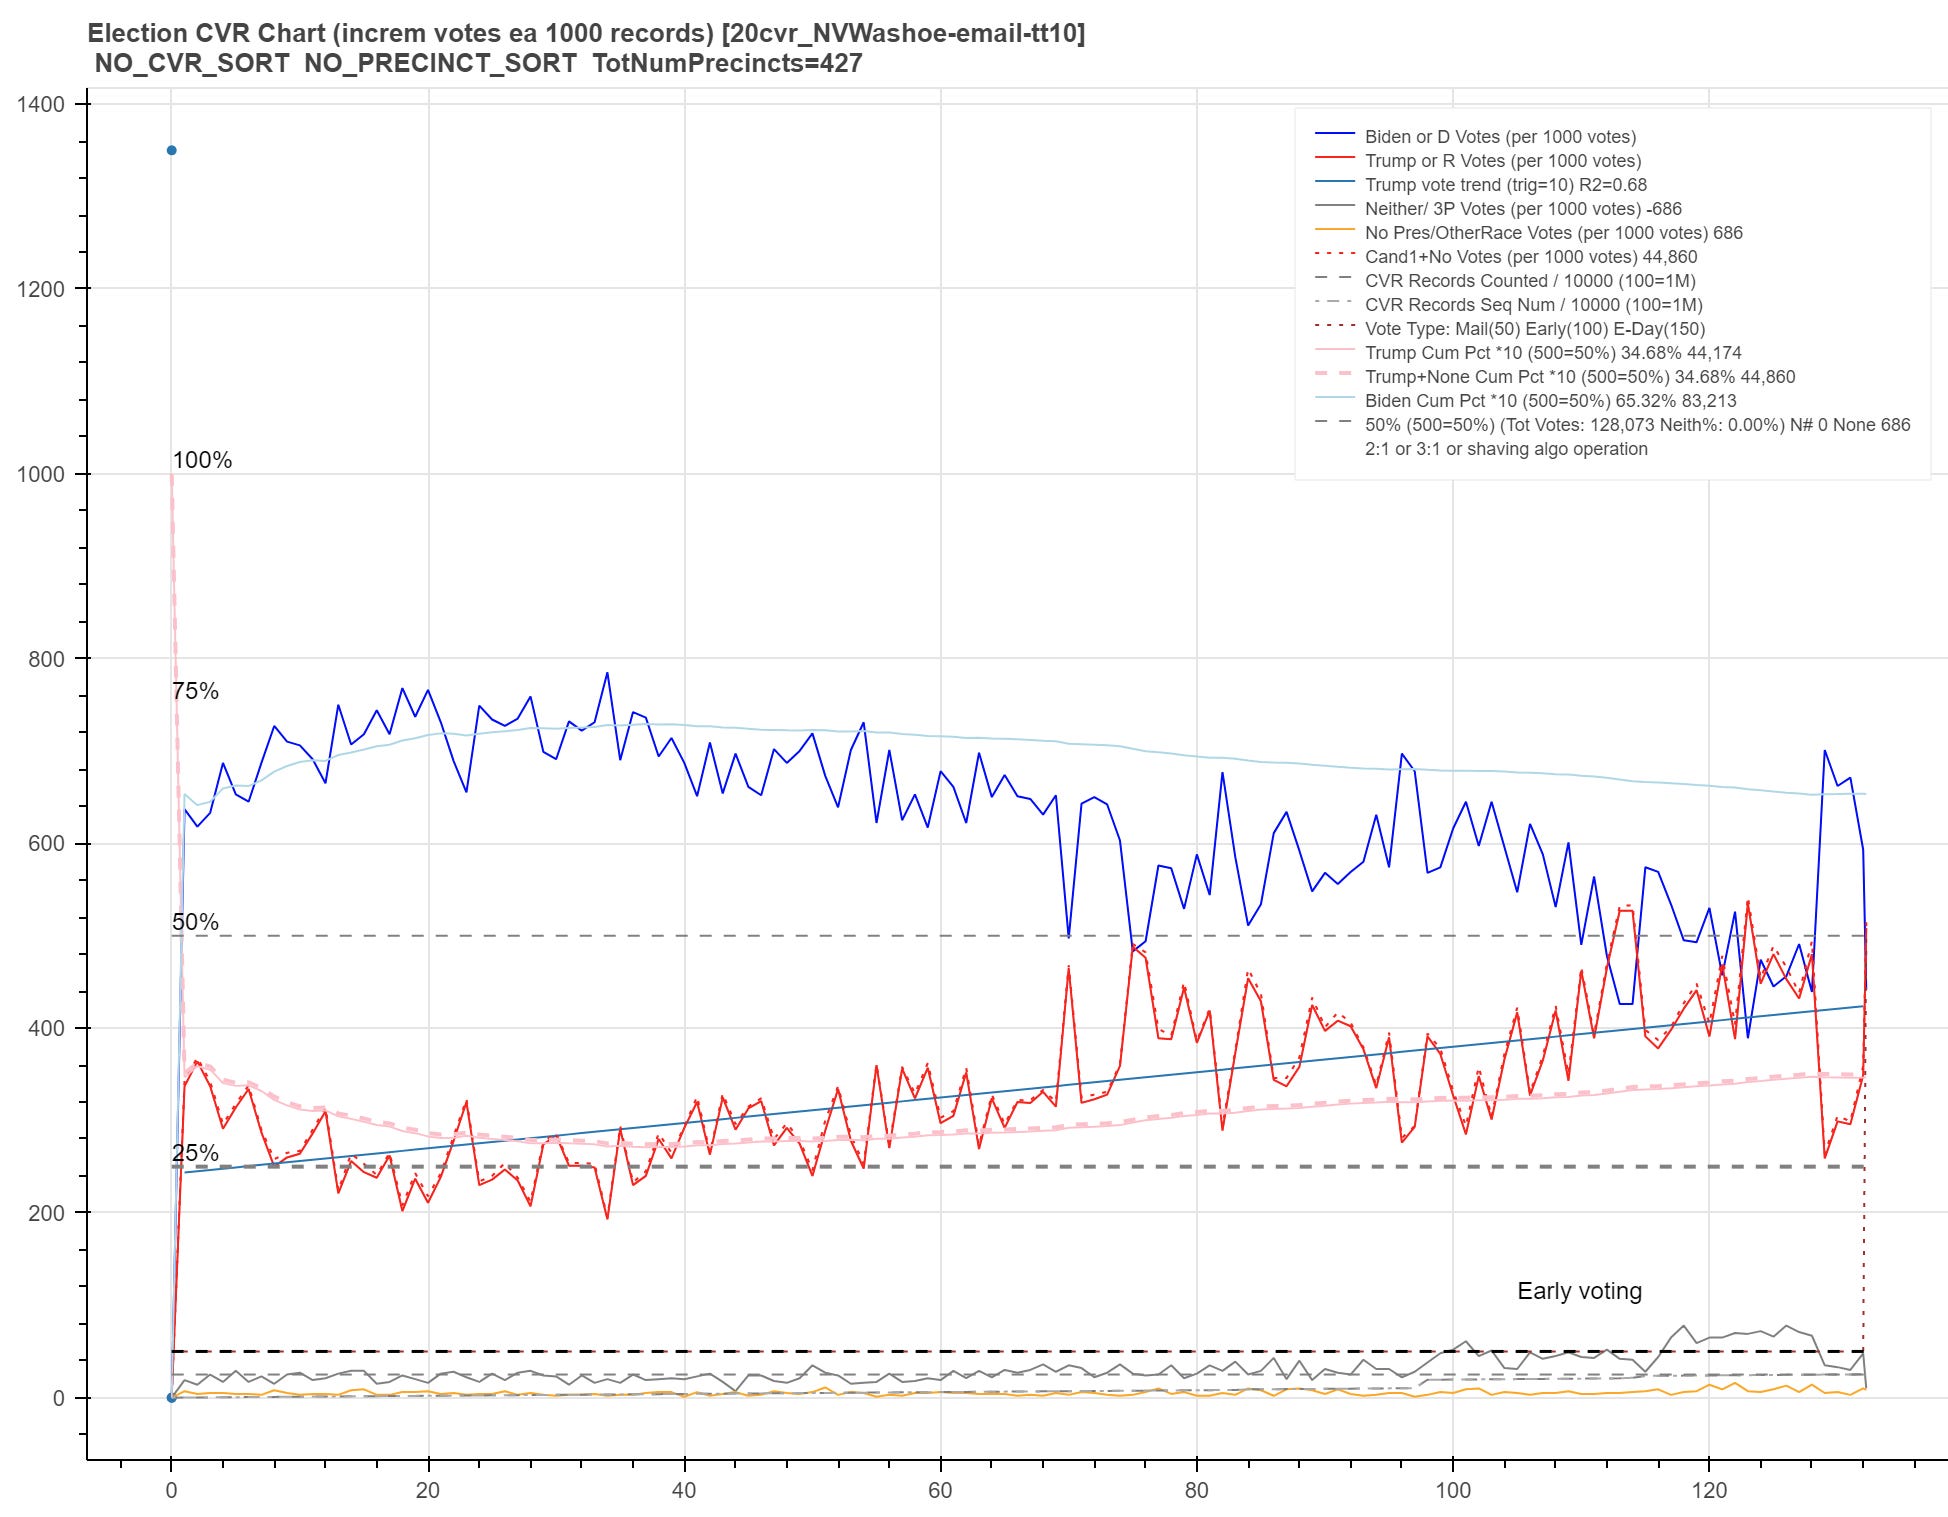
Similar to Clark but looking at Early Voting and Election Day voting the Trump percentages in Washoe were higher so the algos struggled more to draw straight lines.
Now let’s go back and remember Pasco County, FL where I pointed out that it looked like the algos kicked in at around 75% cumulative percentage, struggled hard to shave votes from Trump during the middle of the counting as exhibited by the increased oscillation amplitude of the orange (derivative) “missing vote” line and then relaxed so as not to make everyone incredulous with a Biden win in a deep red county:
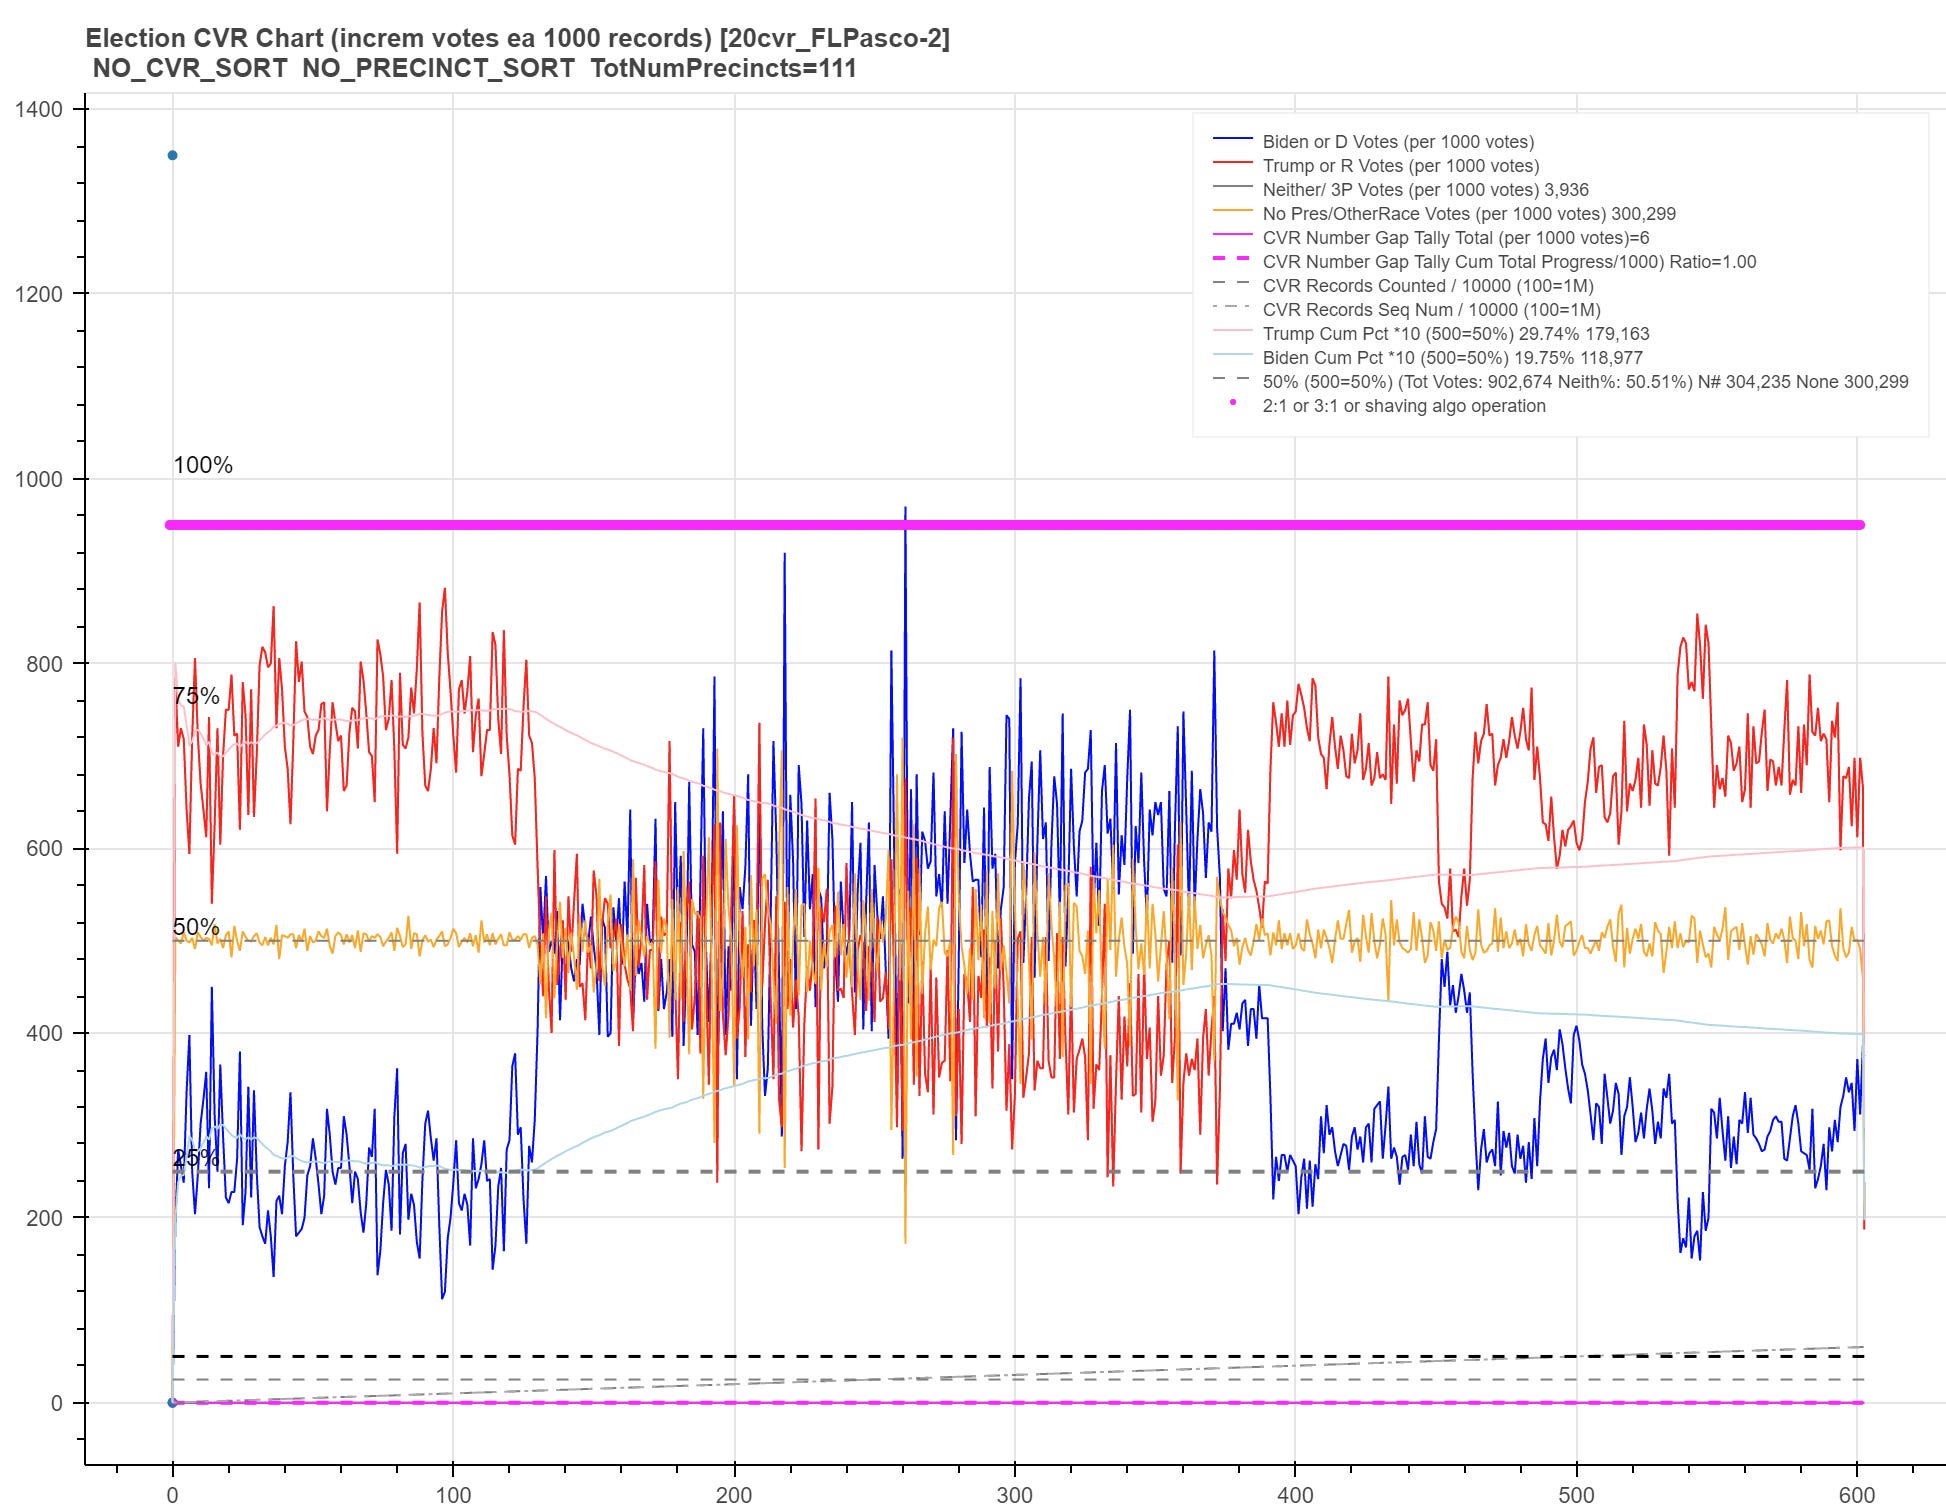
Given that during the rest of the counting it looks like Trump was running at 65-70%, it makes sense that the algo struggled to get Biden much above 60% during the vote shaving phase.
Which brings us to the next topics: More detail on the math behind the assertion I just made and … hmm, Florida doesn’t output any voting phase data in their CVRs like Nevada but could that actually be something we didn’t pay enough attention to regardless in Florida?
On the math behind what can be done with a 2:1 framework, let’s look at some simple points in the analysis:
If the R vote is an actual 75%, then in a 2:1 the most the algos can make “go missing” on a sustained basis is half of the votes and of course the target is that all of those will be R. So that means of the original 75+25=100 the algo can remove 50 of the 75 leaving the vote at (75-50=)25/25 = 50/50.
If the R vote is 90%, then the best that can be done by Rs is (90-50=)40/10 = 80/20.
But if the R vote is only 60%, then we have (60-50=)10/40 = a 20/80 potential LOSS for R.
And it’s even worse for a 3:1 framework like in Denver where the required threshold to win is 83%(!) instead of “only” 75%.
So given this and the fact we’re not sure if the Pasco vote shaving was actually only during a mail-in counting phase, let’s do some more exploring — first with Marion County, FL which is a SUCCESSFUL coverup (no orange or magenta lines)!
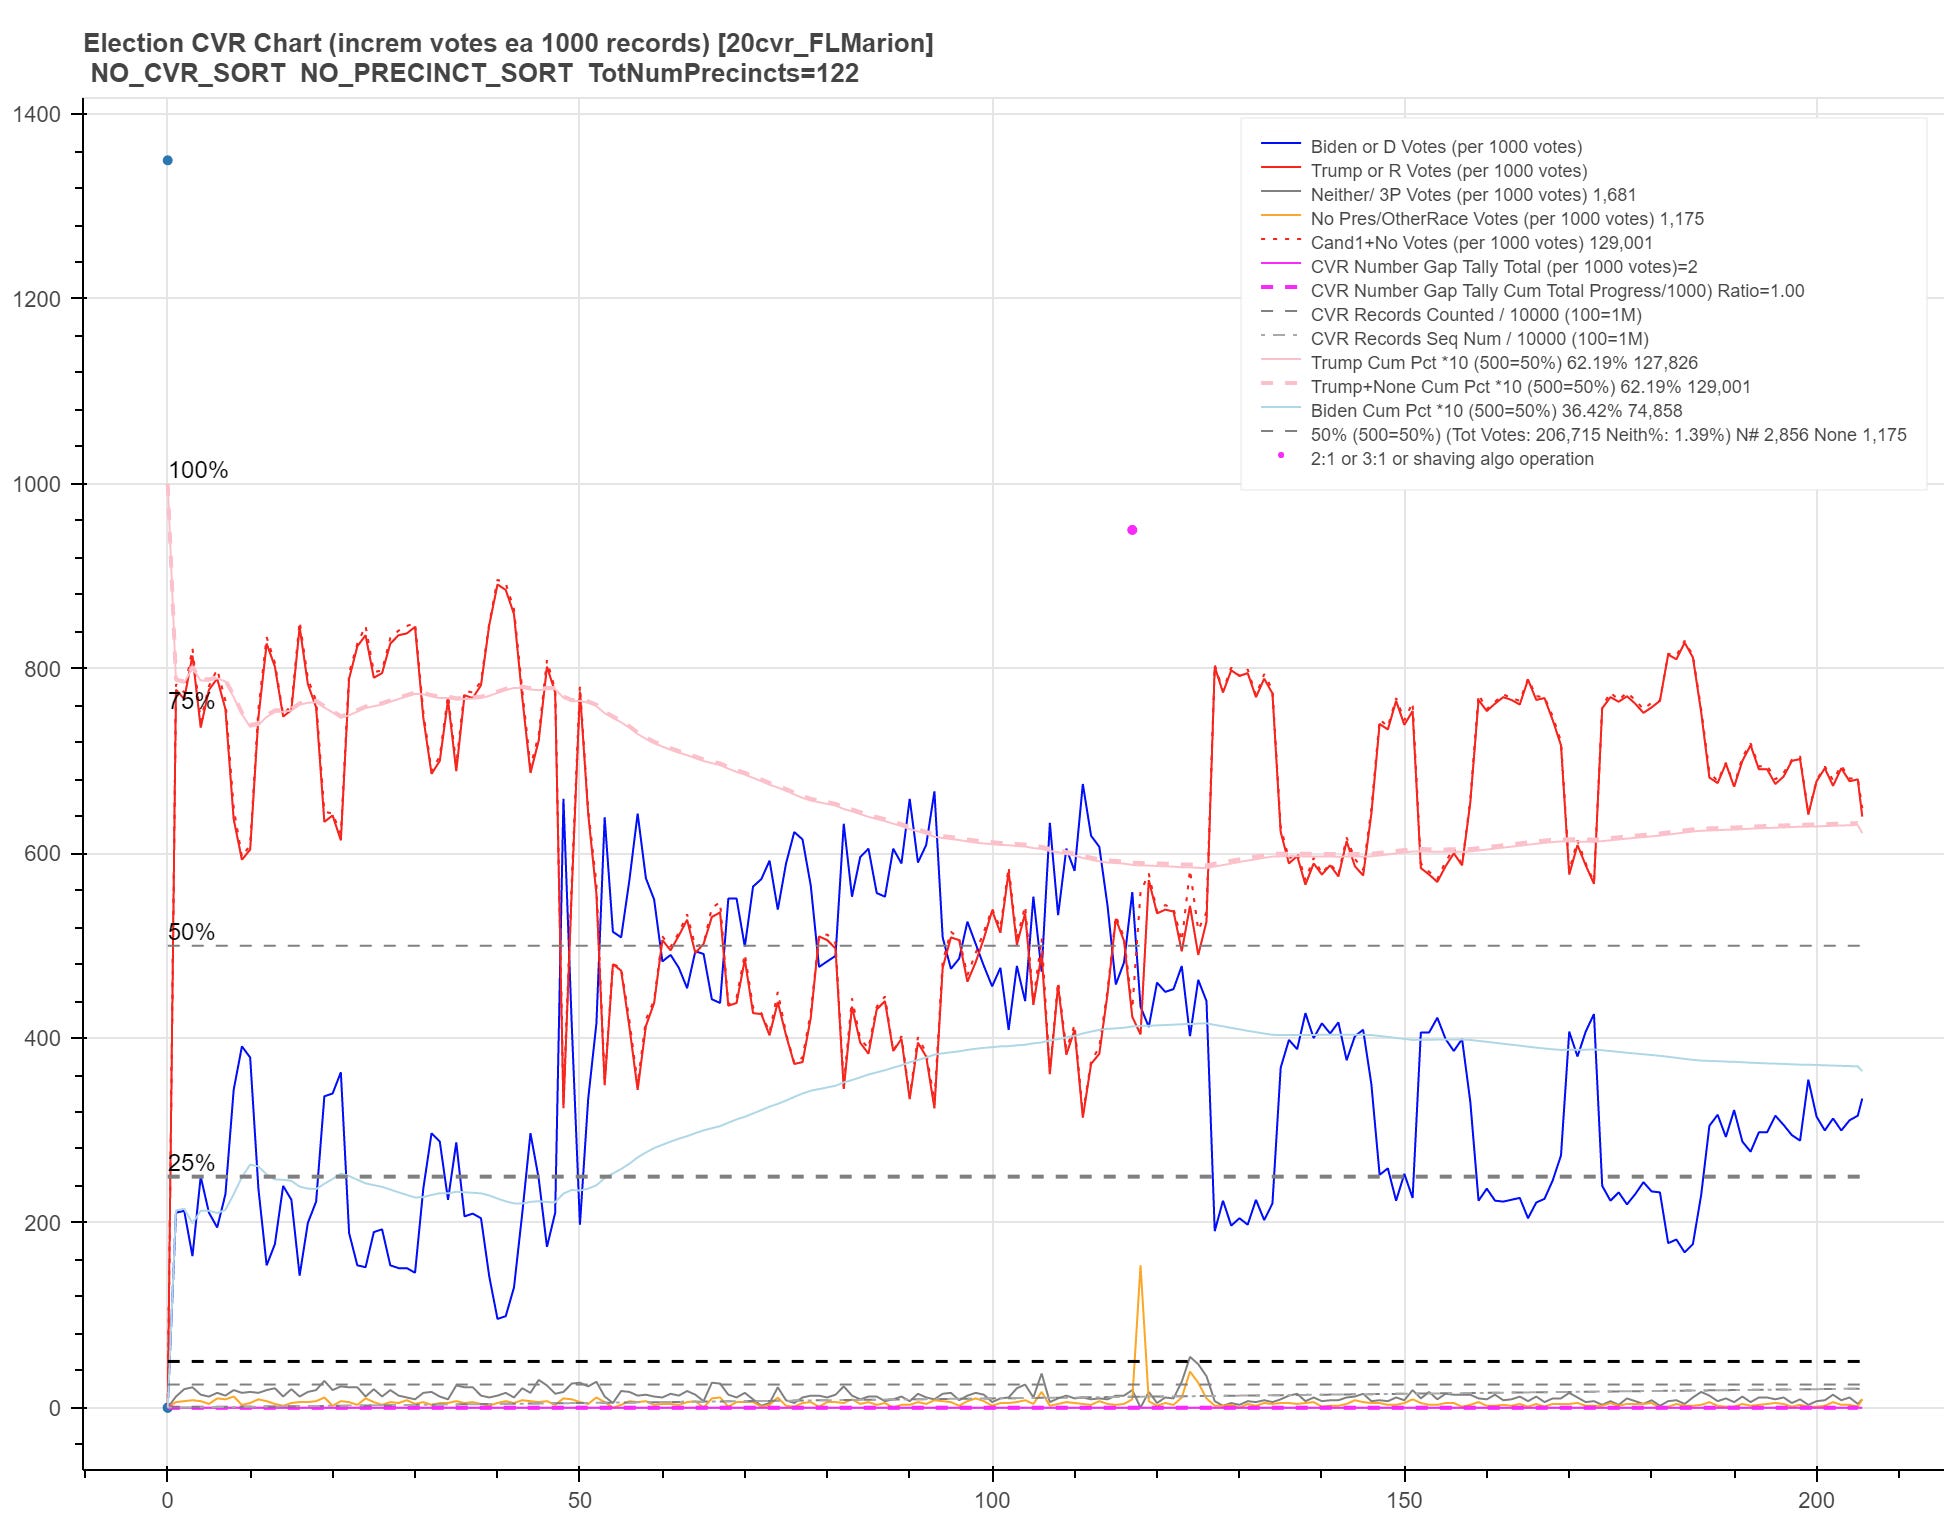
Other than the lack of the “leak” “missing votes” orange line we see in Pasco and significantly fewer votes in the smaller county of Marion, the Pasco and Marion charts look suspiciously similar! So once we see a failed coverup, we can’t unsee it even if the CVR file is not an actual leak!
And next let’s see if we can tie both ratio and vote type/phase aspects together using a county that is both deep red and has the vote type info in the CVR: (non leak) Barrow County, GA:
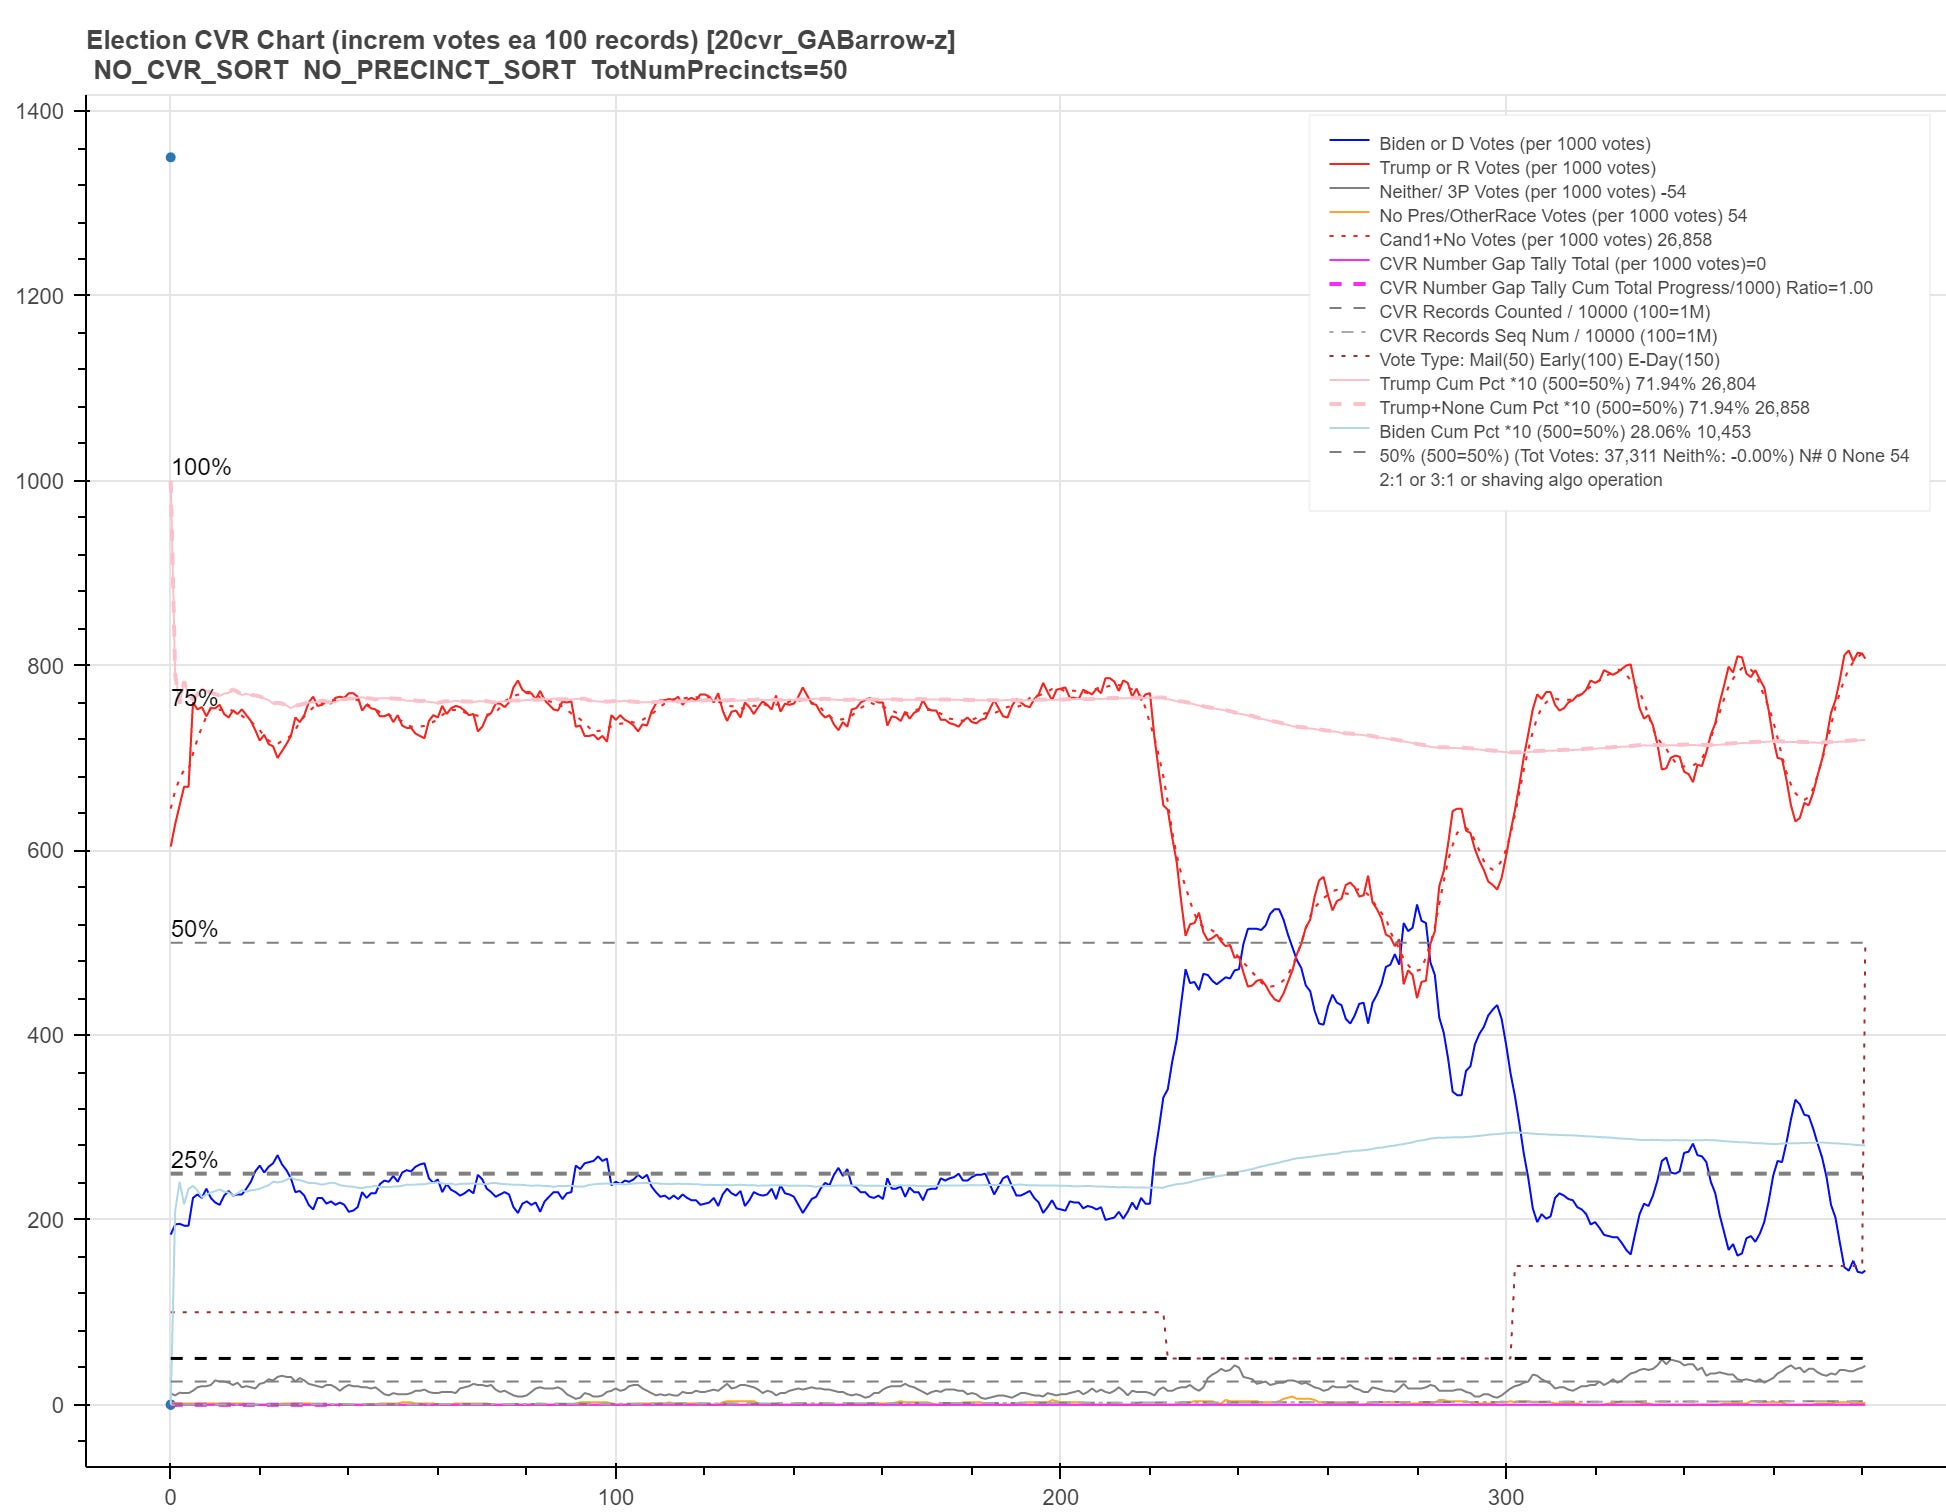
The dotted brown line is noted in the legend to indicate mail-in at value 50, early voting at value 100 and election day voting at value 150. So what do we see in the Barrow chart? We see early voting for over half the chart at almost a flat 75% Trump, followed by mail-in voting at about 50/50 and ending with with election day voting at about 70-75% Trump (and the percentages get less stable for election day as well).
Given that the mail-in waveform struggles to do better than 50% for Biden, this is another confirmation of my earlier math since Trump happens to be at 75% here otherwise.
And given the details of the waveforms this could also suggest that Pasco and Marion actually had this sequence of early vote/mail-in/election day counting like in Barrow even though there is no field for it in those Florida CVRs. So this is actually a possible alternative to my speculation in my Pasco post that the algos kicked in as they saw the 75% Trump cumulative level in play — there was just a lower amount of early voting perhaps.
And since Barrow seems to be a textbook lesson for us, let’s see if we can extract anything more with finer “slicing”. What if we create four clusters of counties based on their initial precinct digits?
The first cluster with over 9K records:
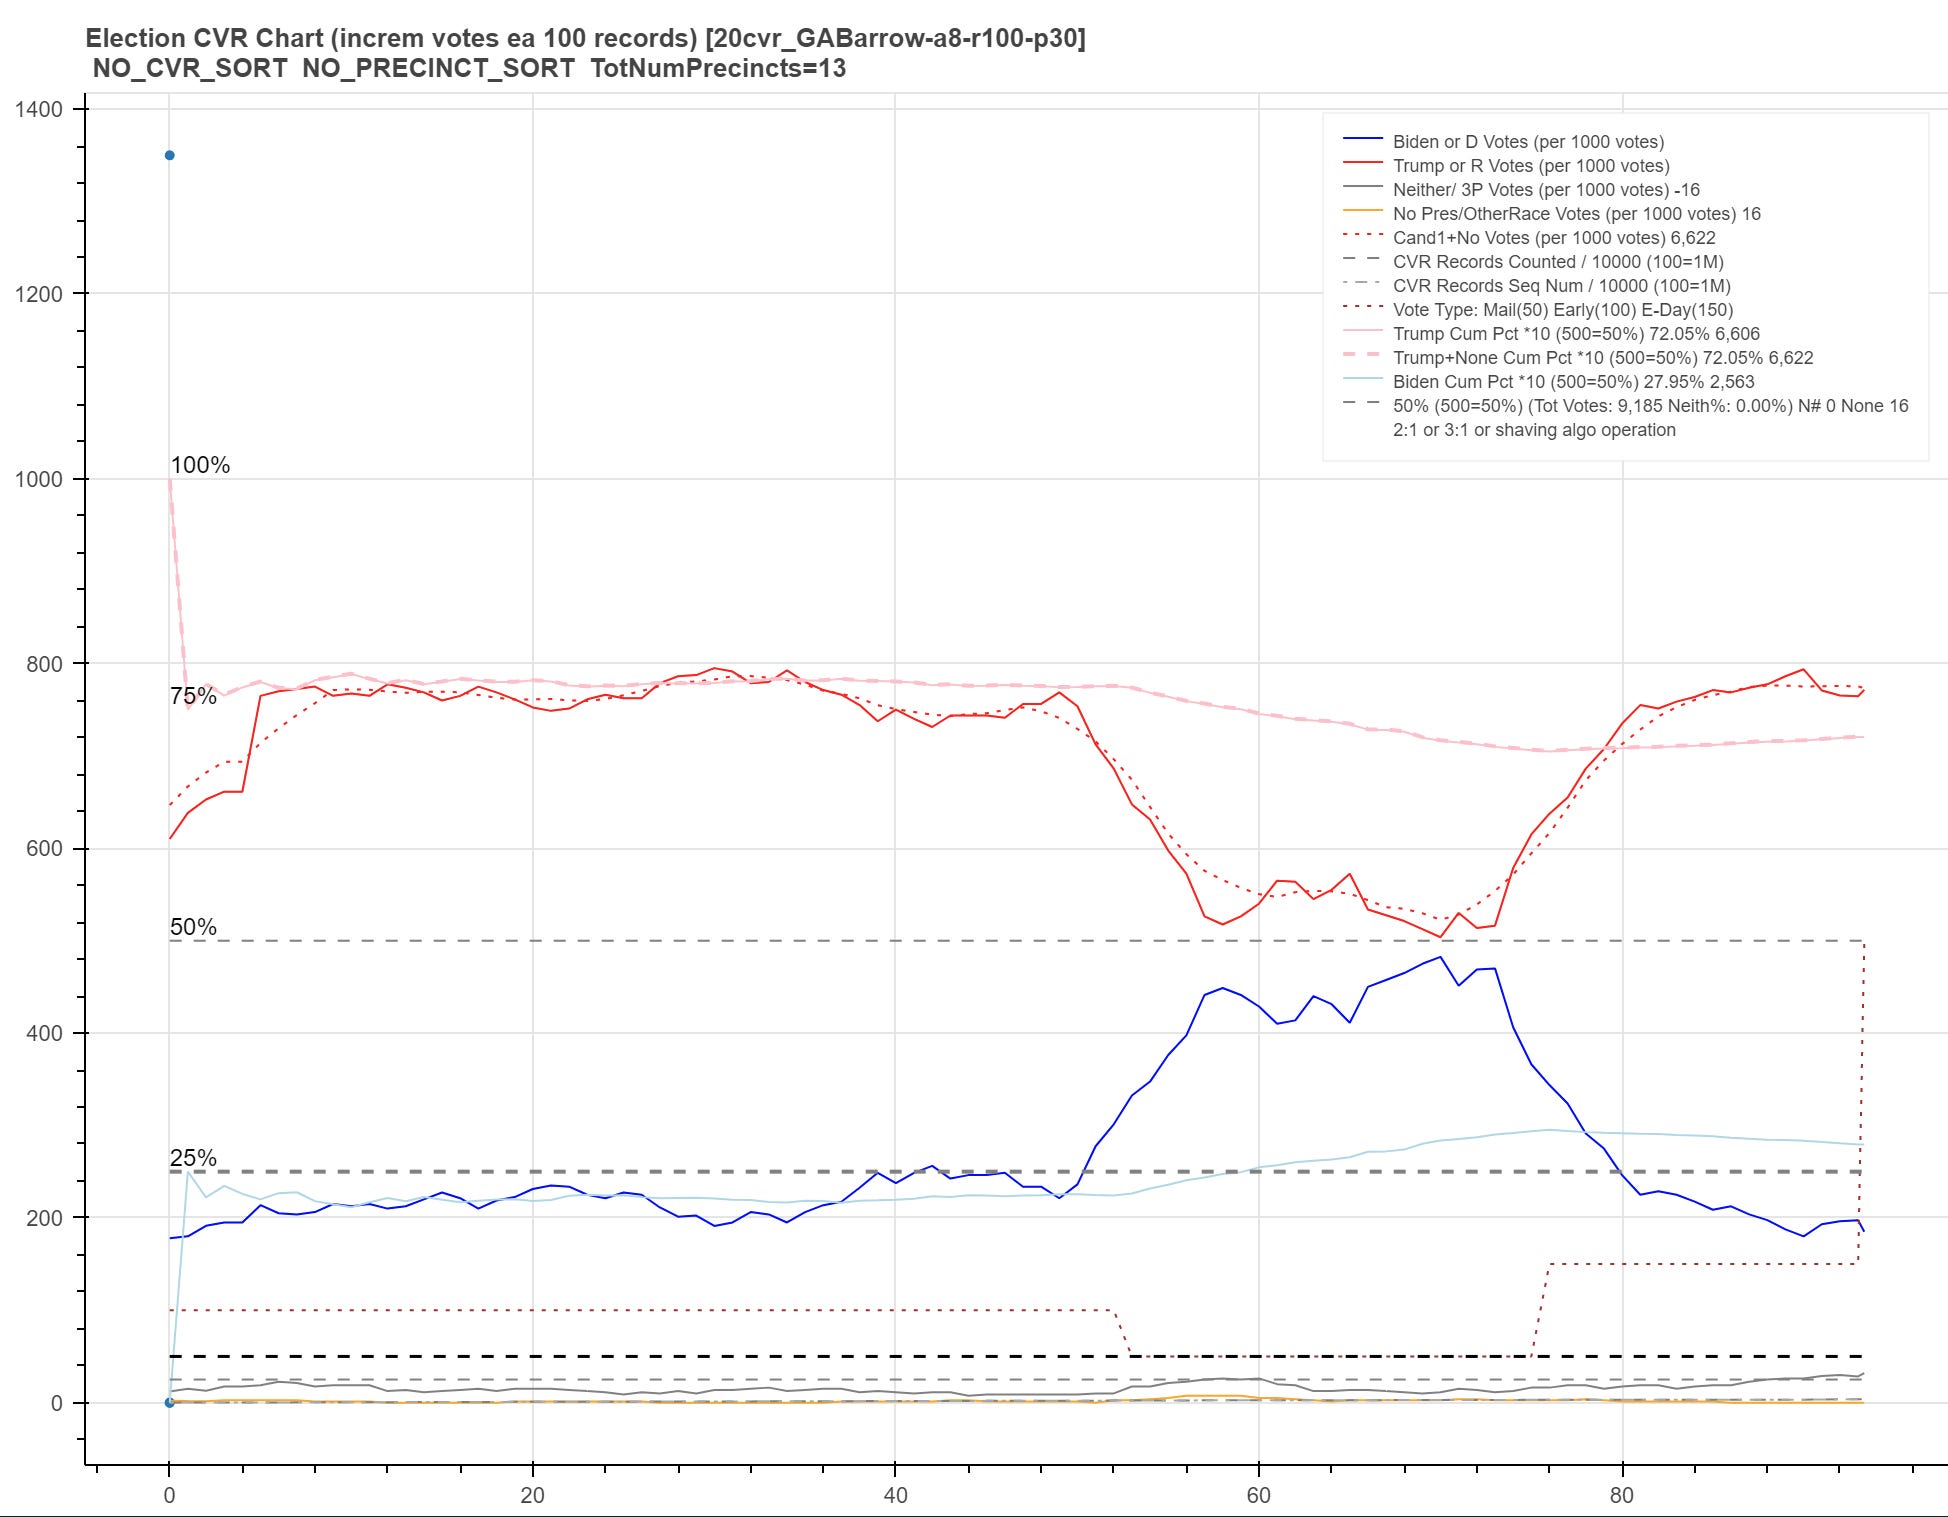
We are running a bit over 75% Trump in this cluster and we find that the algo running during mail-in can’t get Biden into the incremental lead. Check.
Next cluster of over 12K records:
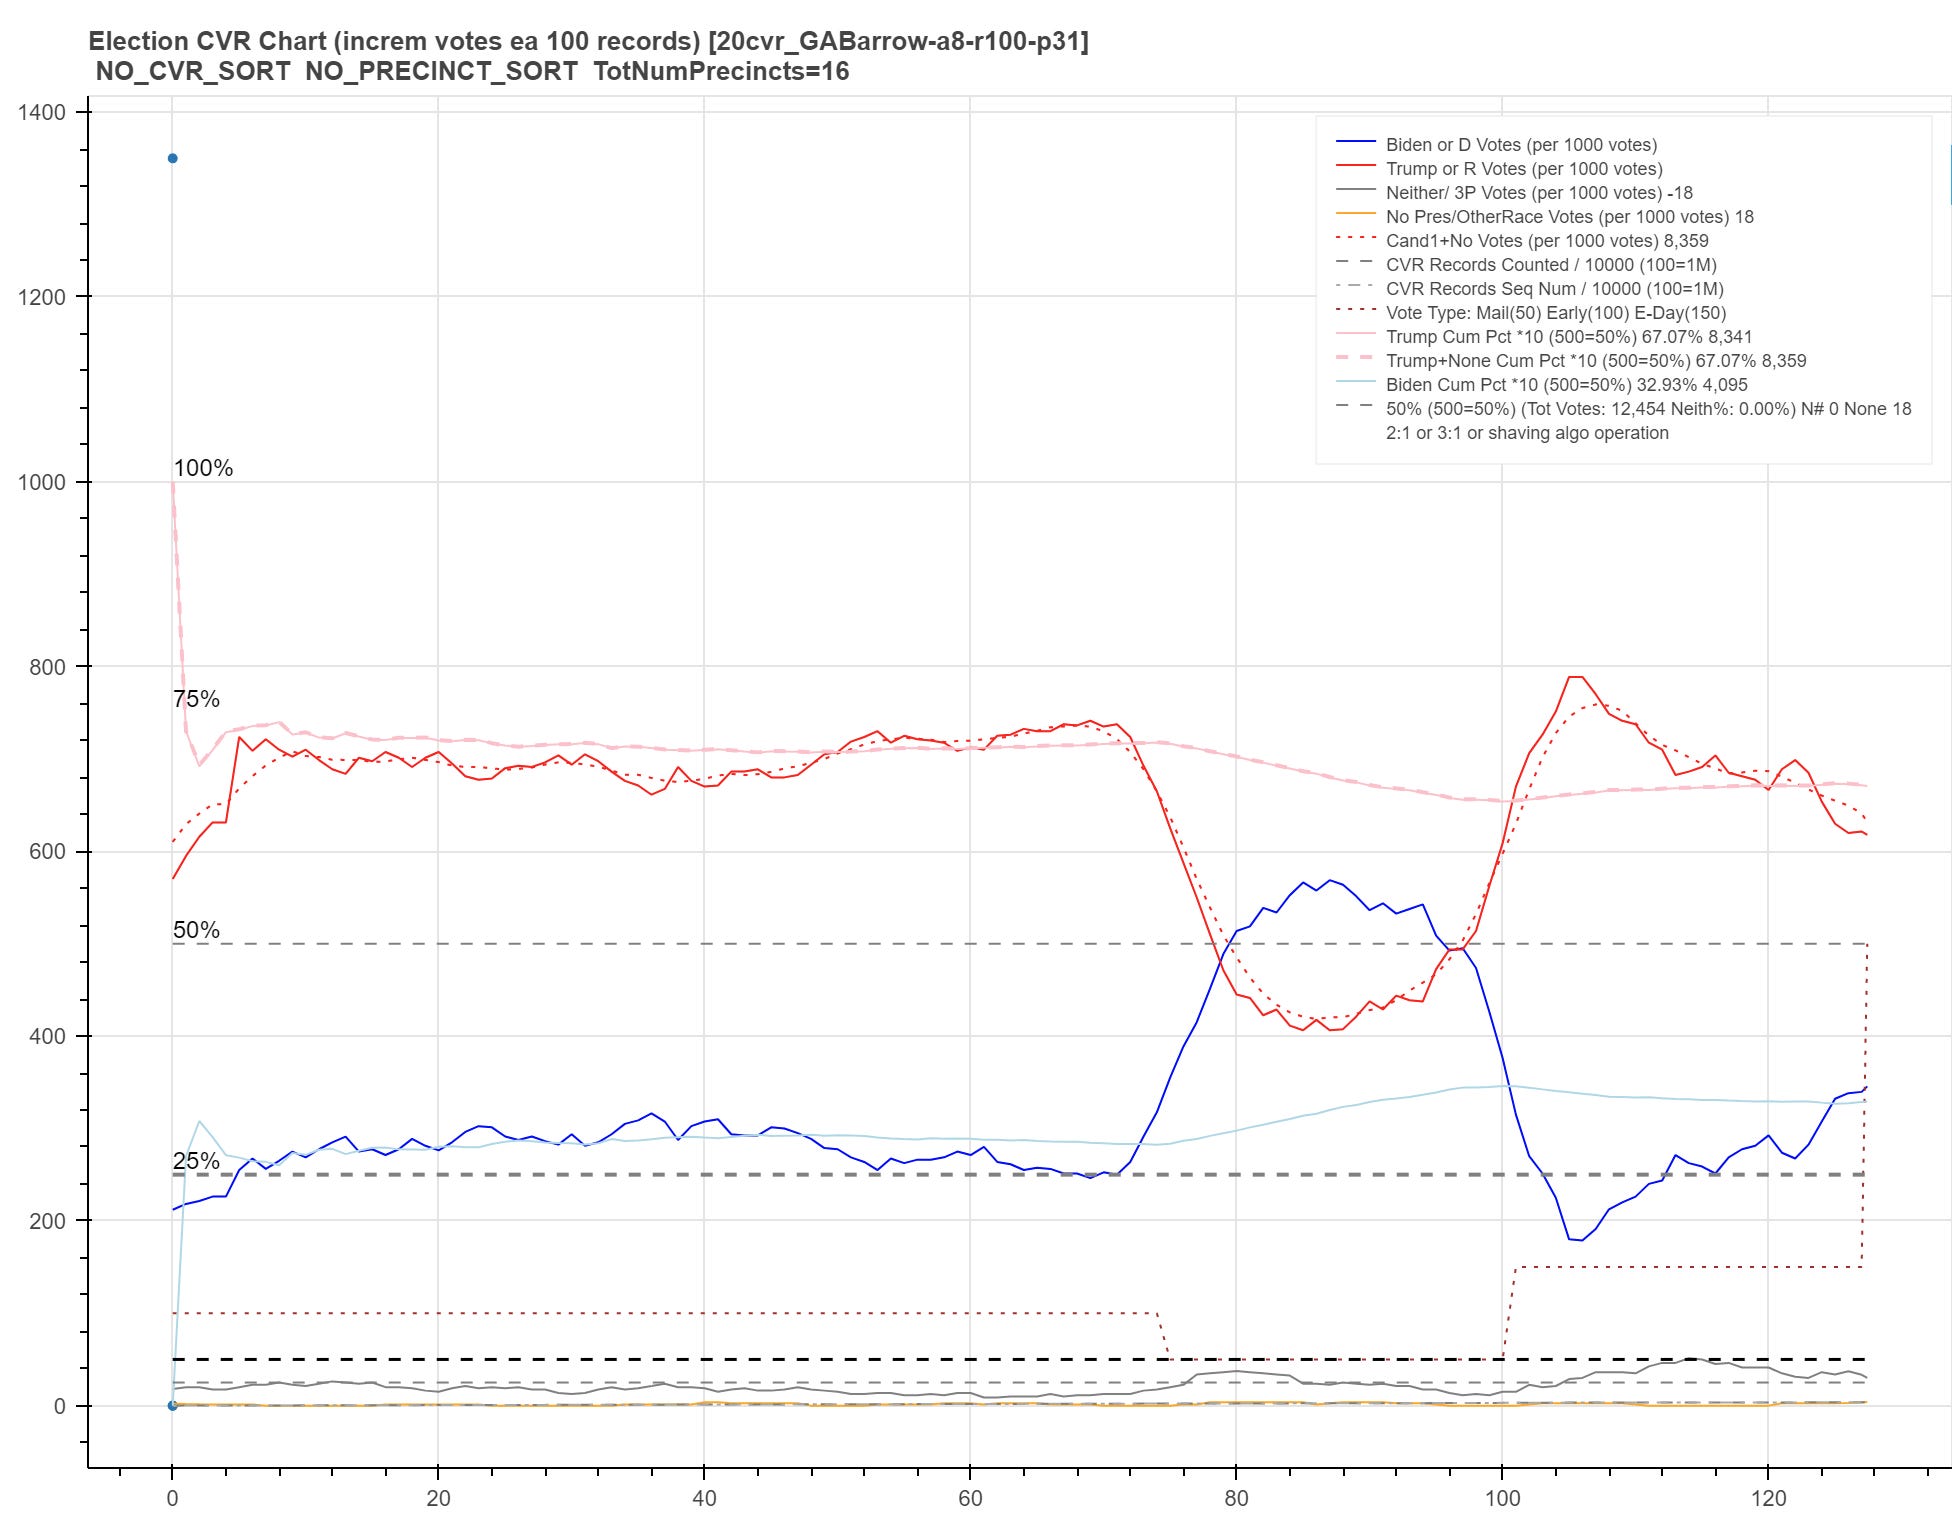
We are running a bit UNDER 75% Trump and we find that the mail-in phase algo CAN pull Biden into the incremental lead! Check.
Next cluster of 12K records:
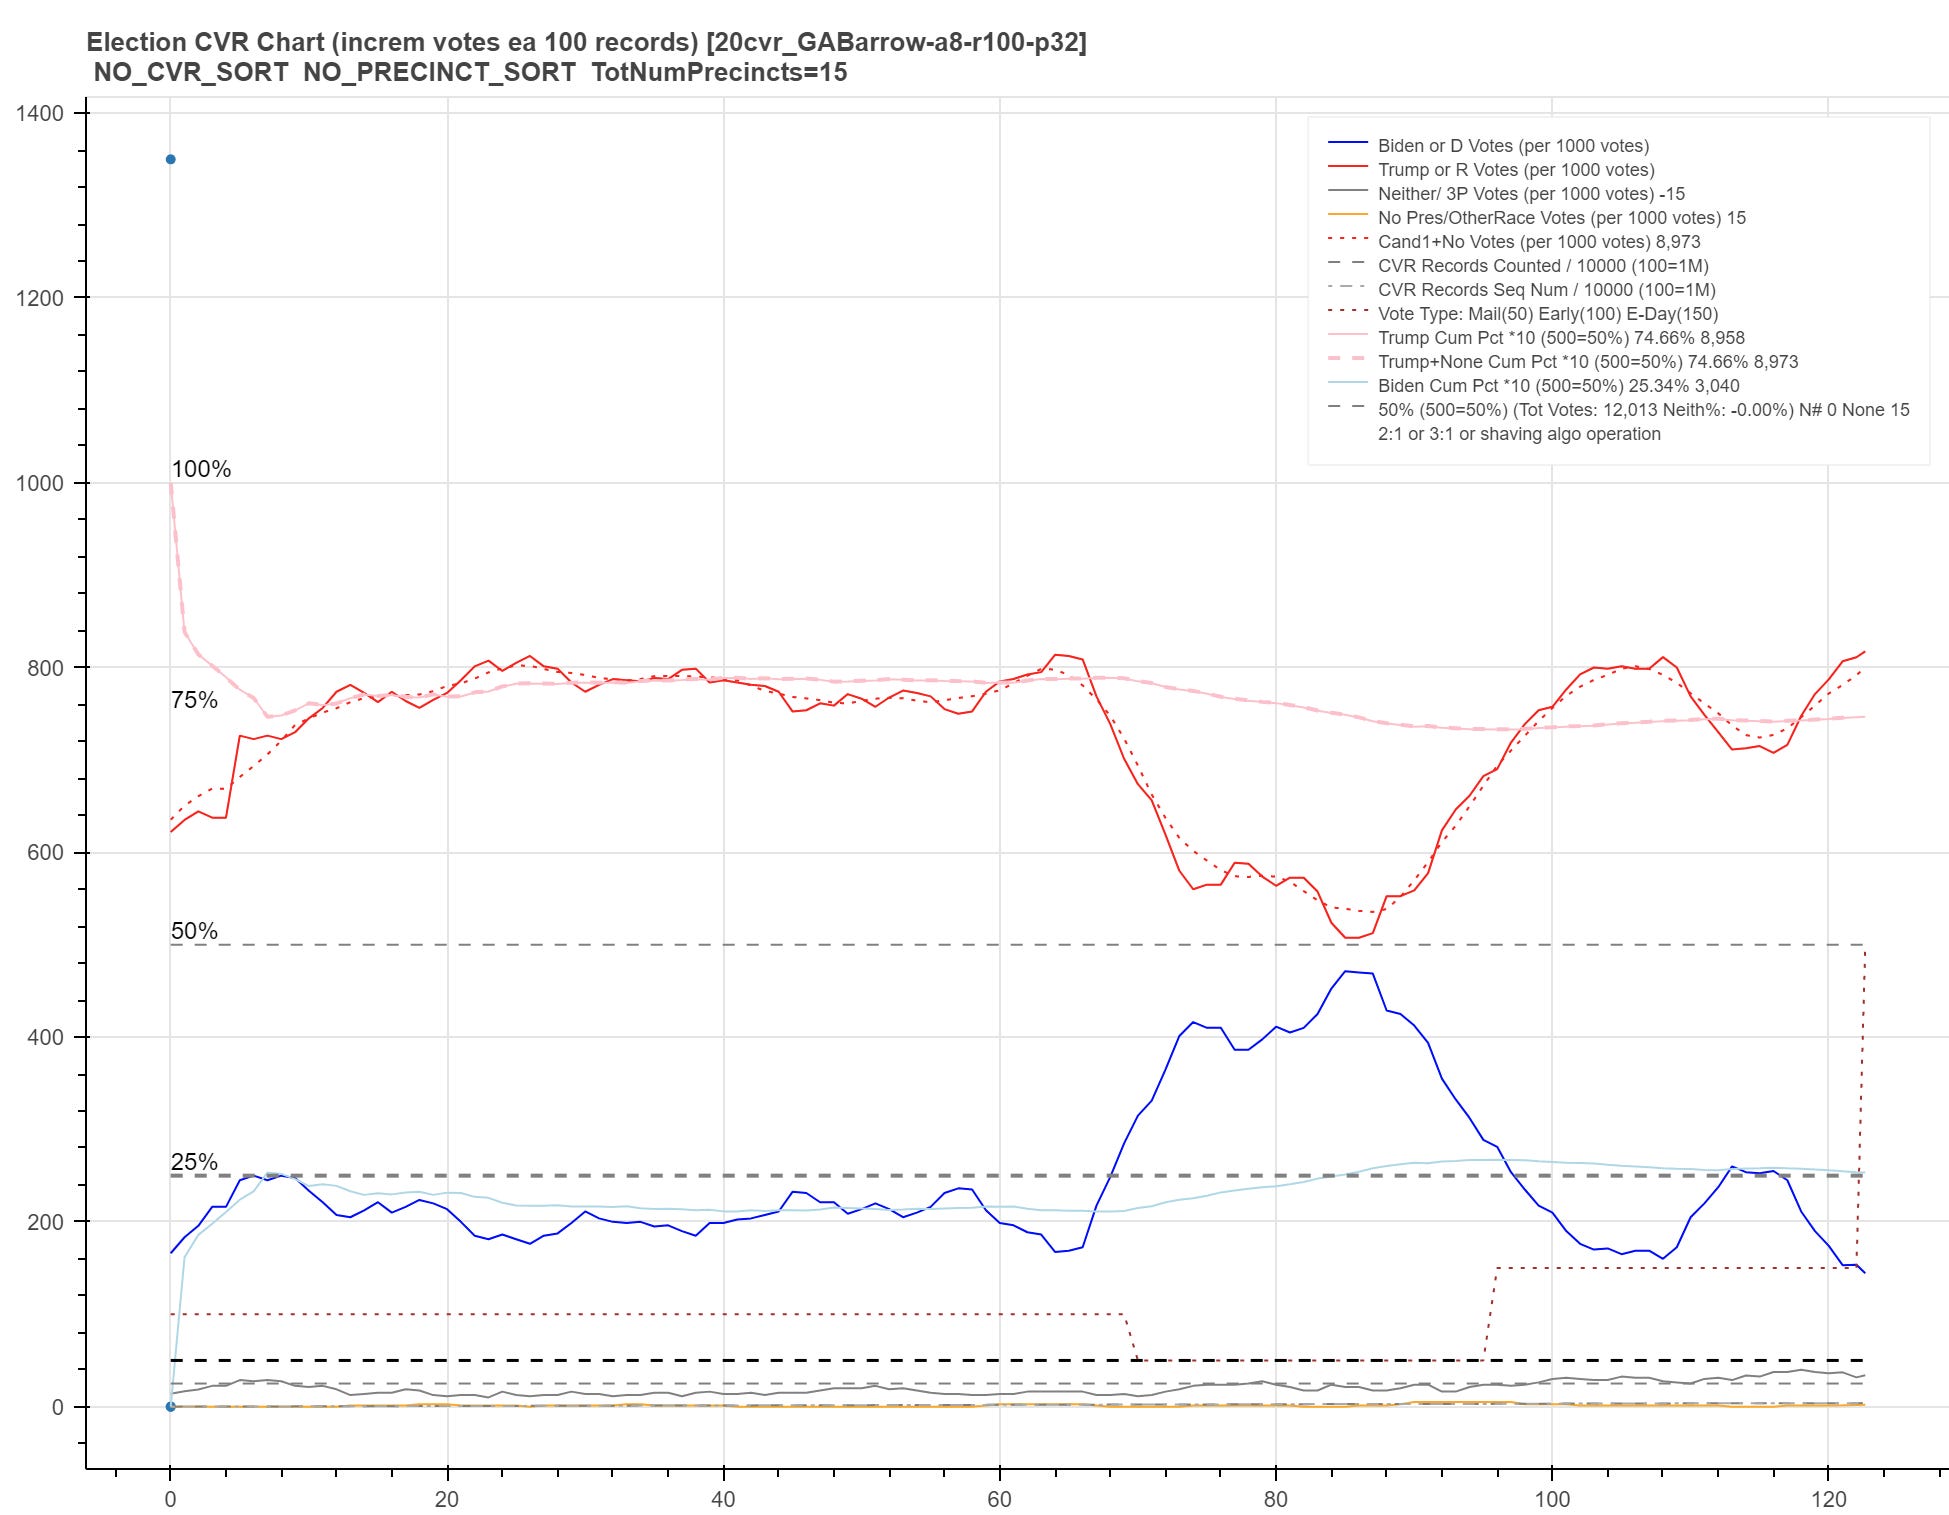
We are running very close to 80% Trump and once more find that mail-in phase CANNOT get Biden into the incremental lead. Check.
Last cluster of only 3K records:
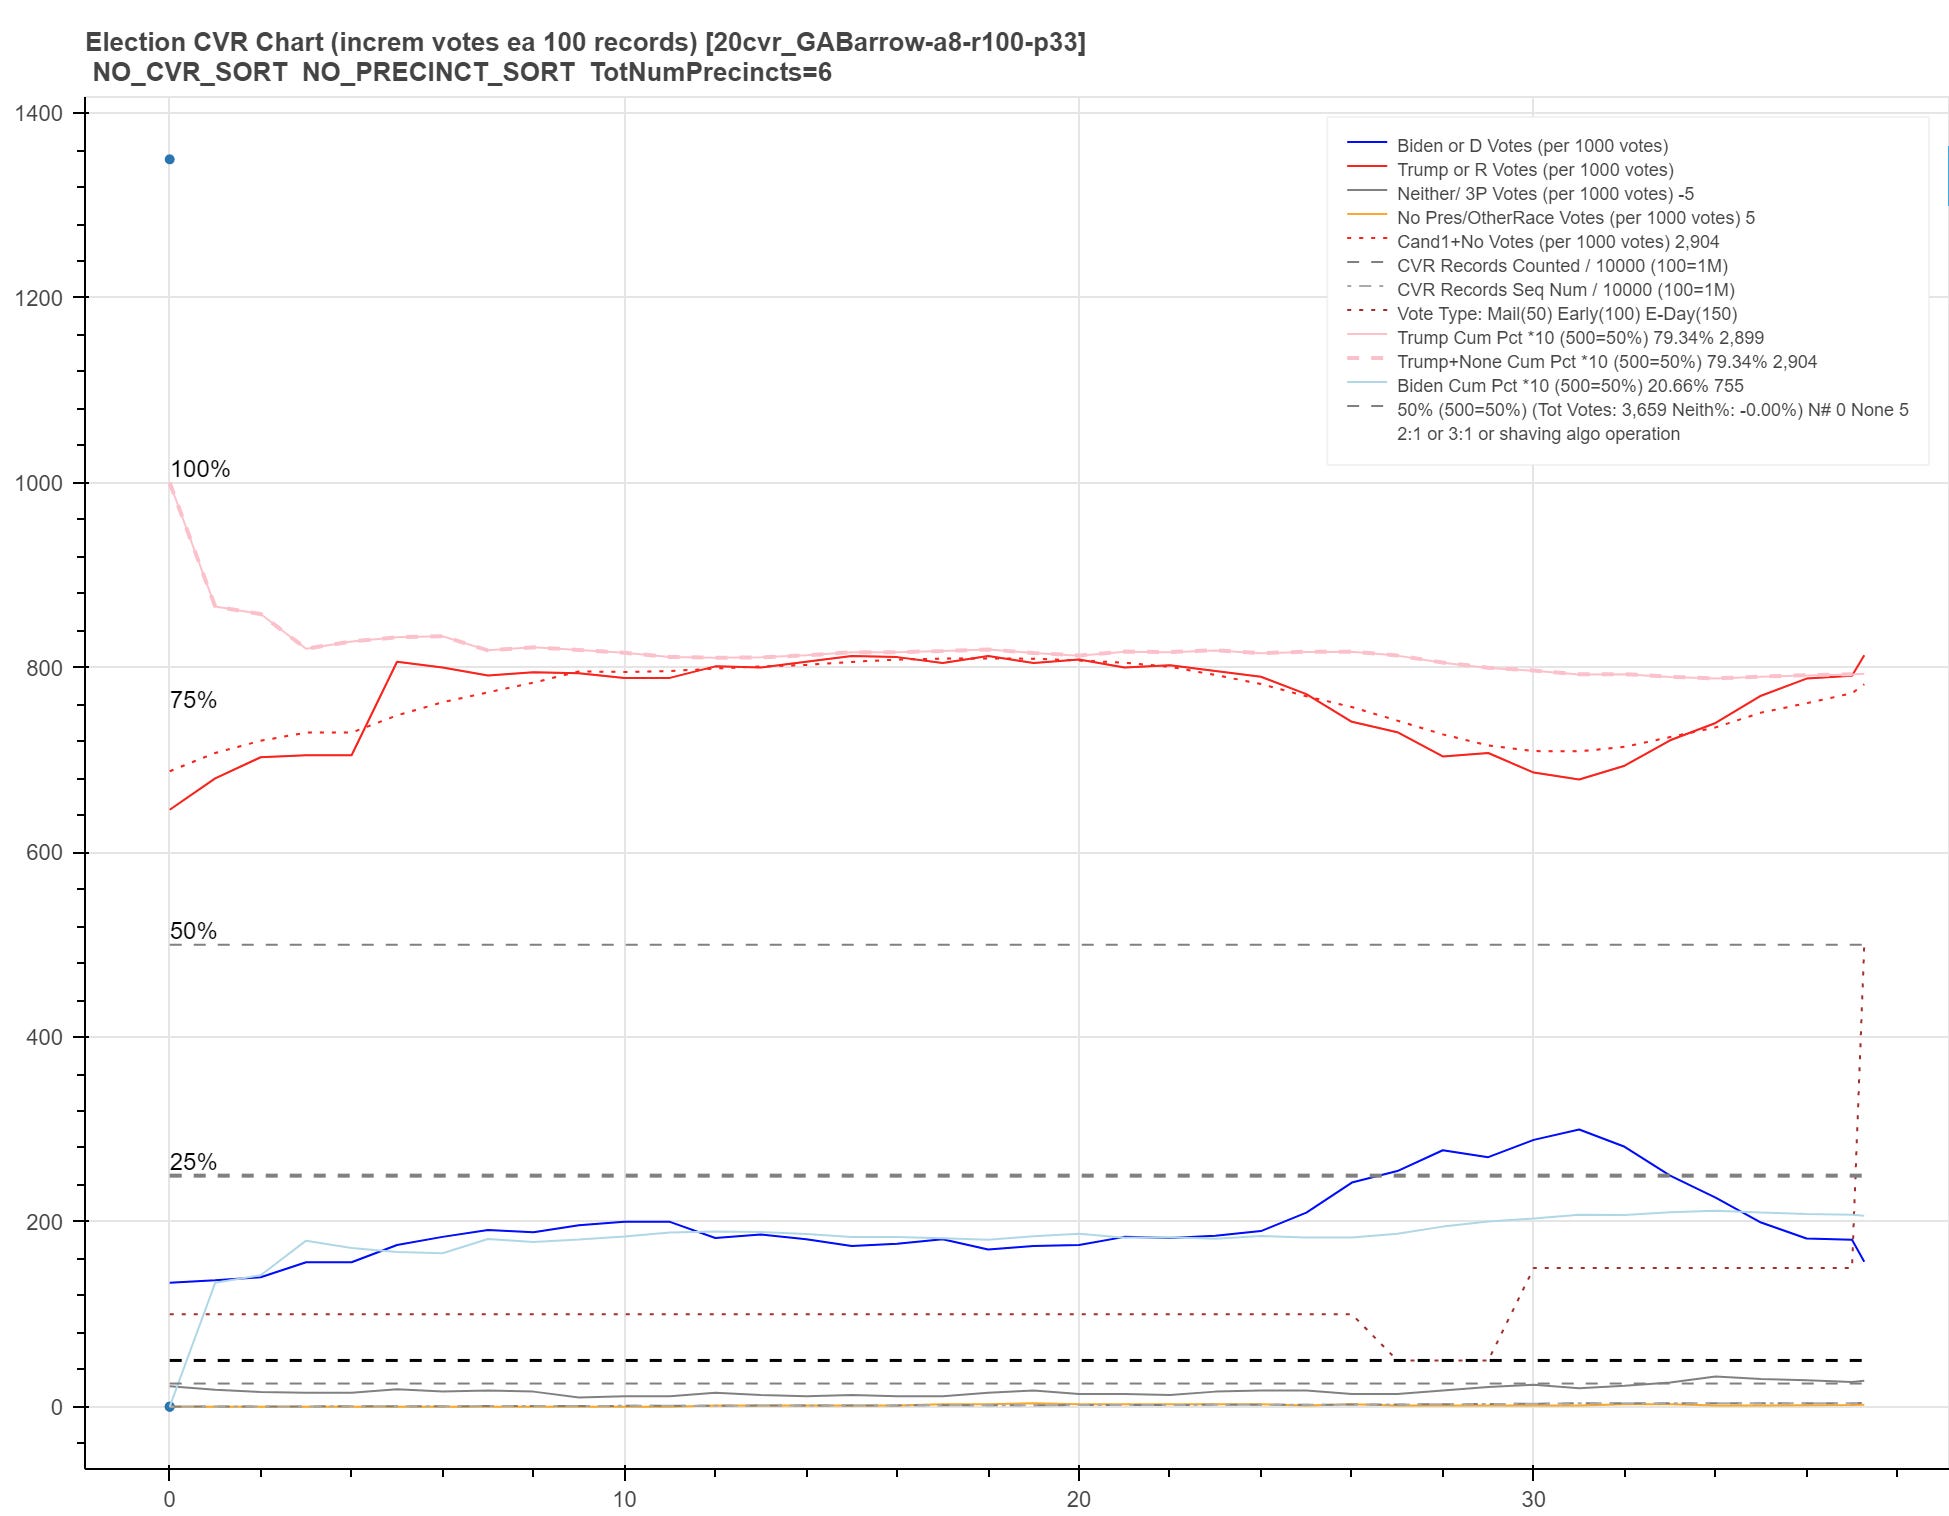
We are running perhaps closest to 80% Trump and the algo can barely affect anything at all due to the high percentage of Trump votes, small size of the cluster and the shortest relative amount of mail-in votes of all the clusters (together with the boxcar filter’s smoothing but even removing that leaves the same story). Check.
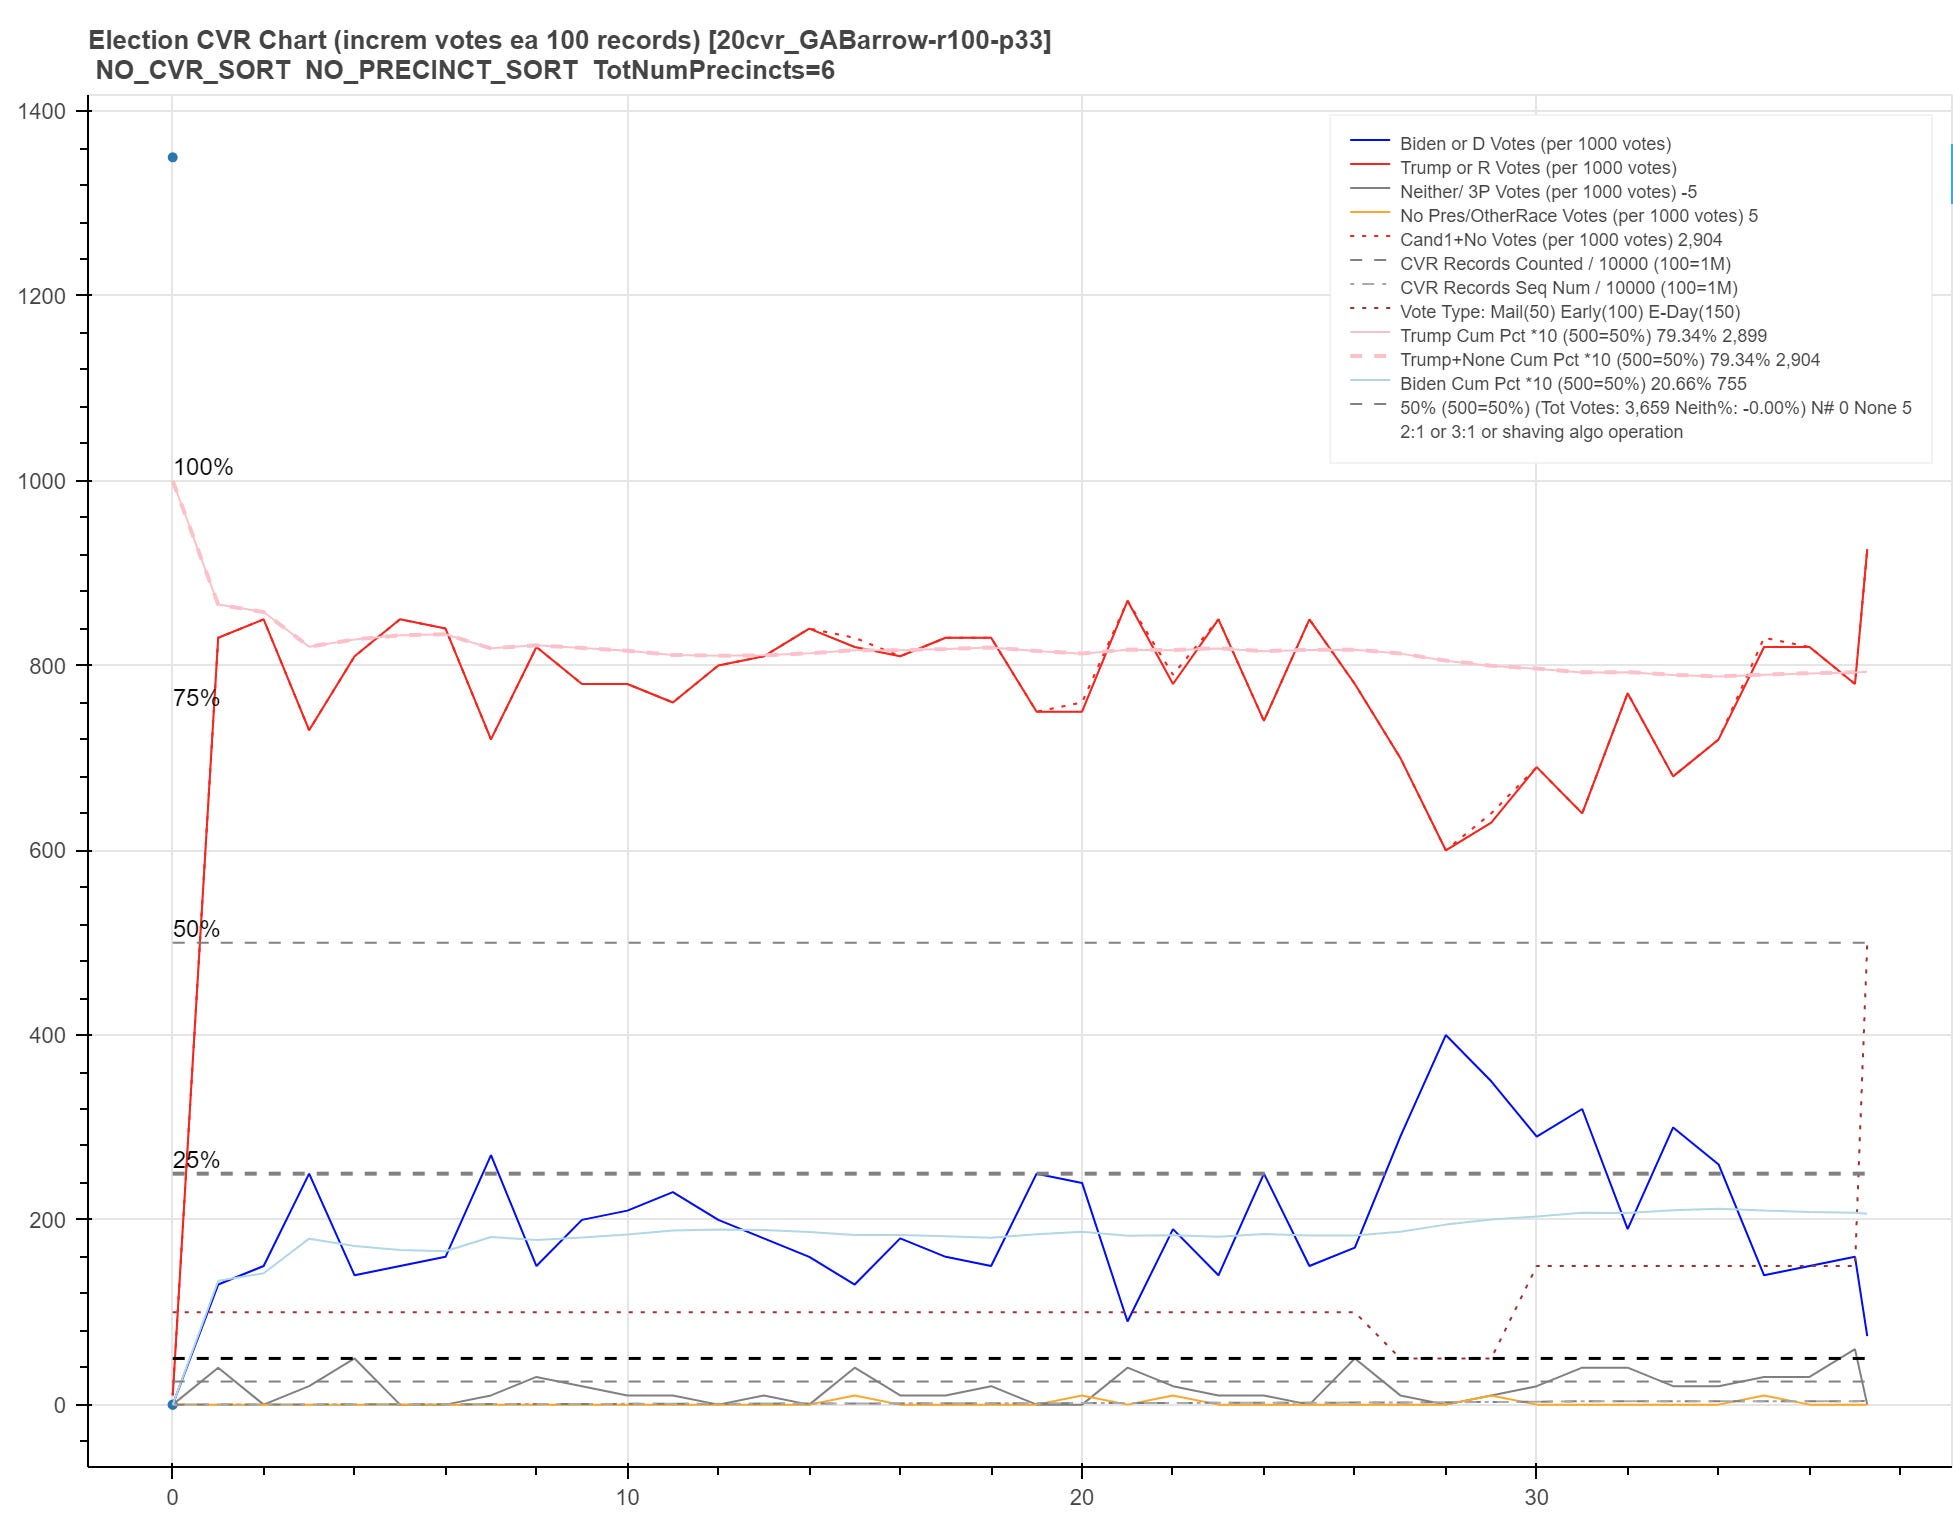
And note that even within a very high Trump vote percentage and relatively small county we can find vote percentage level variations by clusters but at the same time surprisingly flat overall vote percentage progress — the law of large numbers in action even with only 37K total records — other than when the algos are working.
No posts
Comments
Nothing yet. Say the first thing.
Sign in to join the conversation.