
Highs are led by AI/semiconductor tailwinds and cyclical/industrial strength — a classic “tech + cyclicals” rally signal.
Lows highlight differentiation: Software/growth stocks and China-exposed names lagging, with some profit-taking in big tech and weakness in defensives or high-valuation areas.
Market breadth is mixed but positive on the highs side (more tech-driven leadership). This is common in AI-fueled markets where leaders extend while others consolidate or correct.
The highs list shows broad strength in technology, semiconductors/AI infrastructure, industrials, financials/banks, and select consumer/REITs. Many entries show solid daily gains (2-15%+ in some cases) with notable volume in tech names.
Semiconductors, AI, and Tech Hardware/Infrastructure (dominant theme): Heavy concentration in chip-related names, AI plays, and related ETFs. Examples include:
TSMC (TSM), Applied Materials (AMAT), ASML, Lam Research (LRCX), Micron (MU), Intel (INTC), Marvell (MRVL), Arm Holdings (ARM), Broadcom-adjacent, Entegris, KLA, Diodes, Cohu, etc.
Leveraged ETFs and semiconductor-focused funds (e.g., Direxion Daily MU/TSM/ASML bulls, VanEck Semiconductor, iShares Semiconductor, First Trust Nasdaq Semiconductor).
Other tech/AI: Astera Labs, Credo Technology, Silicon Motion, Ultra Clean Holdings, TTM Technologies, Vishay, Western Digital, Seagate.
This aligns with ongoing AI optimism, memory boom, potential deals (e.g., Apple-Intel rumors in similar periods), and semiconductor expansion.
Industrials, Machinery, and Materials: Strong showing in Caterpillar (CAT), Crane, Cummins, Rockwell Automation, W.W. Grainger, Applied Industrial Technologies, Valmont, RBC Bearings, Carpenter Technology, Howmet Aerospace, Wabtec. Reflects infrastructure spending, industrial recovery, or cyclical strength.
Financials and Banks: JPMorgan (JPM), Goldman Sachs (GS), Morgan Stanley (MS), Bank of Montreal, BNY Mellon, State Street, Toronto-Dominion, Mitsubishi UFJ, Sumitomo Mitsui, plus various REITs/lodging (e.g., Apple Hospitality, RLJ Lodging, Ryman Hospitality, Xenia Hotels).
Consumer/Discretionary and Other: Golf/sports (Callaway), hotels/vacations (Marriott Vacations, Hyatt), SharkNinja, Victoria’s Secret, energy/infra plays, and various small/mid-cap or ETF gainers.
ETFs and Funds: Many thematic ETFs hitting highs, especially those tied to semis, emerging markets ex-China, momentum, AI/tech, and industrials.
Overall, highs reflect AI/tech/semiconductor leadership with spillover into broader industrials and financials, consistent with market breadth in a risk-on environment.
The lows list is more diverse but skewed toward software/tech/services under pressure, Chinese/ADR names, healthcare/biotech volatility, and select consumer/media. Many show negative daily moves or high volatility.
Software, IT Services, and Tech (notable weakness): Accenture (ACN), Salesforce (CRM), Adobe (ADBE), Intuit, Gartner, Guidewire, HubSpot, Tyler Technologies, SS&C Technologies, Blackbaud, Bentley Systems, Cognizant, ExlService, Pegasystems, Trade Desk. Some big-name tech facing profit-taking or growth concerns.
Chinese/ADR and Emerging Markets Exposure: Heavy in names like PDD Holdings, Trip.com, Li Auto, XPeng, Kingsoft Cloud, Weibo, Full Truck Alliance, MINISO, Baidu-related, iShares MSCI China ETF, plus various small Chinese firms. Reflects ongoing China-specific risks, regulatory concerns, or macro pressures.
Healthcare, Biotech, and Pharma: Alnylam, Boston Scientific, Gartner-adjacent health, various small biotechs (e.g., Humacyte, Imunon, Enlivex, FibroBiologics), and services like Maximus, Leidos.
Consumer, Media, and Telecom: Albertsons, Chewy, Kroger, Comcast, Charter, Fox, Nexstar, Western Union, AT&T.
Other/Volatility Plays: Many low-priced/penny stocks, SPACs, warrants, leveraged ETFs (especially bearish or volatile ones on popular names), REITs/debt prefs, and crypto/digital asset-related funds showing weakness.
ETFs/Funds: Various income, emerging markets, or sector-specific funds under pressure.
The current market environment presents a classic “divergence” scenario where headline index strength masks a developing erosion in internal breadth. While the S&P 500 remains near its highs, several key indicators—most notably the New Highs - New Lows and the McClellan Oscillator—are signaling a loss of momentum. The bullish “buying stampede” seen in early April has transitioned into a more selective and cautious phase, with short-term breadth metrics like the % Above 20MA pulling back significantly from overbought extremes.
Despite these short-term warning signs, the market’s structural foundation remains intact, as evidenced by the % Above 200MA and Advance/Decline Line continuing to hold healthy levels. This suggests that while the market may be overdue for a period of consolidation or a minor “reversion to the mean” correction, the primary long-term uptrend is not yet under immediate threat. Investors should maintain a constructive but defensive posture, focusing on quality leadership as the broader market participation begins to thin out.
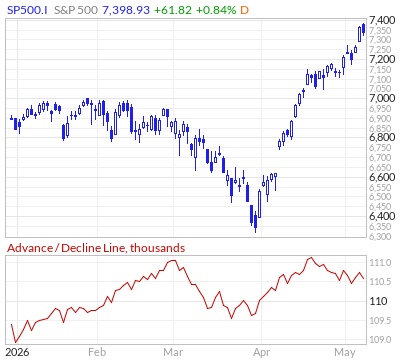
The Advance/Decline (A/D) Line is currently exhibiting a constructive profile, broadly confirming the price action seen in major indices like the S&P 500. Since the early April lows, the A/D Line has made a series of higher highs and higher lows, suggesting that the current uptrend is supported by a healthy majority of stocks rather than being driven by a narrow group of mega-cap leaders.
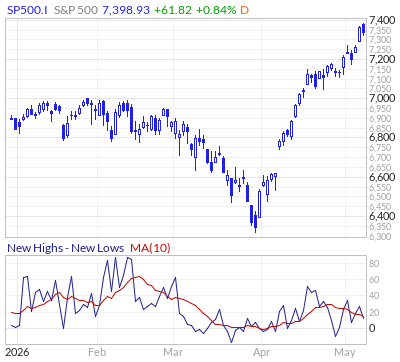
The New Highs - New Lows indicator is currently one of the more concerning breadth metrics. While the net number remains positive—meaning bulls are still technically in control—the indicator is making a series of lower highs while the S&P 500 makes higher highs. This is a classic bearish divergence.
This divergence suggests that the “leadership” of the market is narrowing. Fewer stocks are managing to break out to new 52-week highs, even as the index itself hits new records. Historically, this type of internal erosion often precedes a more significant market peak.
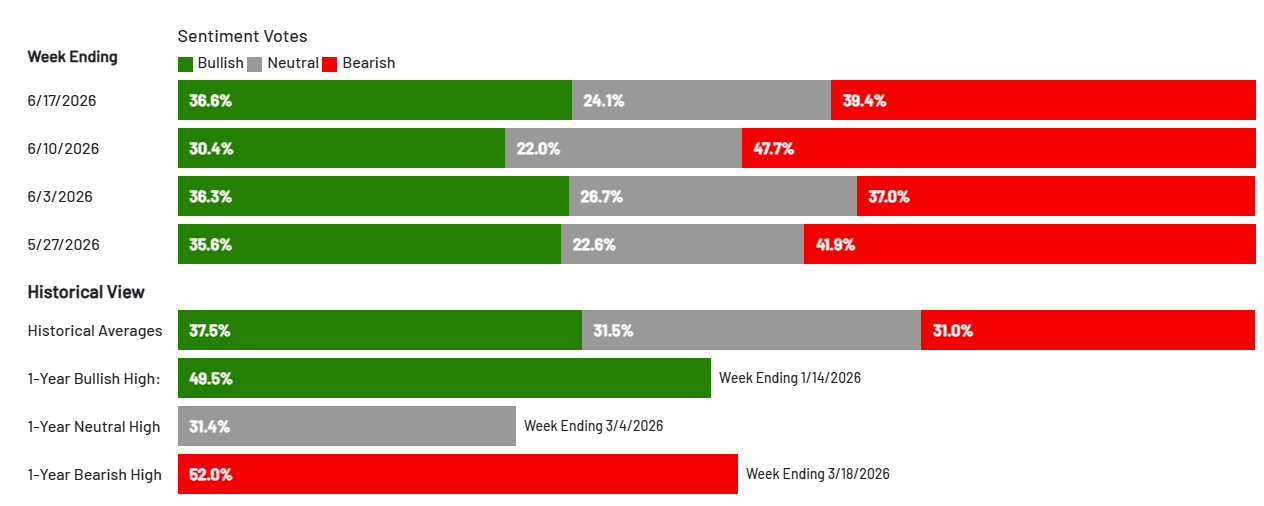
The market is still not 40% bullish yet.
*This my personal blog and is not investment advice—I am not a financial advisor but a random person on the internet who does not have a license in finance or securities. This is my personal Substack which consists of opinions and/or general information. I may or may not have positions in any of the stocks mentioned. Don’t listen to anyone online without evaluating and understanding the risks involved and understand that you are responsible for making your own investment decisions.
The AI Cost Crisis narrative can pose a risk to the massive IPO ambitions of OpenAI and Anthropic and their rich valuations (which will impact companies like ORCL 0.00%↑ AMZN 0.00%↑ , etc. who depend on Anthropic and OpenAI to buy from them), as enterprise customers push back against soaring costs just as the companies court public markets. OpenAI’s losses ballooned from $5B in 2024 to $38.5B in 2025, and cheaper Chinese models (often a fraction of the cost) plus mediocre ROI reports (40% of firms seeing <10% savings) are accelerating this cost crisis against Frontier Labs.

Financial Times@FT
Companies that raced to put AI tools in the hands of their workers are starting to rein in their use, as the cost of deploying the technology at scale begins to test corporate budgets. ft.trib.al/WYyRlXA

11:00 AM · Jun 19, 2026 · 279K Views
48 Replies · 208 Reposts · 616 Likes

Bull Theory@BullTheoryio
THIS IS ABSOLUTELY INSANE. A company's AI bill jumped 700% in a single day because Anthropic changed how it charged for AI usage. Workato had been paying one flat monthly fee to use Anthropic's AI. In May, Anthropic moved them to pay per token pricing, where every single prompt
7:41 AM · Jun 20, 2026 · 93K Views
106 Replies · 210 Reposts · 1.01K Likes
Meanwhile, the pick and shovels of the AI Infrastructure boom are the ones who are really winning

Thierry from arvy 🇨🇭@ThierryBorgeat
And the final tell. The money arrived all at once. Semiconductor ETFs just took in the largest weekly inflow on record. A spike that dwarfs everything in the chart's history, including 2021 and 2022. This is what tops are made of. Not weakness, euphoria. Record price, record


Thierry from arvy 🇨🇭 @ThierryBorgeat
And here's where the chips actually are in the move. Pull up the long-term semiconductor chart. You can count three phases. A long, orderly uptrend off the 2019 base. Then a steeper acceleration. Then this, the near-vertical final leg, price detaching from its own trendline. https://t.co/CmsJ55aP0N
7:20 PM · Jun 19, 2026 · 266K Views
105 Replies · 240 Reposts · 1.32K Likes
Inflation expectations are falling fast—which is good new for the Fed on top of the Iran War ceasefire deal.

Hedgeye@Hedgeye
U.S. inflation expectations are collapsing

12:21 AM · Jun 19, 2026 · 162K Views
57 Replies · 245 Reposts · 1.34K Likes
AMZN 0.00%↑ is a solid long-term buy and hold (I am already long and it’s my Top 3 position)

Oguz Erkan@oguzerkan
$AMZN CEO: “If our chip business was a standalone business, and sold chips to AWS and third parties, its annual run rate would be $50 billion.” He said this in Q1 earnings call and now they are doing it. You aren’t bullish enough on $AMZN


Evan @StockMKTNewz
Amazon $AMZN is in talks to sell its custom-made AI chips for use in other companies’ data centers - Bloomberg
7:56 PM · Jun 18, 2026 · 45K Views
12 Replies · 39 Reposts · 314 Likes
Trainium already has huge revenue growth for Amazon.

Fireside Alpha@firesidealpha
Right on cue. Gavin Baker (@GavinSBaker, Atreides) was asked recently which chip was most underrated and where consensus was wrong. His reply: "Trainium by far. Trainium is going to be to 2026, especially in the 2H of this year when Trainium 3 really ramps, as TPUs were to

Wall St Engine @wallstengine
Amazon is seeing more interest in its Trainium and Inferentia chips as companies look beyond a single-vendor Nvidia GPU strategy, per The Information. The main appeal is cost, with some inference workloads reportedly up to 80% cheaper vs H100s. Amazon is also discussing ways to
7:31 PM · Jun 17, 2026 · 161K Views
6 Replies · 20 Reposts · 405 Likes

Wall St Engine@wallstengine
Amazon is seeing more interest in its Trainium and Inferentia chips as companies look beyond a single-vendor Nvidia GPU strategy, per The Information. The main appeal is cost, with some inference workloads reportedly up to 80% cheaper vs H100s. Amazon is also discussing ways to

5:06 PM · Jun 17, 2026 · 169K Views
12 Replies · 25 Reposts · 205 Likes
NVDA 0.00%↑ is going to continue to dominate due to their extreme co-design tech competitive advantage and CUDA moat and will reach $10 trillion market cap

Ben Pouladian@benitoz
For 3 years, consensus said inference was where NVIDIA’s moat would crack. Training was hard. Inference was “easy.” Cheap custom ASICs would eat it. Then the actual market showed up. NVIDIA inference share: Q1 ’25: 66% April ’26: 74% The moat didn’t break. It widened. The
10:23 PM · Jun 15, 2026 · 25.5K Views
14 Replies · 38 Reposts · 192 Likes
RBLX 0.00%↑ (I have been long and current avg cost basis is $59)

TrendSpider@TrendSpider
For the daredevils... $RBLX

5:45 PM · Jun 20, 2026 · 52.2K Views
30 Replies · 28 Reposts · 414 Likes
TrendSpider@TrendSpider
Insiders sell for a million reasons, but they only buy for one... $SOFI

3:30 PM · Jun 19, 2026 · 91.9K Views
41 Replies · 70 Reposts · 963 Likes
MSFT 0.00%↑ levels are attractive for long-term accumulation

Vebjørn | VJN@VJNCapital
$MSFT just keeps plummeting while fundamentals have never looked better Analyst consensus: - Revenue growth: 15.8% - 17.6% - 19% - 2029 net margin: 37.4% - PE stays at 10 year lows Results in 3 years: - Stock price of $585 (current $379) - Total return of 54% (15.6% annualized)
3:12 PM · Jun 20, 2026 · 15.1K Views
24 Replies · 8 Reposts · 221 Likes
Could AI like GLM 5.2 that is “good enough” cause this AI bubble to pop?
Frontier labs have commanded enormous valuations (Anthropic reached ~$965 billion post-money in May 2026; OpenAI in a similar ballpark) based on the assumption that their closed models would maintain a durable lead in capability, combined with high-margin API/subscription revenue. GLM 5.2 (and the rapid progress in other Chinese open models like those from DeepSeek/Qwen) shows that high-performance base models are becoming commoditized. When a model this capable is free to download and run locally (or dirt-cheap via API), it undercuts the pricing power of closed providers. Enterprises already talking about canceling or reducing Anthropic/OpenAI spend in favor of cheaper alternatives is a direct revenue threat.
If revenue doesn’t follow these trillion-dollar AI bets—especially with open models like GLM 5.2 delivering frontier results at a fraction of the cost—the narrative could flip fast from hype to hard questions about the bubble

Brian Roemmele@BrianRoemmele
“…we will cancel all Anthropic license the end of this next quarter”—head of tech, Fortune 500 company With a few days of client usage some that have over 1000 employees using it, I can confirm that GLM 5.2 has created a big issue for Anthropic and their Mythos fear marketing.


Brian Roemmele @BrianRoemmele
F R E E — OPEN SOURCE GLM 5.2 BEATS ANTHROPIC MYTHOS! NO “GUN LICENSE NEEDED” We have been testing for hours the moment GLM 5.2 was released and we are absolutely blown away. While Anthropic is embarrassing world leaders with what history will see as the P. T. Barnum Carnival https://t.co/U81V0OZKun
2:30 PM · Jun 20, 2026 · 80.1K Views
56 Replies · 99 Reposts · 735 Likes
I agree with this assessment below regarding the Fed Meeting—any market weakness from the narrative of a “hawkish Fed” will provide buy the dip opportunities. Kevin Warsh is reducing the Fed’s influence on markets by reducing Forward Guidance. And he’s shifting more to allow the free markets to be more data-dependent so the Fed uses the market as a key data point to economic data vs telegraphing moves far in advance.
This is extremely bullish because it allows the Free Markets to MORE of the heavy lifting in pricing in expectations. The Fed can be more FLEXIBLE and not have to lock itself into paths that could become outdated based on the data.
However, this potentially reduces the “Fed-put” which means there will be less hand-holding and assurances from the Fed to markets.
This likely will cause more data-driven dramatic market swings—so a REALLY STRONG JOBS REPORT or INFLATION PRINT can cause a more significant market sell off than we are used to seeing under Powell since the market will expect the Fed to raise rates more aggressively based on the hotter than expected data.

THE SHORT BEAR@TheShortBear
I do not see today’s Fed meeting as hawkish. A few things stood out from the Fed meeting, despite the hawkish dot plot. Warsh was selected to try to cut rates and be dovish. Given where yields are, starting out fully dovish and potentially exacerbating inflation prints through
10:28 PM · Jun 17, 2026 · 124K Views
71 Replies · 64 Reposts · 725 Likes
AI Memory Supercycle—which is clearly reflected in the bullish options flow data below.

WOLF@WOLF_Financial
THE AI MEMORY MARKET IS PROJECTED TO HIT $945 BILLION IN OPERATING INCOME BY 2029 For context, the entire market was basically flat from 2015 to 2023. Then the AI race ignited in late 2023 and everything changed. Here is where analysts see the three memory giants by 2029: -

12:05 AM · Jun 21, 2026 · 8.02K Views
4 Replies · 10 Reposts · 51 Likes
Comments
Nothing yet. Say the first thing.
Sign in to join the conversation.