
Executive Summary
Bitcoin’s power-law growth has been extensively studied, but less attention has been paid to the structure of the residuals around that trend. Previous work identified a log-periodic component in Bitcoin price, suggesting the presence of discrete scale invariance (DSI) with a preferred scaling ratio near a log periodic spacing parameter λ ≈ 2.
And in this article last week
I identified clear power law behavior for both Realized Cap and Realized Cap per Bitcoin, with the latter having a power law exponent of 5.81 and R2 = 0.965.
The new result presented here is that the same log-periodic structure seen in Bitcoin price residuals, after removing the power law, appears in Realized Capitalization per Bitcoin (RC/BTC), a fundamentally different measure representing accumulated capital commitment rather than market valuation.
Using daily Coin Metrics Community Data (Creative Commons Attribution License) data through 2026, RC/BTC residuals exhibit a dominant log-periodic frequency near ω ≈ 8.8, corresponding to λ ≈ 2.04, virtually identical to values previously measured in Bitcoin price. A simple log-periodic model explains roughly 44% of the residual variance around the RC/BTC power law.
Wavelet analysis further reveals that the dominant frequency evolves smoothly through time rather than remaining perfectly constant. Most importantly, cross-wavelet analysis shows that price residuals and RC/BTC residuals share the same DSI structure and remain strongly phase-locked. Short-term movements are led by price, while longer-horizon causality runs in both directions, consistent with a delayed feedback system linking market valuation and trust-capital accumulation.
The implication is that Bitcoin’s famous boom-bust cycles may not originate solely in price. They appear to be embedded within the capital formation process itself.
Introduction
Previous work established that Bitcoin price follows a power law and exhibits residual log-periodic structure consistent with discrete scale invariance (DSI). More recently, Realized Capitalization and Realized Capitalization per Bitcoin were shown to follow their own power laws, suggesting that Bitcoin’s accumulated trust capital grows according to a similar scaling process. The question addressed here is whether the oscillatory component is unique to market valuation or whether it is also embedded in the underlying capital formation process itself.
Table 1. Log-Periodic Parameters
Series ω λ R²
Price 8.80 2.04 0.44
RC Total 8.79 2.04 0.431
RC/BTC 8.80 2.04 0.439
Table 1. Compares the Lomb-Scargle ω, λ values for Bitcoin price, total realized cap and realized cap per Bitcoin. In each case the suggest the fundamental model explains nearly half of the residuals.
Key Findings
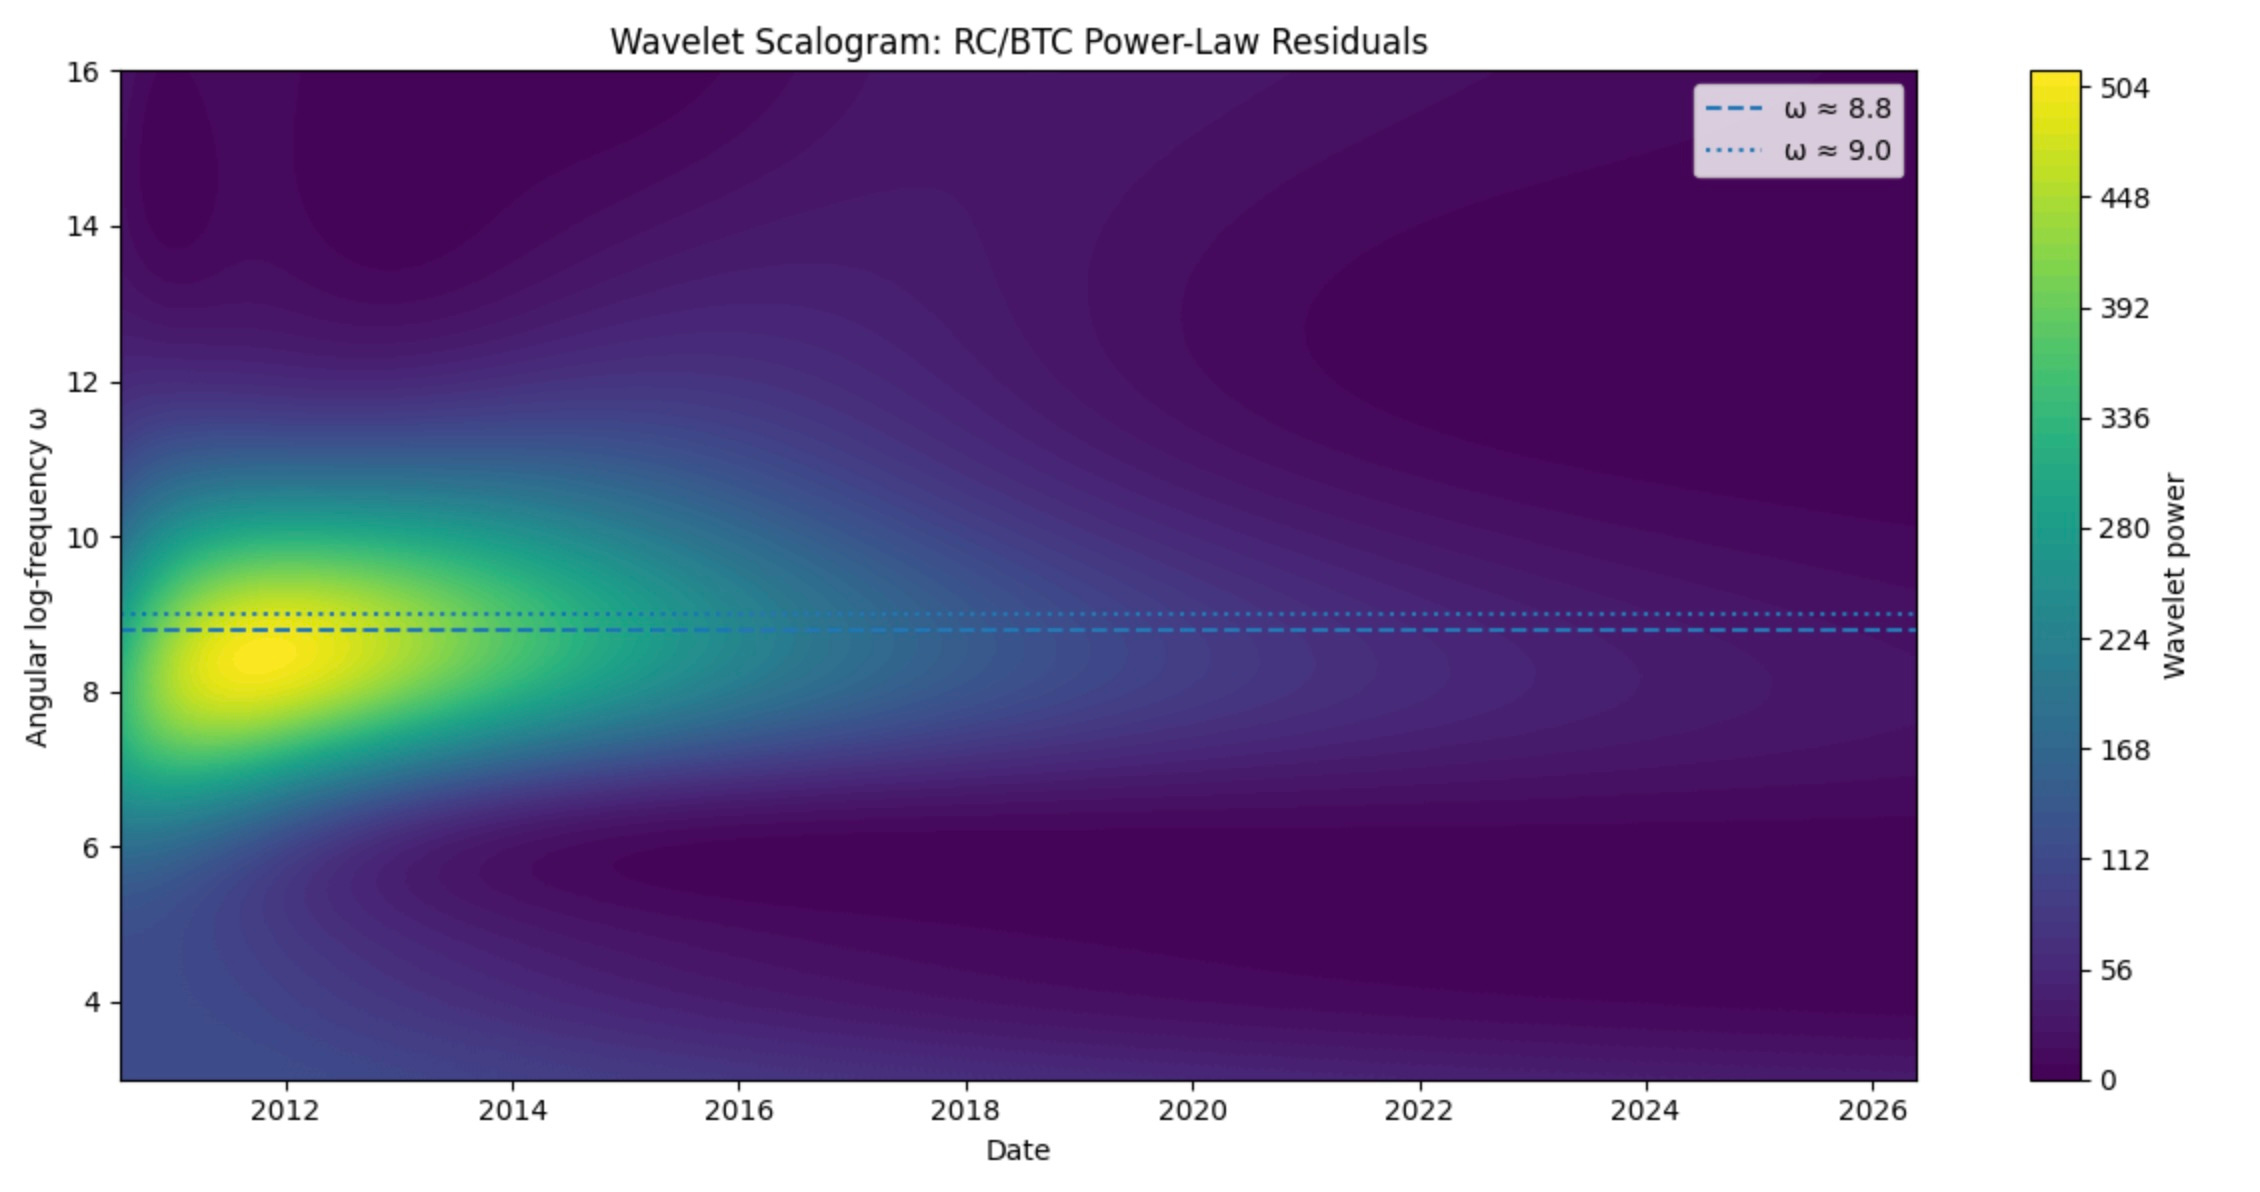
1. The Same DSI Frequency Appears in RC/BTC
Lomb-Scargle and nonlinear log-periodic fits both converge near:
ω ≈ 8.8
corresponding to:
λ ≈ 2.04
This is essentially identical to the Lomb-Scargle frequency previously observed in Bitcoin price. The cycle geometry appears to be shared across price and realized cap per coin.
2. Nearly Half of RC/BTC Residual Variance Is Log-Periodic
For RC/BTC, the log periodic fundamental mode R² ≈ 0.44. A single oscillatory component explains roughly 44% of departures from the long-run trend. That is unusually large for a financial time series.
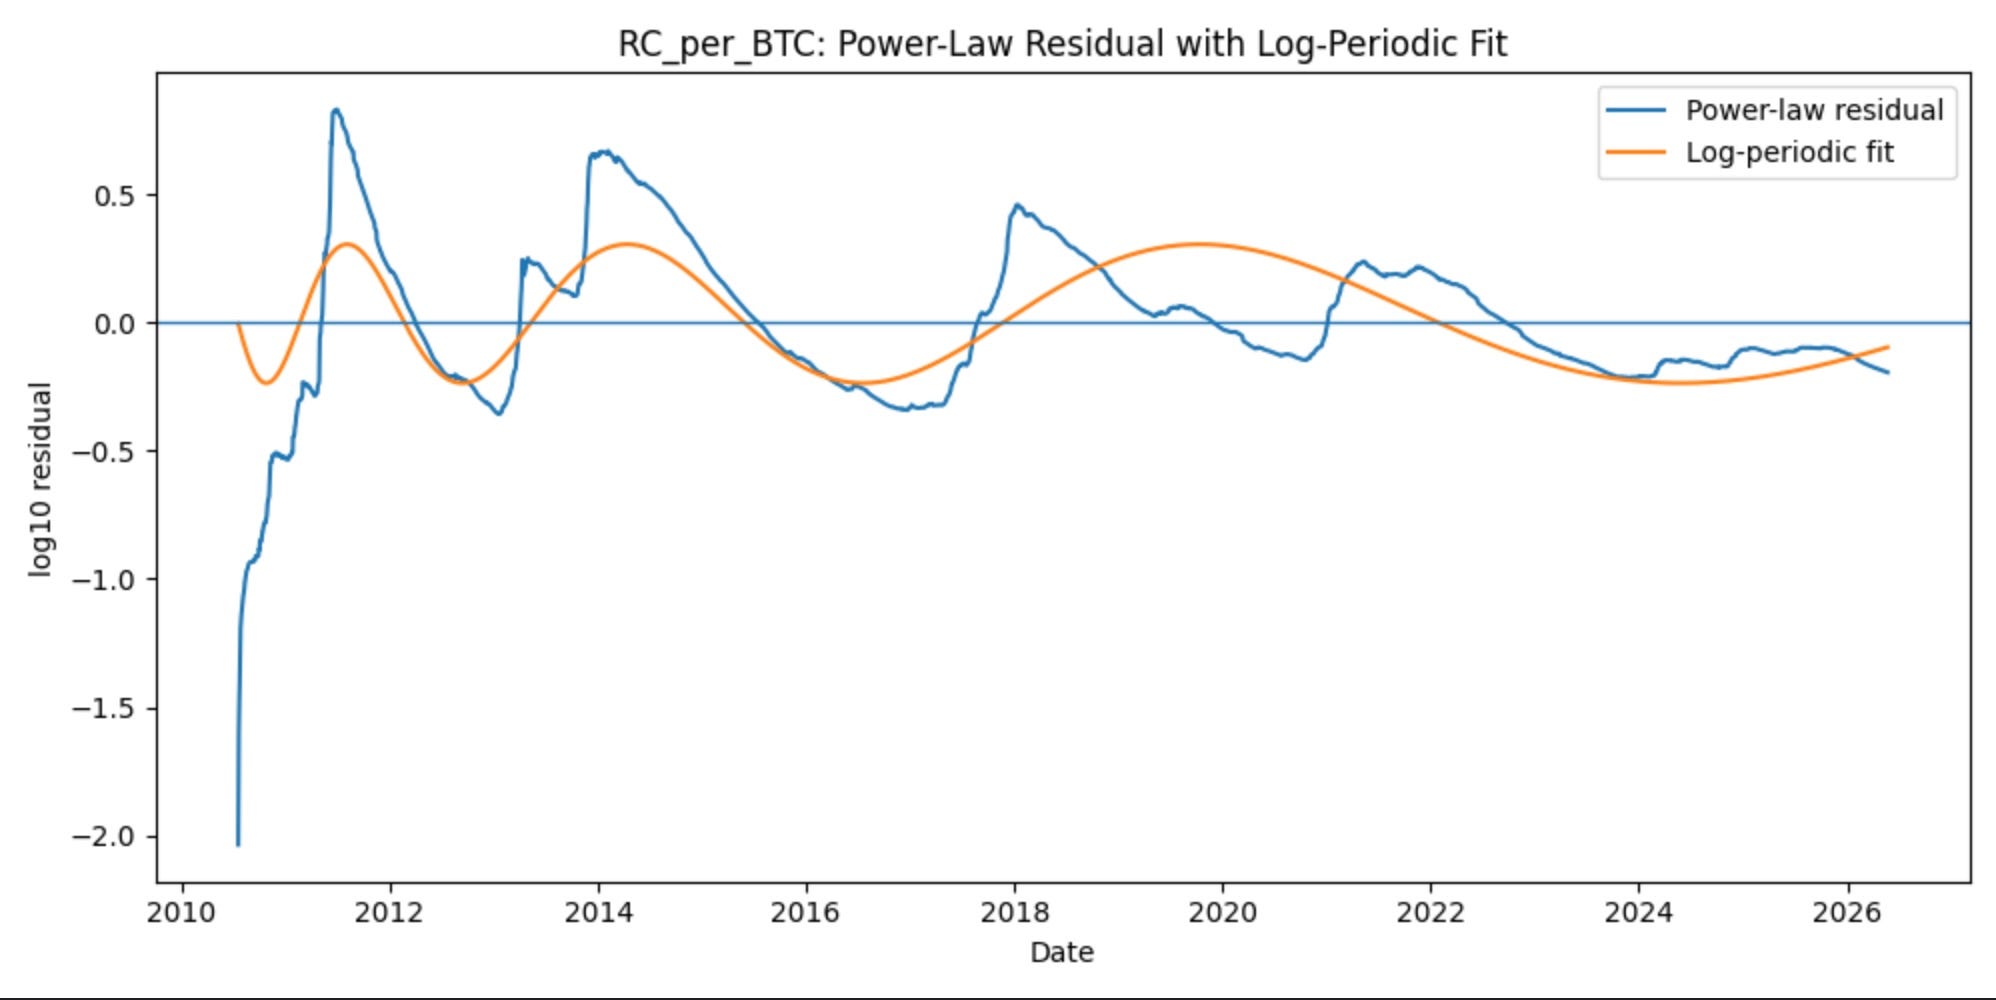
3. The Signal Appears In Capital Formation, Not Just Price
If log-periodicity existed only in price, it might be dismissed as a speculative market artifact.
However it also appears in:
• Total Realized Capitalization
• Realized Capitalization per Bitcoin
Both are measures of accumulated capital commitment. The oscillation therefore appears to be embedded within Bitcoin’s economic structure.
4. Wavelet Analysis Reveals Slowly Evolving DSI
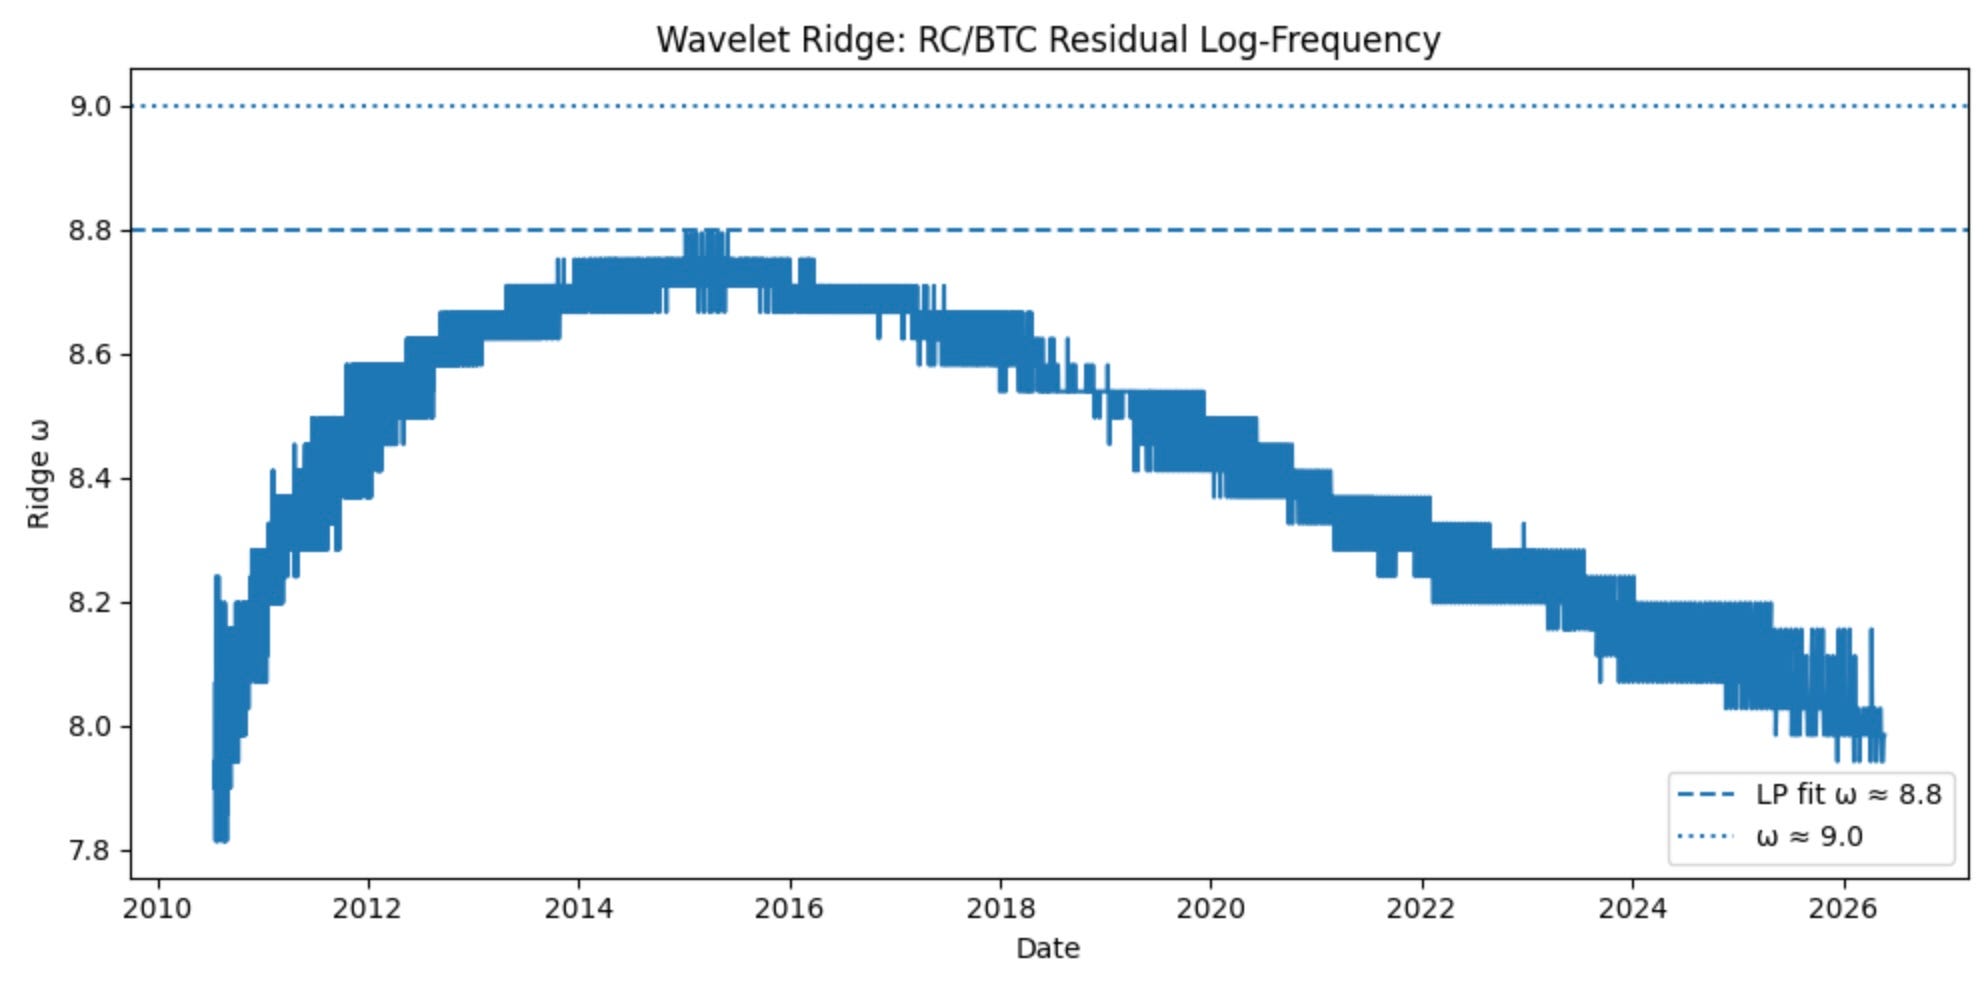
The dominant frequency is not perfectly stationary. The wavelet ridge implies a slowly evolving local frequency. Interpreted as an instantaneous DSI scale ratio, λ drifts from approximately 2.0–2.1 toward values near 2.2 in later years. The global Lomb-Scargle estimate nevertheless remains remarkably stable near λ ≈ 2.04.
The ridge:
• begins near ω ≈ 8.0
• rises toward ω ≈ 8.8
• gradually declines back toward ω ≈ 8.0
The corresponding scale ratio broadens from roughly:
λ ≈ 2.04 to λ ≈ 2.23 as Bitcoin ages.
Bitcoin’s cycle spacing appears to lengthen slowly through time during the past decade.
5. Price And RC/BTC Share A Common Oscillatory Structure
Cross-wavelet analysis reveals strong coherence throughout the DSI band:
8 < ω < 9.5
Wavelet phase-locking yields a mean phase ≈ 26° (0.45 radians). The PLV ≈ 0.997 indicating extremely stable synchronization with a modest price lead.
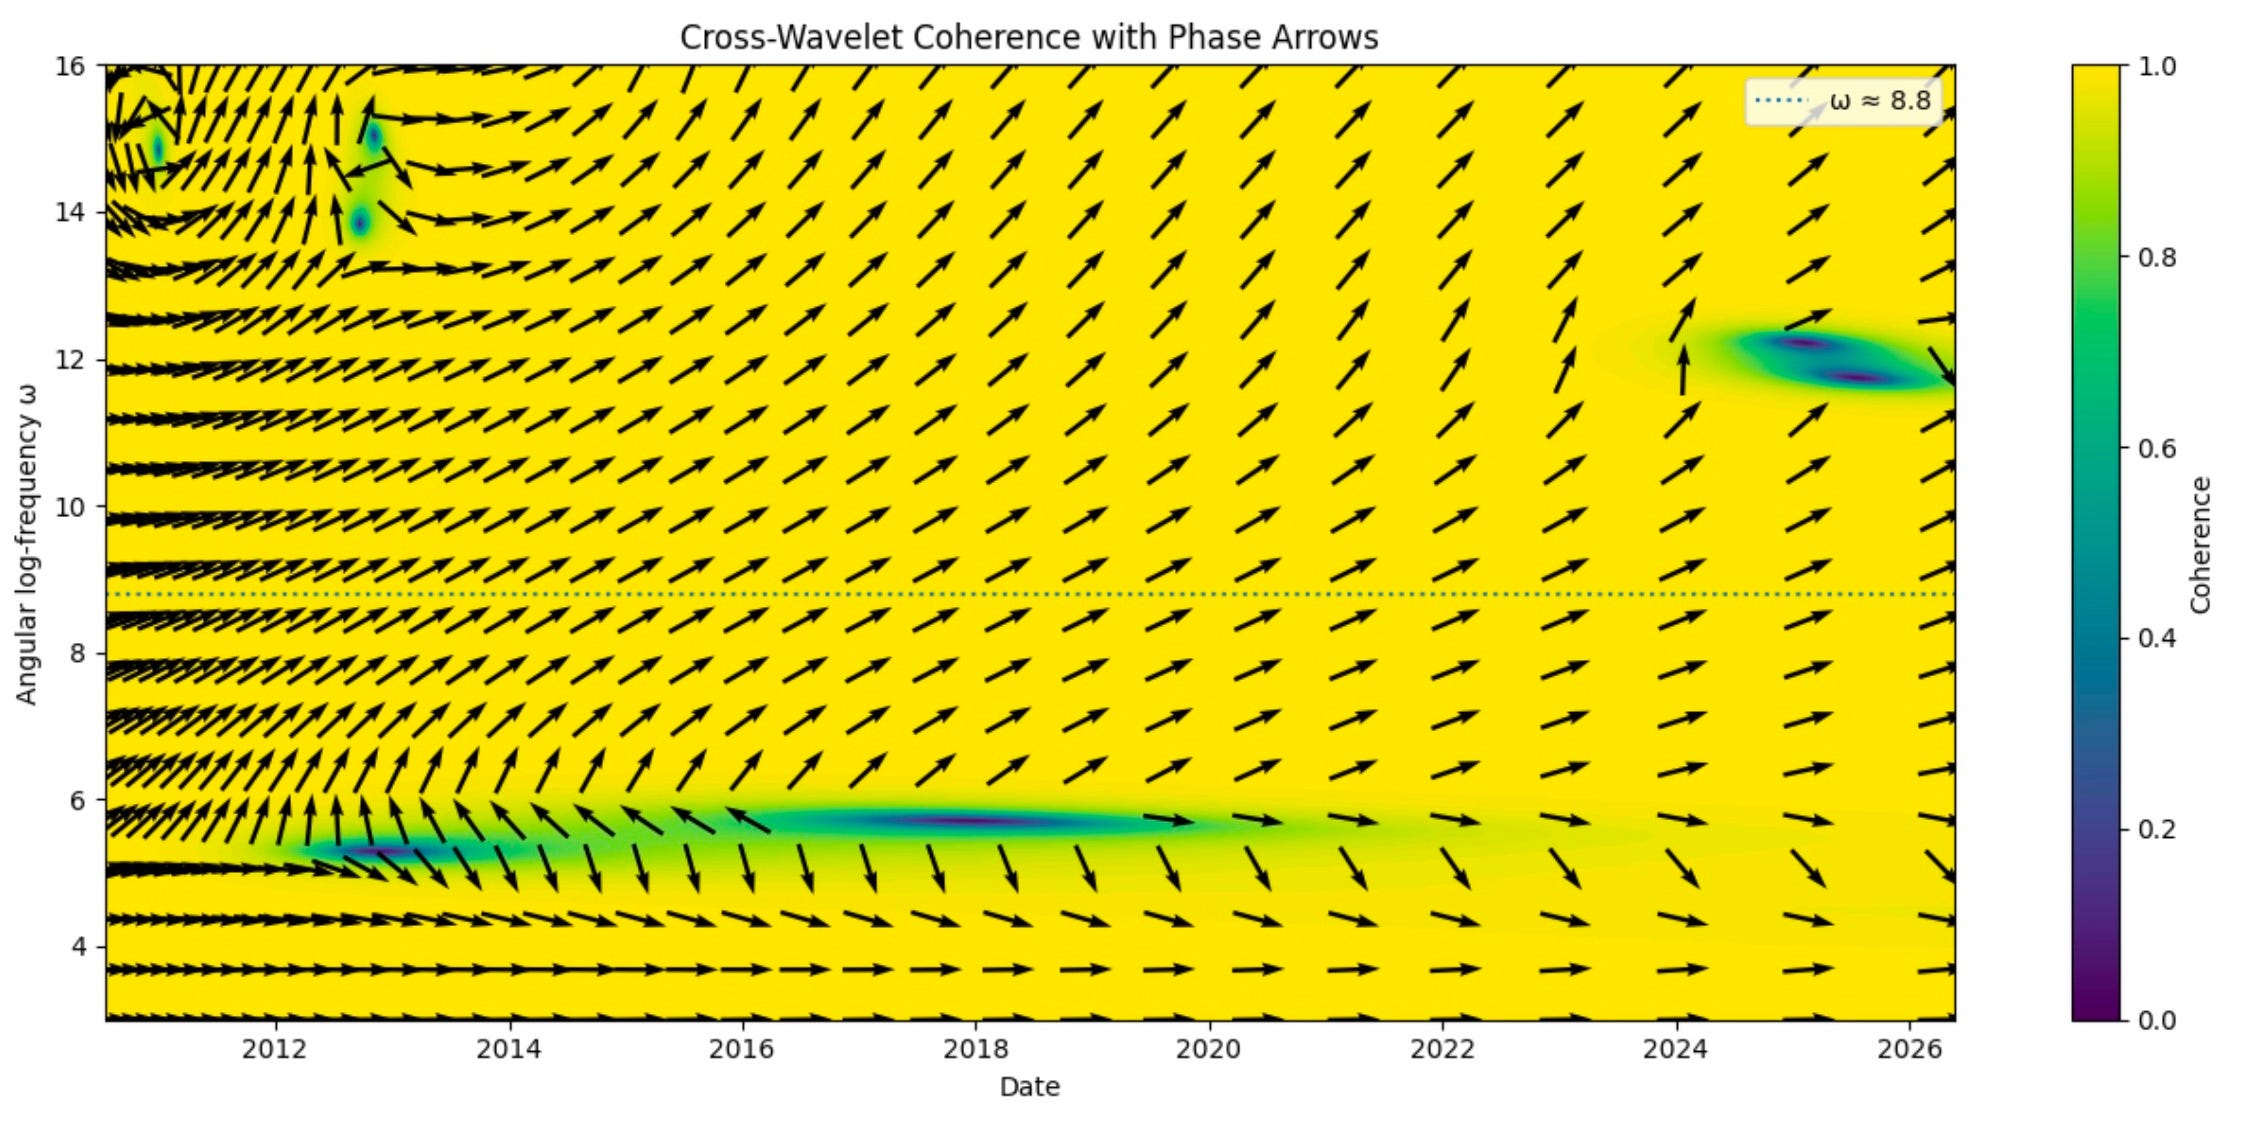
The dominant structures observed in price and realized capital are statistically distinguishable from noise yet remain strongly synchronized. This suggests that both variables are responding to a common underlying scaling process rather than exhibiting independent oscillations that happen to share a similar frequency.
6. The Coherence Survives Surrogate Testing
Phase-randomized surrogate tests preserve spectral structure while destroying timing relationships. Observed DSI-band coherence exceeds surrogate results of 100 randomized histories with:
p ≈ 0.01
for mean coherence. The synchronization therefore appears unlikely to arise from chance alignment of similar spectra.
7. Price Leads Short-Term, RC/BTC Matters Long-Term
Cross-correlation finds maximum alignment when price leads RC/BTC by a few days to a few weeks.
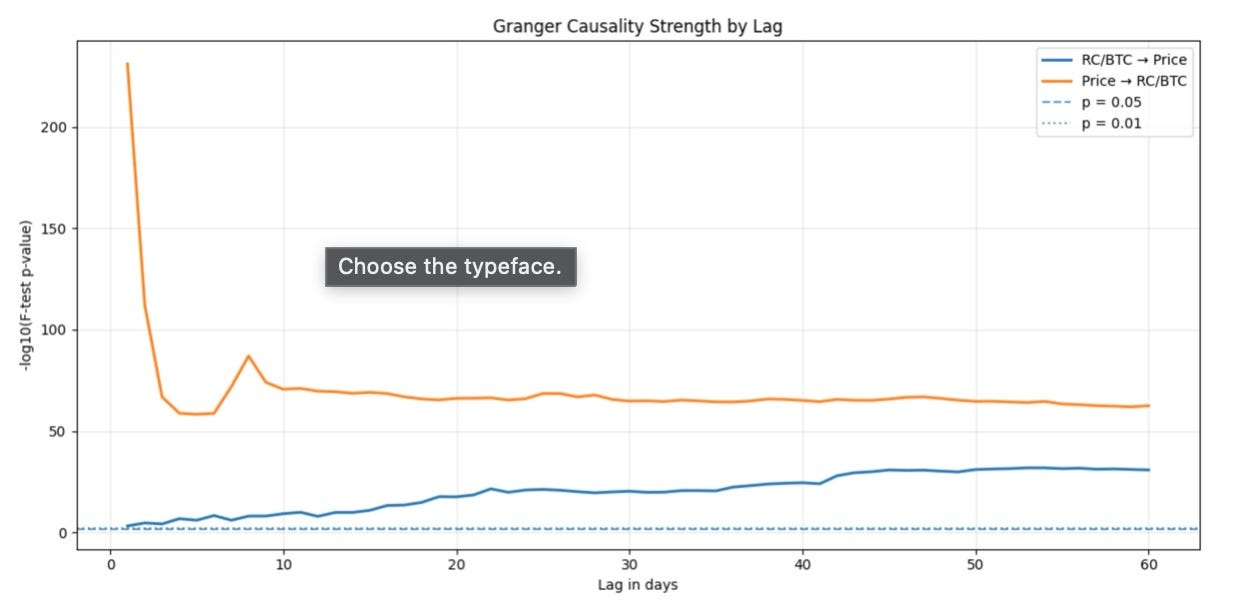
However, RC/BTC also exhibits statistically significant predictive content for future price residuals over horizons extending from weeks to many months.
8. The Evidence Supports A Feedback Loop
The results are inconsistent with a simple one-way causal story. Instead they support:
Price Shock
→ Realized Cap Adjustment
→ Trust Capital Accumulation
→ Future Price
Price appears to dominate short-term discovery, while realized capital accumulates more slowly and retains predictive information over longer horizons. The interaction is therefore consistent with a delayed positive feedback process rather than a purely unidirectional causal mechanism.
9. Implications For The Trust Capital Framework
In the Trust Capital framework, realized capitalization represents the cumulative economic commitment that network participants have made to Bitcoin through time. The discovery that RC/BTC exhibits the same λ≈2 log-periodic structure as price suggests that discrete scale invariance is not merely a property of speculative valuation. Instead it appears to be embedded within the process by which trust capital itself accumulates.
Under this interpretation, Bitcoin’s familiar boom-bust cycles may reflect episodic phases of trust formation and consolidation occurring at preferred scaling intervals. Market price responds immediately, while realized capitalization adjusts more slowly as coins change hands and capital is permanently committed to the network. The observed phase-locking between the two series is therefore consistent with trust capital acting as a slow state variable that both responds to and influences market valuation.
Summary
That Realized Cap per BTC follows a power law of index 5.8 was already established.
The discovery of the same λ≈2 log-periodic structure in Bitcoin Price, and now Total Realized Capitalization, and Realized Capitalization per Bitcoin, substantially strengthens the evidence for discrete scale invariance in Bitcoin. The phenomenon is no longer confined to market valuation alone. It appears within the accumulated capital base of the network itself.
If this interpretation is correct, Bitcoin’s recurring cycles are not simply speculative episodes superimposed upon a long-term trend. They are manifestations of a deeper scaling process governing the accumulation of trust capital throughout the Bitcoin economy. Price and realized capital then become two observable expressions of the same underlying dynamical system, linked through a delayed feedback loop that operates across timescales ranging from days to years.
Stephen Perrenod is engaged in econophysics research of the Bitcoin network as Founder and Associate Director of the Scientific Bitcoin Institute.
Comments
Nothing yet. Say the first thing.
Sign in to join the conversation.