
Executive Summary
Santostasi and Perrenod [1,2] have argued that Bitcoin exhibits a long-run power-law structure linking price, network adoption, and network value through approximately scale-invariant relationships. A recent Amphora Analytics Substack article [3] challenged several aspects of this framework, focusing on uncertainty in the fitted price–age exponent, the econometric and causal basis of the price–adoption relationship, and the decline in the address-growth exponent since 2018.
I agree that uncertainty in the price–age exponent should be stated more carefully. Consistent with the Amphora analysis, I estimate a one-standard-error Newey–West HAC uncertainty of 0.188 around the current exponent of 5.66—approximately 3.3% of the exponent itself. Daily, weekly, and monthly estimates are nearly identical, while an updated backward-looking analysis confirms the result reported in our paper: after substantial early variation, the fitted exponent has converged steadily toward its present value over the past decade.
The central issue is whether Bitcoin’s price–adoption relationship is consistent with Metcalfe scaling or merely reflects two variables trending with time. Dynamic Ordinary Least Squares, which is designed for long-run relationships among persistent variables, raises the estimated price–address exponent to approximately 1.92. Its dependence-robust confidence interval includes the quadratic value of 2 predicted by Metcalfe’s law. Engle–Granger tests also support cointegration between price and non-zero-balance addresses at weekly and monthly frequencies, although mixed integration-order and split-sample results counsel against an unqualified causal interpretation.
New vector error-correction tests strengthen the case that the relationship contains genuine feedback rather than only a common trend. Lagged address changes add significant information to the price equation, while lagged price changes predict subsequent address formation even more strongly. Adjustment is asymmetric: when price exceeds its address-implied equilibrium, addresses tend to catch up; when price falls below equilibrium, price tends to recover. These findings are consistent with a coupled price–adoption system organized around a persistent, approximately Metcalfe long-run relationship, although they do not prove that adoption is the sole or independently exogenous cause of price appreciation.
Finally, Amphora Analytics correctly observes that the address–age exponent declined from approximately 3.51 in January 2018 to 3.06 in January 2026. Non-zero-balance addresses, however, are an evolving proxy rather than a direct count of users or economic adoption. The increasing concentration of beneficial ownership within exchanges, ETFs, corporate treasuries, governments, custodians, and other institutional “fat nodes” allows substantially more capital and ownership to be represented by comparatively few visible addresses. A bounding calculation indicates that the rise in institutional ownership from roughly 2% to more than 20% could account for a substantial portion of the observed decline, although that estimate depends on assumptions about custody concentration.
Overall, the new evidence moves the interpretation beyond a generic common trend. Bitcoin displays both a stable price–age exponent, and a persistent and nearly quadratic price–adoption relationship. It also displays bidirectional short-run predictive feedback and asymmetric correction toward long-run equilibrium. An approximately Metcalfe feedback relation is therefore the leading interpretation among those tested, while the precise causal channels and the changing measurement of adoption remain open research questions.
Error Bars for the Price-Time Power Law Exponent
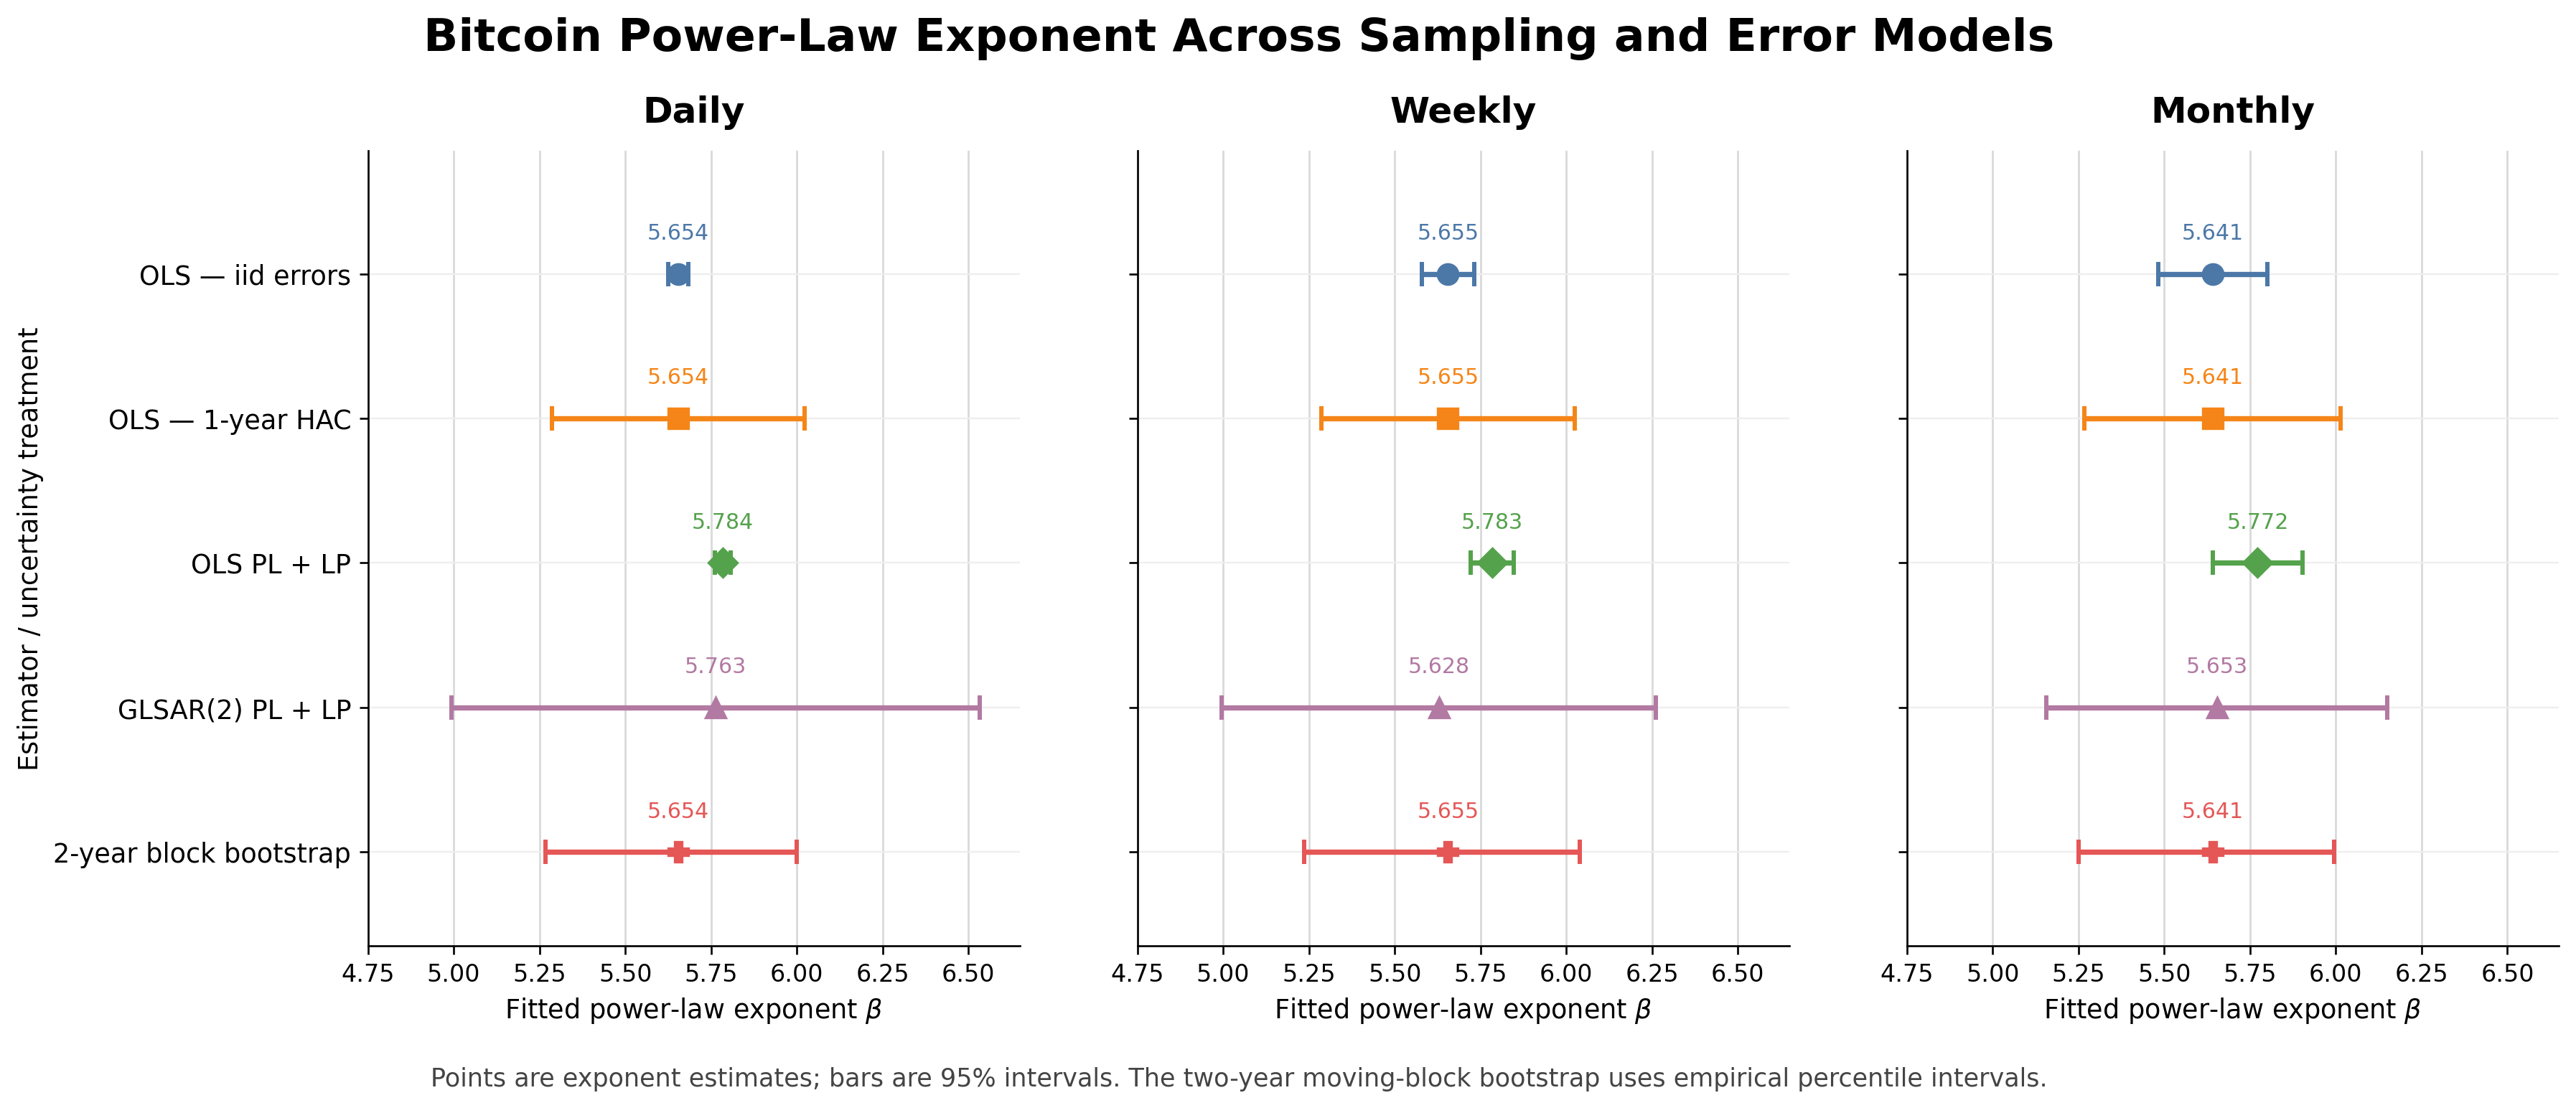
I have reanalyzed the power-law exponent on daily (n = 5789), weekly (n = 828), and monthly (n= 191) time scales using Coin Metrics data until May 24, 2026. Five different measures of the 95% uncertainty range are graphed in Figure 1, for each of the time scales.
The most appropriate measure, in agreement with Amphora Analytics, is the Newey-West HAC range (orange error bar) that corrects for autocorrelation and heteroskedasticity. Newey–West HAC errors adjust statistical uncertainty for both changing residual volatility and serial correlation over time. A moving-block bootstrap (red bars) provides a similar 95% uncertainty interval.
Thanks for reading Money or Debt Newsletter! This post is public so feel free to share it.
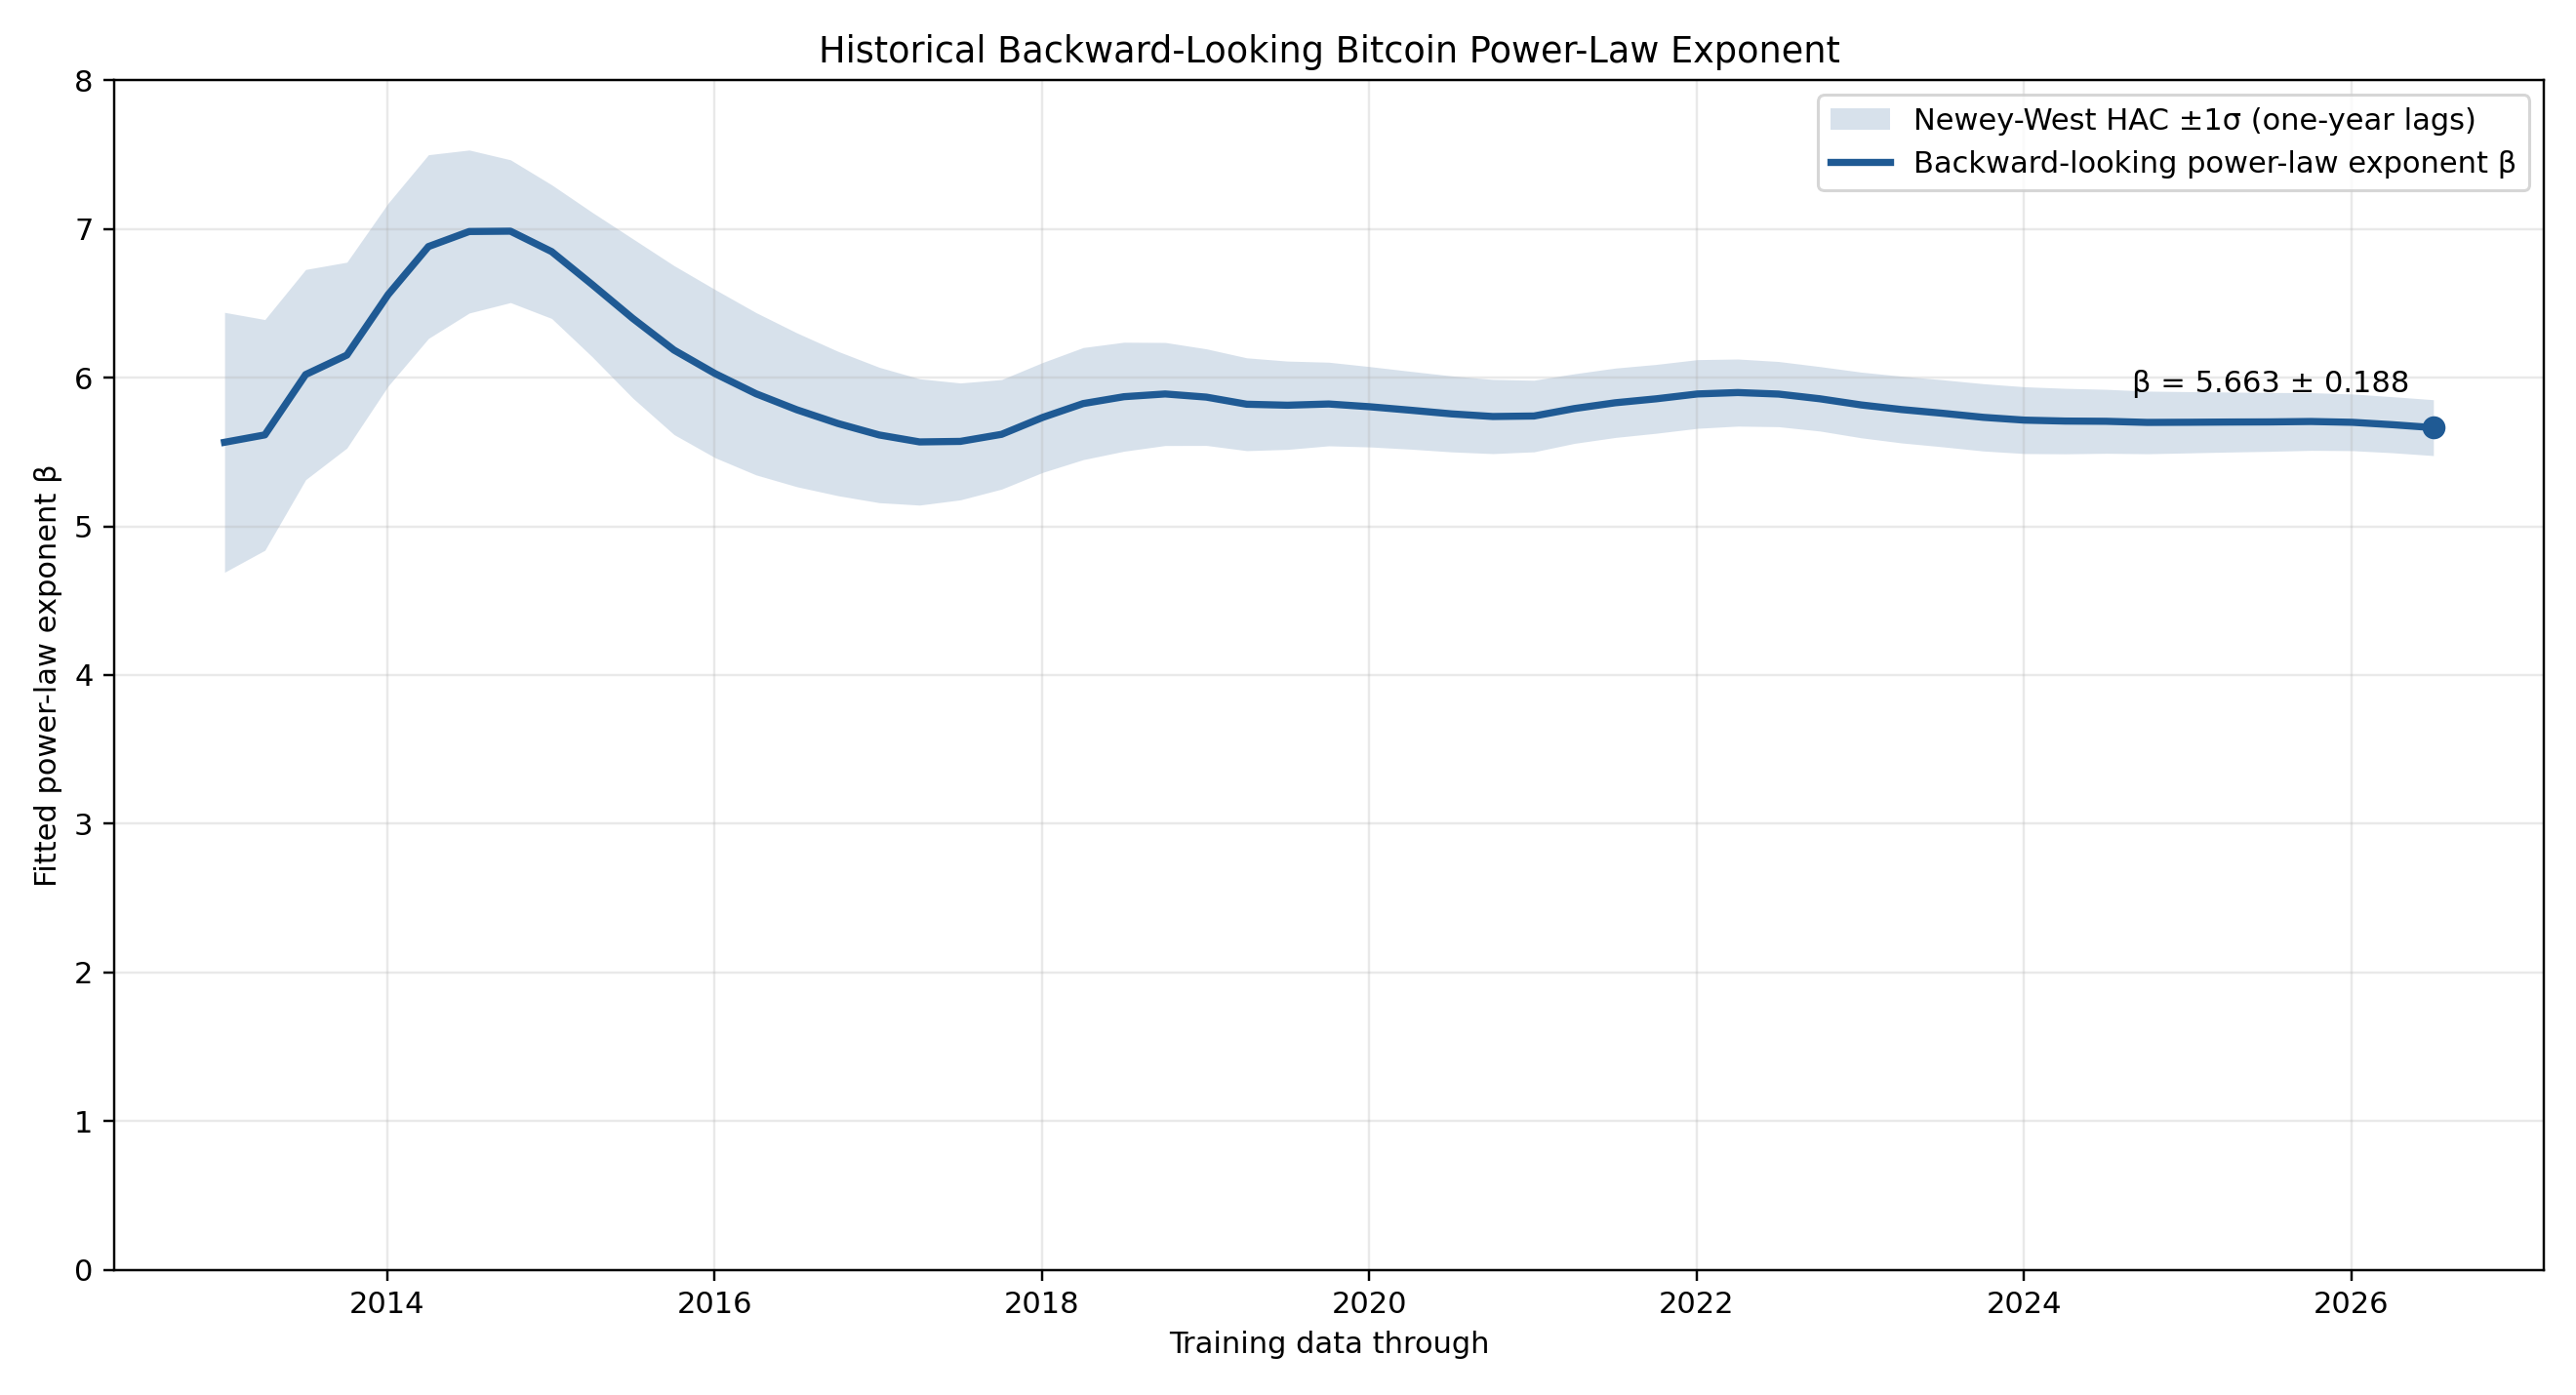
Figure 2 shows how the power law exponent for price-age has evolved since 2013. It stabilized to below 6.0 from early 2016 and for OLS has apparently locked in close to 5.7 with a Newey-West uncertainty (one standard deviation) of less than 0.2. The one sigma uncertainty is only about 3% of the exponent value. Accounting for serial correlation does not materially weaken the conclusion that Bitcoin price follows a remarkably well-defined secular power-law trajectory.
Metcalfe’s Law and Bitcoin’s Price-Address Relationship
Directionality
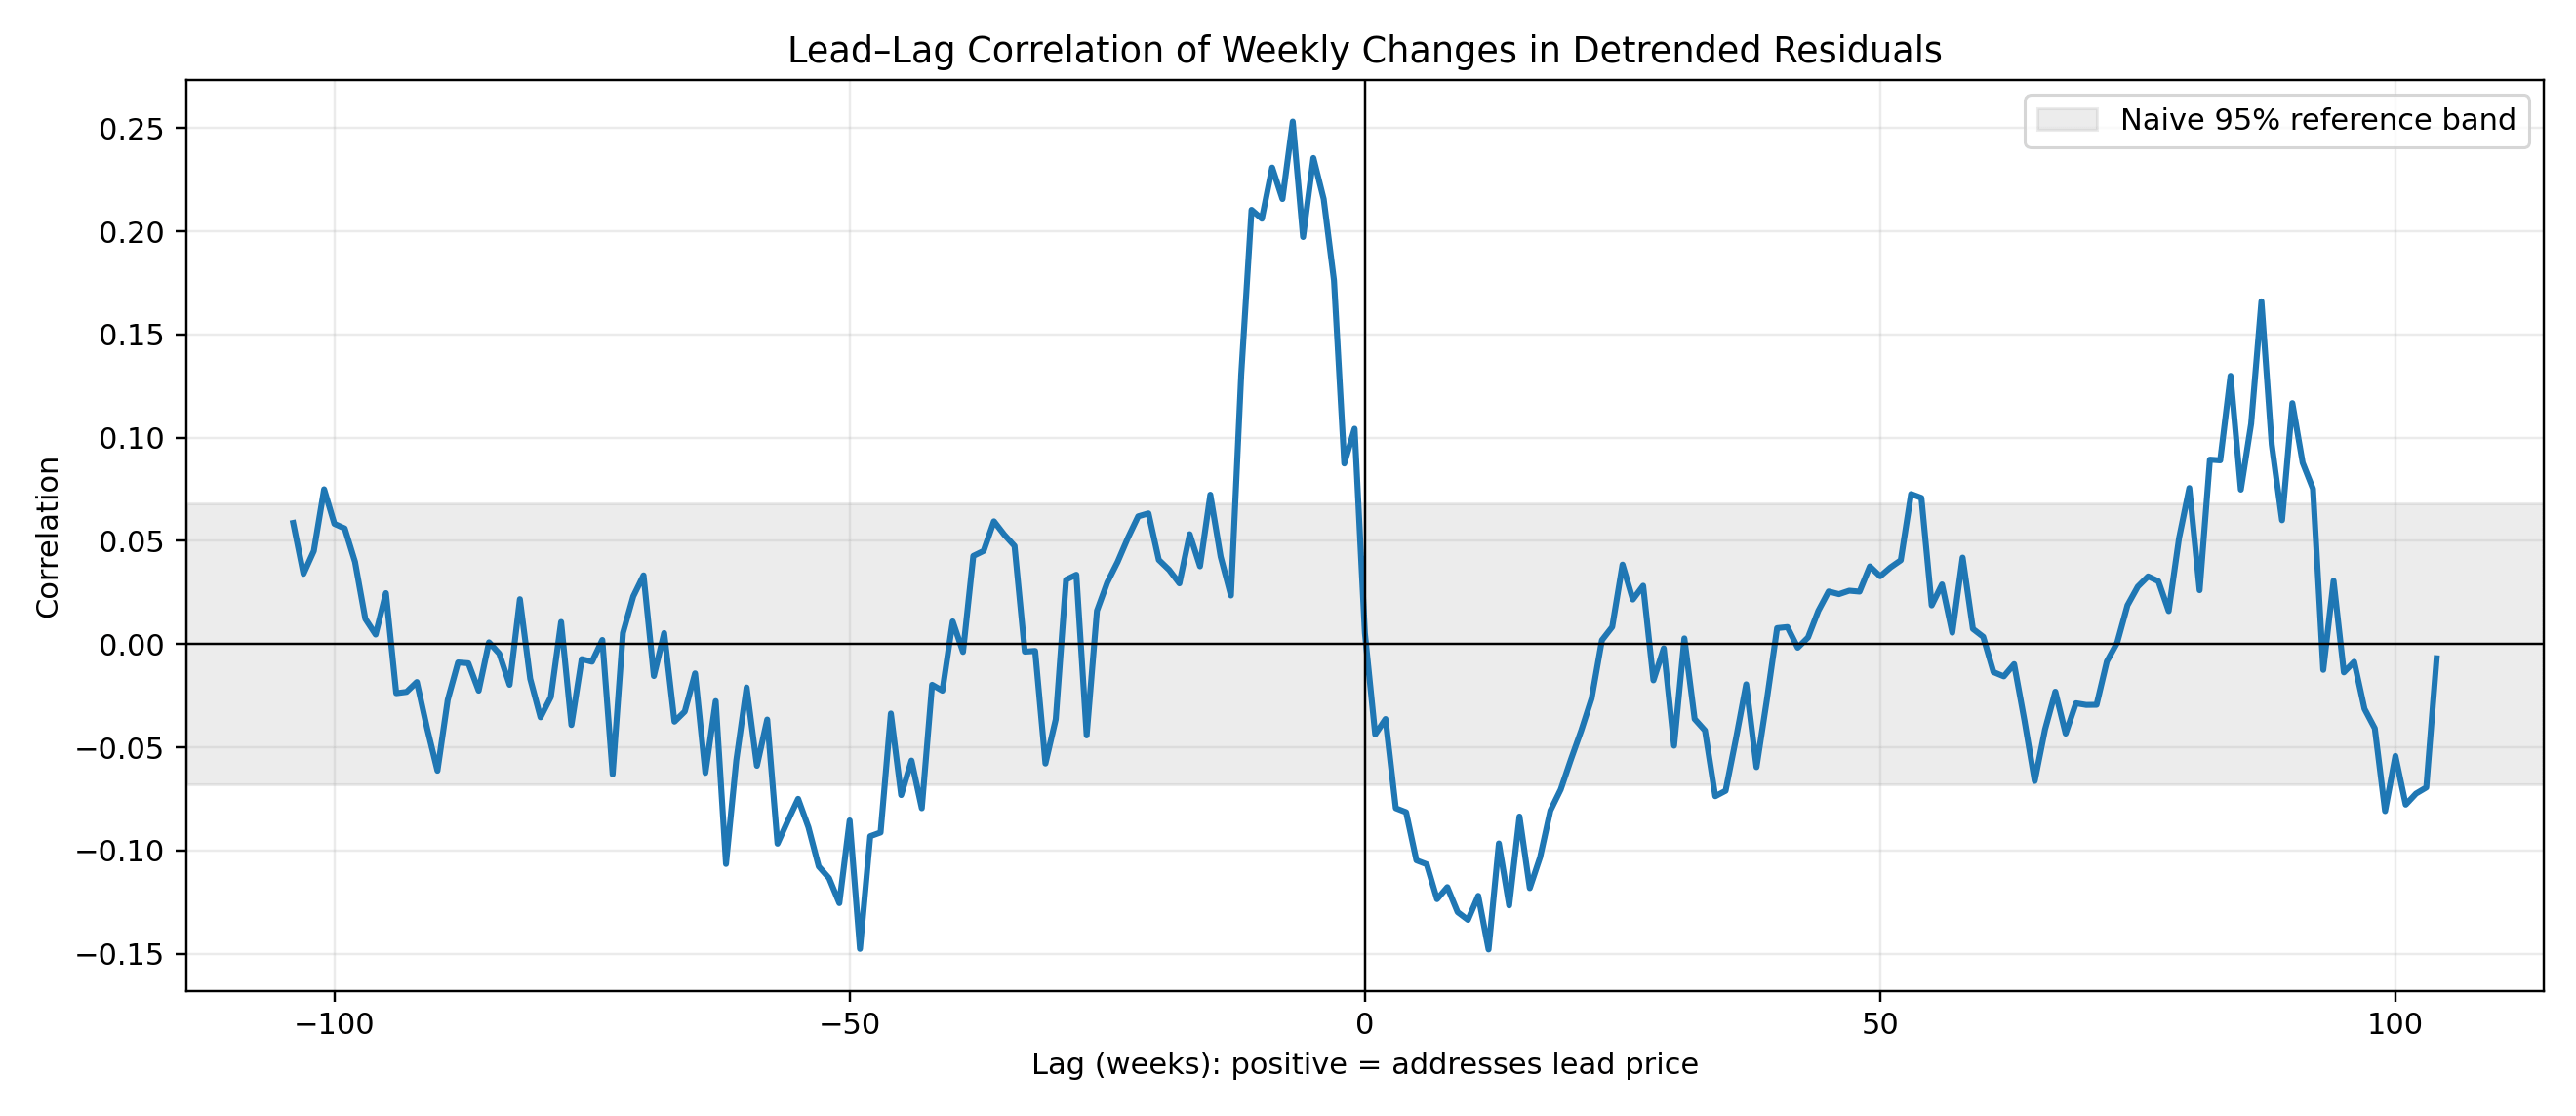
I examined the Bitcoin price and address lead-lag relationship using weekly detrended residuals (price vs. age against addresses vs. age). The x-axis shows lag in weeks with negative lag indicating price leading addresses. The most prominent feature is a short-term 3 to 12-week lead of prices vs. addresses. This is not surprising; increased prices tend to lead to increased adoption by momentum followers.
A smaller positive correlation appears near an 80-week lag, suggesting the possibility that address expansion sometimes precedes price over intermediate horizons. However, this feature does not survive the more conservative block-bootstrap and distributed-lag tests and should therefore be regarded as exploratory rather than established. A ~1.5-year lag is actually reasonable for adoption —> price, because exchanges, custody, funds/ETFs, treasury infrastructure, lending, payments, and institutional compliance channels take months to years to develop. Address growth would plausibly be functioning more as an intermediate term leading indicator of an expanding economic network that induces businesses to invest.
Is it Metcalfe-Like?
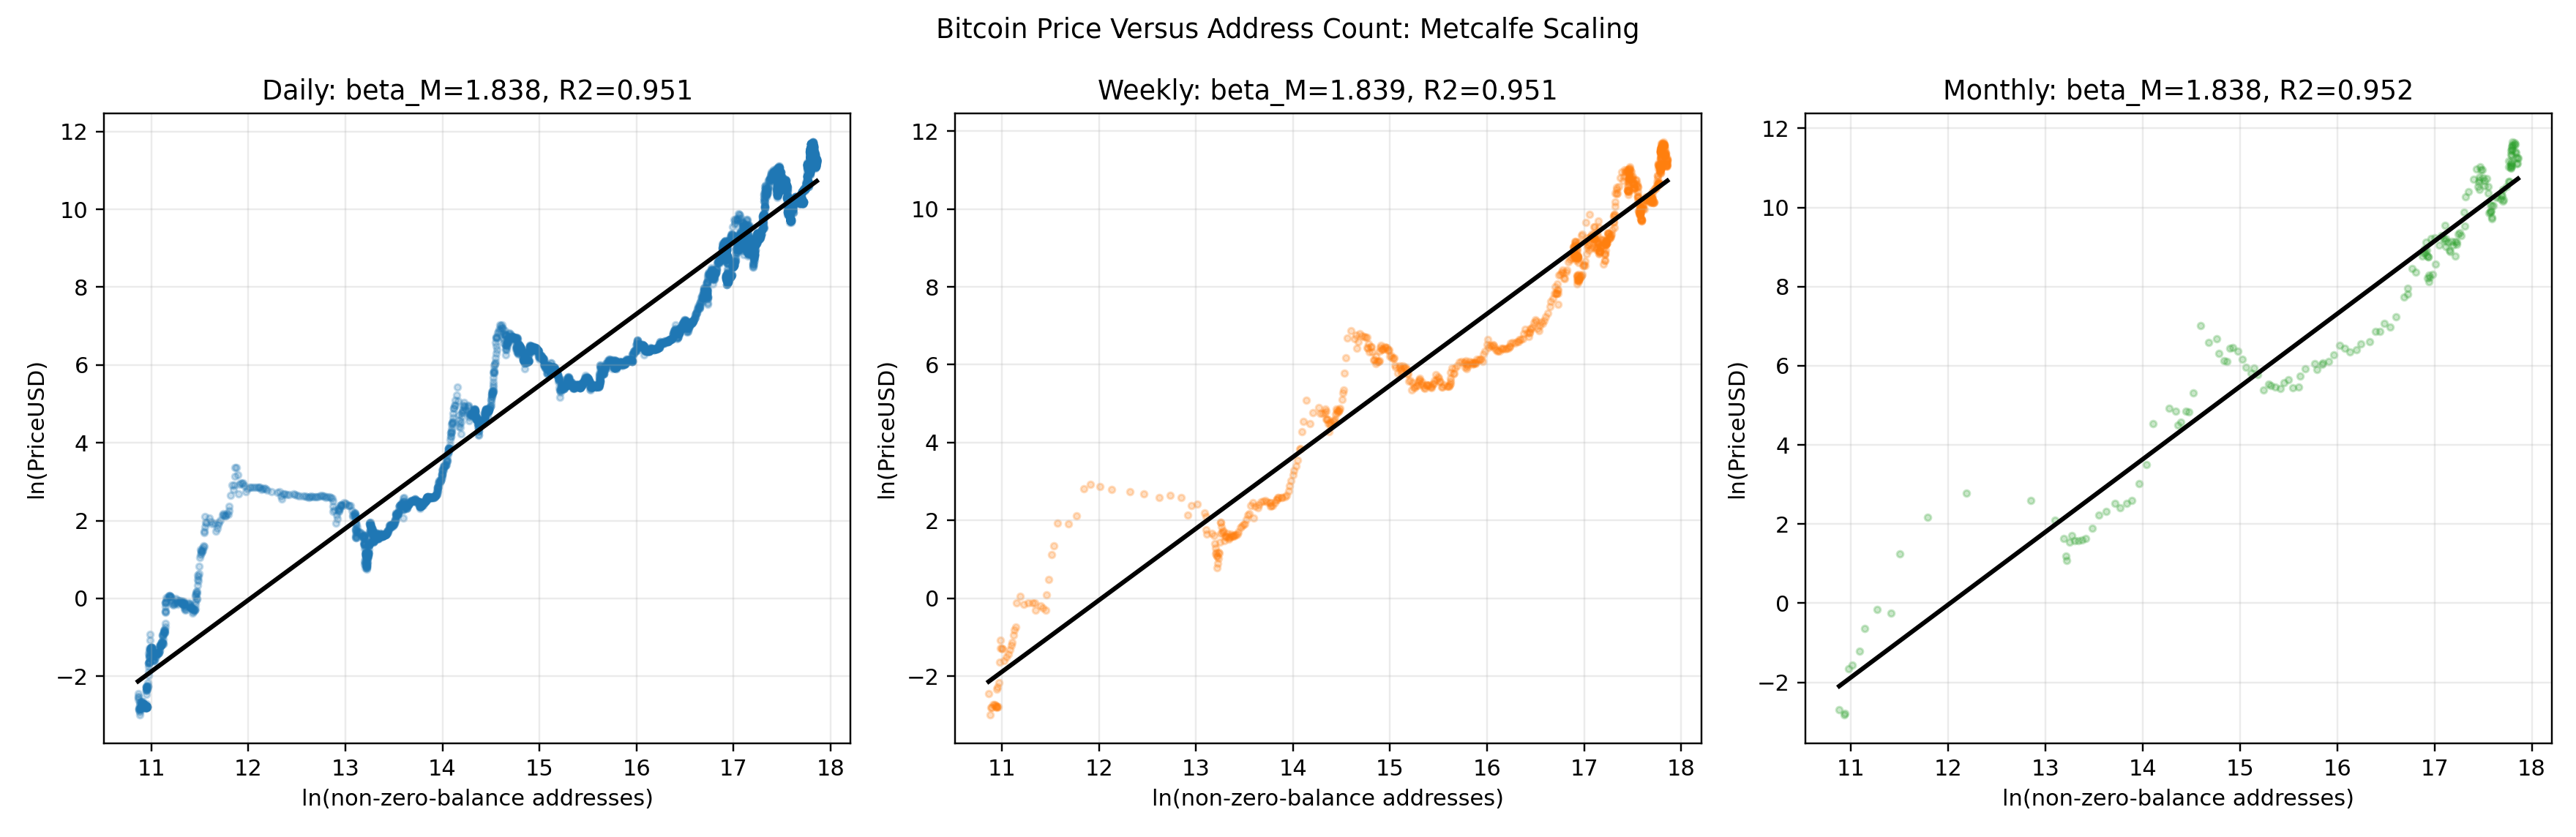
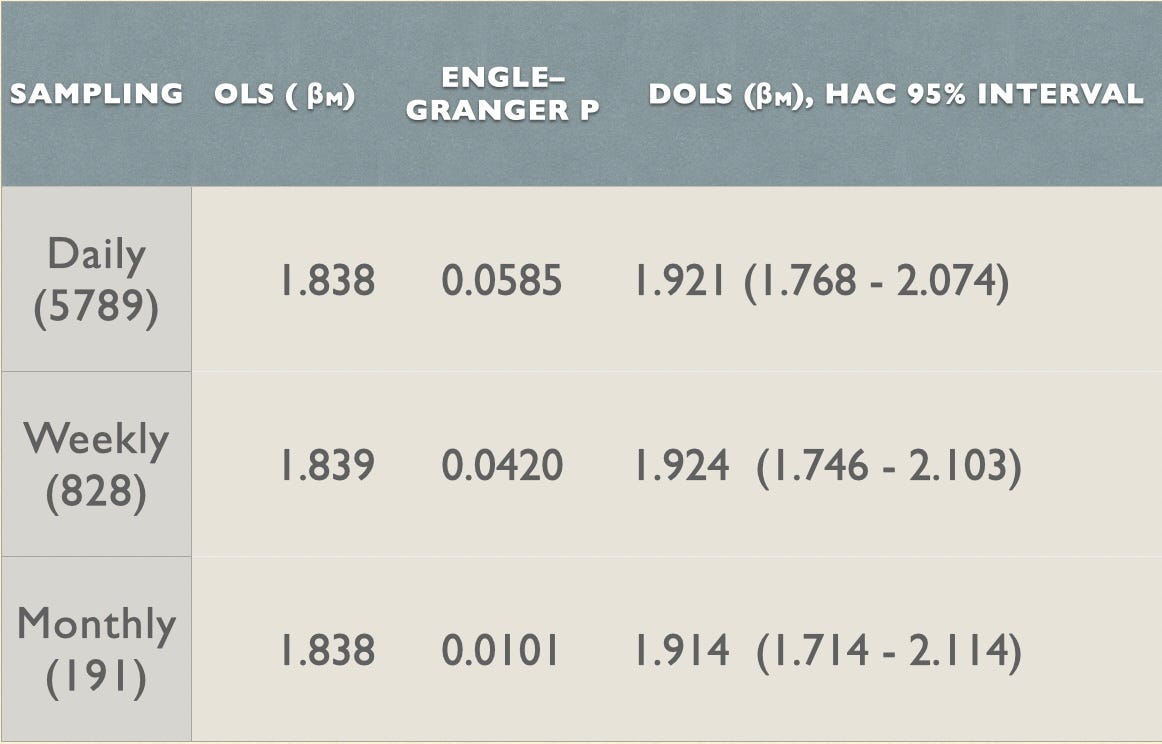
Table 1 shows the results of both OLS and DOLS regressions of price vs. address over the full history. The exponents are 1.84 for each of daily, weekly, and monthly regressions, rising to approximately 1.92 in each case for the DOLS method that reduces bias from short-run dynamics, simultaneity, and serial correlation when estimating the long-run coefficient βM.
It is suggestive that the DOLS values are higher than the OLS values and close roughly half the gap between 1.84 and the classical value of 2.0 for Metcalfe’s law. The 95% interval using HAC is also shown for the DOLS values, and in each case the classical value of 2.0 falls well within the range. Observed ‘generalized’ Metcalfe’s law style communication networks allow for exponents well below 2.
Also shown are the Engle-Granger p-values. For weekly and monthly sampling, these fall under 0.05, indicating likelihood of cointegration, complementing the directionality results. The daily sampling p-value is just at the margin with a value of 0.059.
Vector Error-Correction Model
I estimated a two-equation vector error-correction specification around the DOLS long-run Metcalfe relation. Define the equilibrium deviation as et = ln Pt - α - βM ln At , with α and βM obtained from Dynamic OLS. Separate equations modeled weekly changes in log price and log non-zero-balance addresses as functions of the previous week’s equilibrium deviation and 13 weeks of lagged changes in both variables, using Newey–West HAC inference with one-year lags.
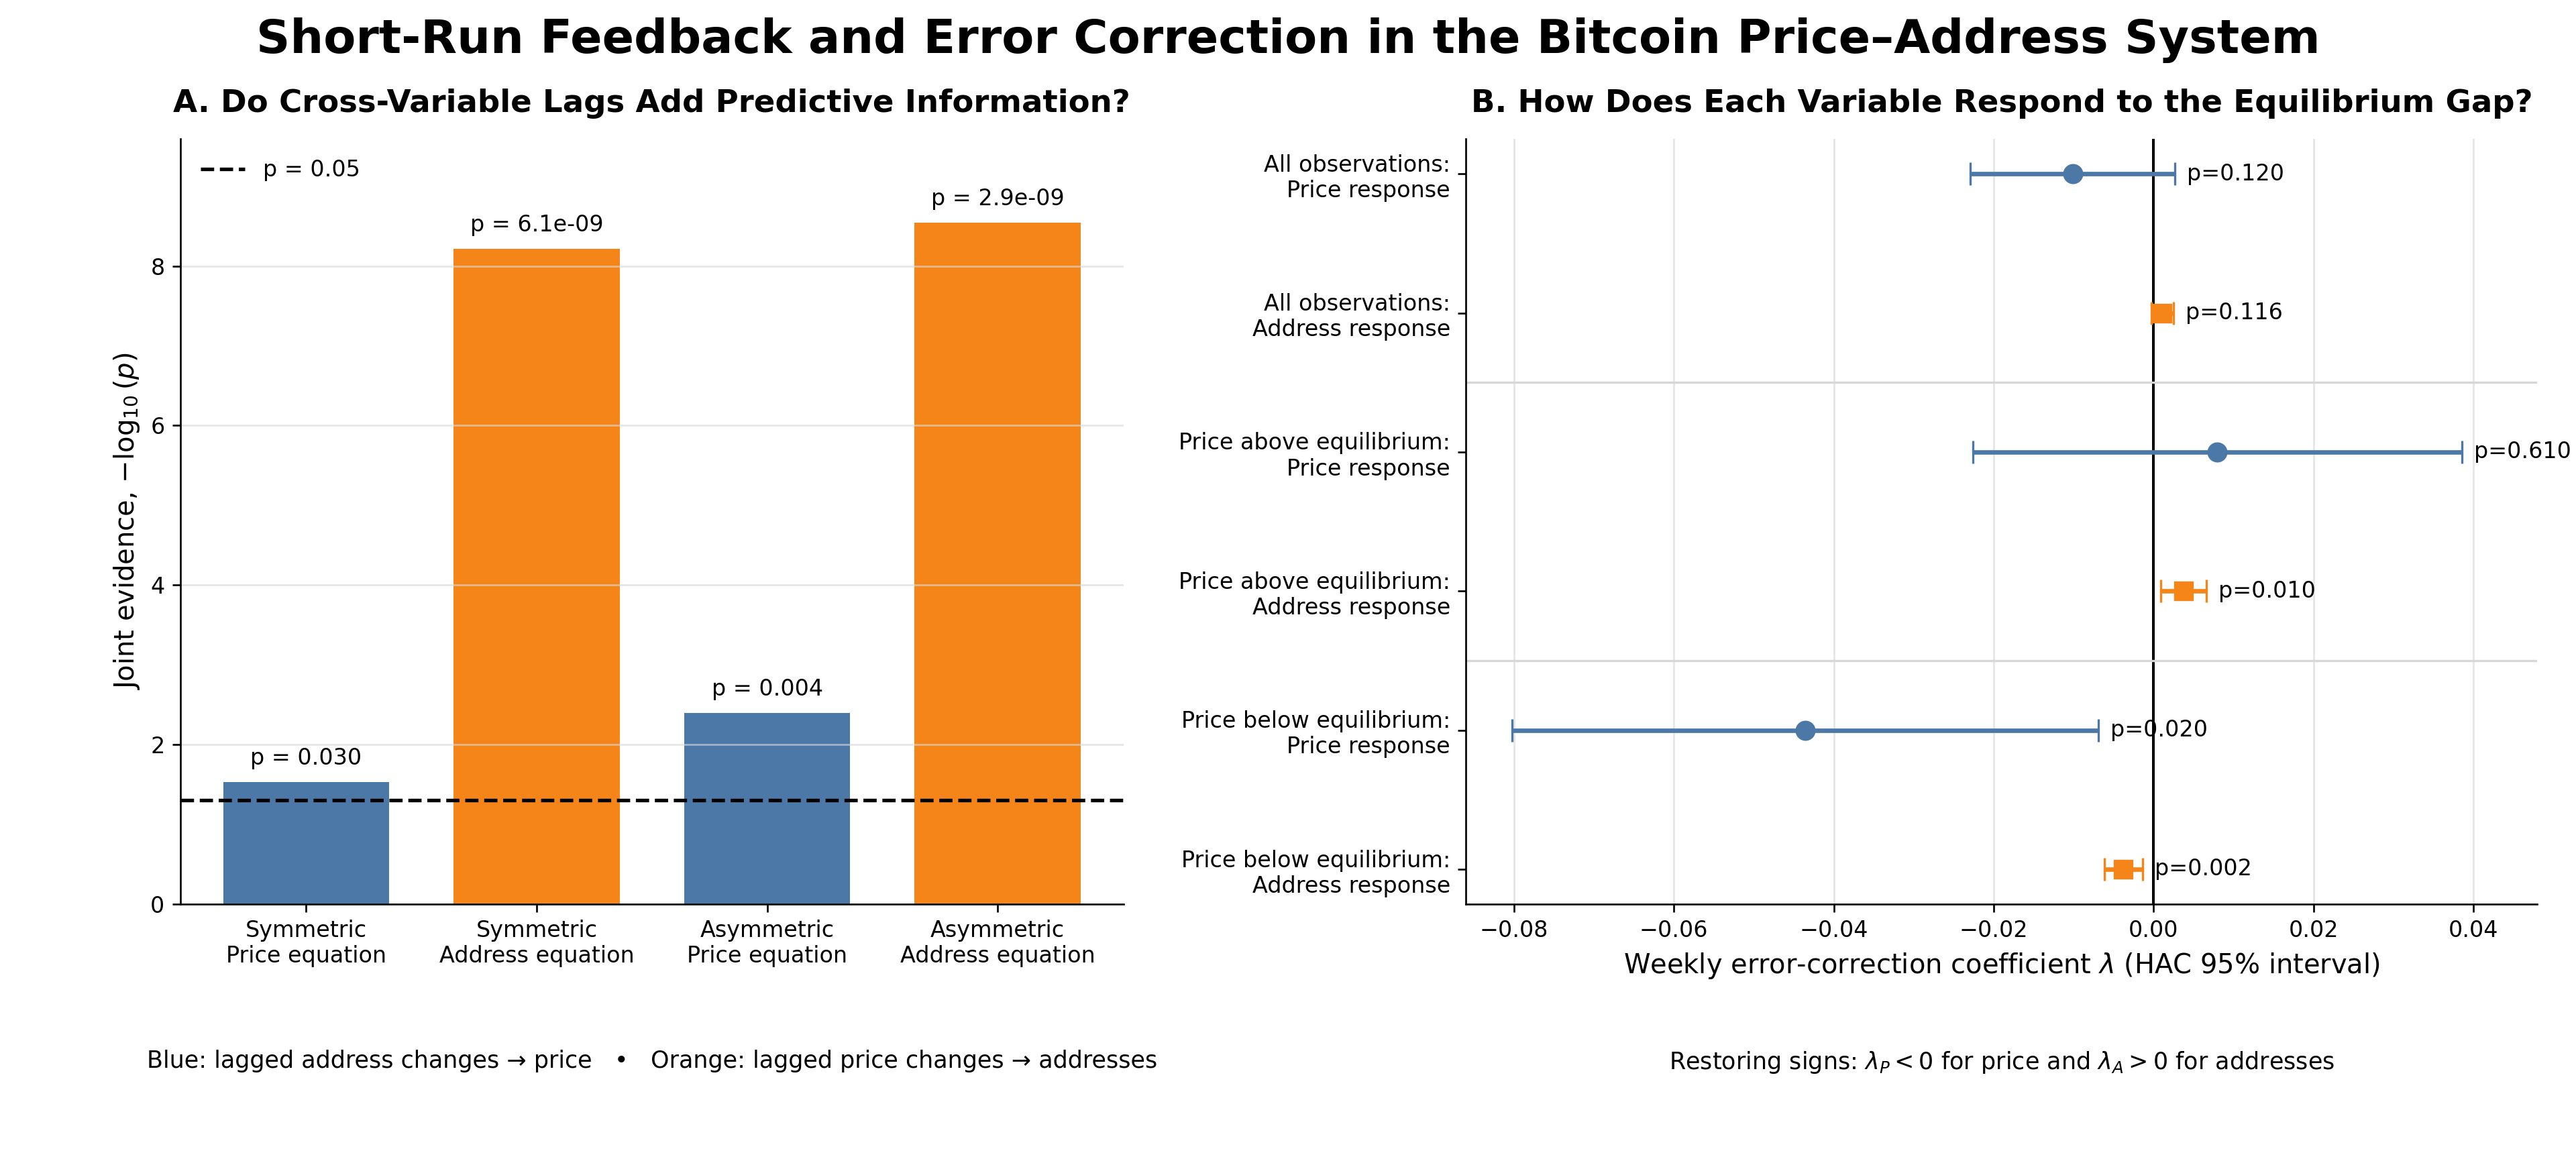
We estimated both a symmetric specification, with one adjustment coefficient for all deviations, and an asymmetric specification separating price above equilibrium from price below equilibrium (et < 0). Joint tests of the cross-variable lags measured short-run bidirectional predictive feedback, while the error-correction coefficients identified whether disequilibrium was subsequently reduced through price adjustment, address adjustment, or both.
The results are provided in Figure 5. The bar chart in Panel A uses the negative log base 10 of p-value on the y-axis. All four bars support bidirectional feedback with substantially stronger influence running from price to addresses, strengthening the Metcalfe’s law interpretation. Panel B shows the response of price and address when price is above or below equilibrium. The lowest three relationships are all p < 0.05 and thus the most informative. For example, there is a negative response of price when it is below equilibrium, in other words, it tends to return to equilibrium.
Price changes strongly predict subsequent address growth. The asymmetric error-correction estimates further suggest that addresses are comparatively sticky; when price falls below the Metcalfe relation, adjustment occurs primarily through price recovery rather than proportional address contraction.
Decline of the Address-Age Exponent
Amphora Analytics notes that the address power law of age exponent decreased steadily from approximately 3.51 when it peaked in 2018, and falling to approximately 3.06 recently.
There are a couple of things to consider about this. First of all Metcalfe’s Law is about value going as the square of adoption. The number of addresses is just a proxy for adoption. It’s a reasonable one, but known to be flawed for various reasons. One is that typically there are multiple addresses per user. Satoshi’s coins are held across tens of thousands of addresses.
But another effect works in the opposite direction. That is, with the substantial growth in institutional Bitcoin holdings, the number of addresses per user may be much less than one as exchanges, ETFs, and treasury companies consolidate thousands, tens of thousands, and perhaps hundreds of thousands of Bitcoin potentially into a single cold storage address or a modest number of addresses.
The apparent slowing of address growth partly reflects a change in ownership architecture. Publicly tracked funds, companies, governments, and other concentrated vehicles increased from perhaps 2% of Bitcoin supply in early 2018 to approximately 20% in 2026. If one subtracts 3-4 million estimated lost coins (Satoshi’s included) from the current supply, that 4 million Bitcoin in institutional and custodial hands could represent as much as 25% of available Bitcoin.
Let’s estimate the growth in institutional percentage as rising from 2% to 22% over the interval. That suggests an upper bound on the magnitude of decrease in the exponent, assuming many fewer addresses per user, running as:
ln(.78/.98)/ln(17/9) = -0.36
where ln is natural log, and the non-institutional portion fell from 0.98 to 0.78 as the age increased from 9 to 17. This yields an estimated decline in the exponent of -0.36, compared to the -0.46 observed decrease.
Under this extreme assumption that institutionally held bitcoin contributes proportionally negligible incremental addresses, the ownership shift could mechanically reduce the fitted address–age exponent by roughly 0.36— about four-fifths of the observed 0.46 decline. This is an upper bound, but it demonstrates that changing custody architecture could be quantitatively important.
The declining address exponent therefore likely overstates the slowdown in underlying economic adoption considerably, because an increasing number of beneficial owners are represented by comparatively few custodial wallets.
Conclusions
Amphora Analytics raises legitimate questions about uncertainty, serial dependence, causality, and the evolving meaning of address count. Dependence-robust methods substantially widen the uncertainty around Bitcoin’s price–age exponent, but its central estimate remains stable near 5.7 across daily, weekly, and monthly sampling. Dynamic OLS similarly places the long-run price–address exponent near 1.92, statistically consistent with quadratic Metcalfe scaling.
The additional vector error-correction analysis strengthens the case that this is more than a generic common trend. Short-run predictive influence runs in both directions: lagged address changes add information to the price equation, while lagged price changes predict subsequent address growth even more strongly. Adjustment is also asymmetric. When price is above its address-implied equilibrium, address growth tends to catch up; when price is below equilibrium, price tends to recover. These results are consistent with a coupled feedback system organized around a persistent price–adoption relationship.
They do not, however, establish that address growth independently or unidirectionally causes price appreciation. Price-to-address feedback is particularly strong, the longer-horizon address-to-price evidence remains less secure, and mixed integration-order and split-sample results warrant caution. Common drivers—liquidity, technological development, institutional participation, and broader adoption—may affect both variables.
The post-2018 slowdown in measured address growth must also be interpreted in light of Bitcoin’s changing ownership architecture. A growing share of beneficial owners and capital is represented through exchanges, ETFs, corporate treasuries, governments, and custodians that generate comparatively few visible on-chain addresses. Address count may therefore increasingly understate economic adoption, weakening its comparability across eras without invalidating the underlying network relationship.
The defensible conclusion is therefore stronger than simple correlation but narrower than proof of causality: Bitcoin exhibits a robust, persistent, and nearly quadratic relationship between market price and measured network adoption, together with bidirectional short-run feedback and asymmetric correction toward their long-run equilibrium. Among the explanations tested, an approximately Metcalfe feedback relation is now the leading interpretation, although its observable proxies, causal channels, and internal composition have evolved substantially over time.
This is not investment advice. Stephen Perrenod is engaged in econophysics research of Bitcoin in his role as the Vice-Director of the Scientific Bitcoin Institute.
References
1. Giovanni Santostasi, Stephen Perrenod 2026. “A Mechanistic Derivation of the Bitcoin Price Power Law: Network Adoption Dynamics and Generalised Metcalfe Scaling”
2. The Physics of Bitcoin. Giovanni Santostasi 2026.
3. Amphora Analytics 2026.
Comments
Nothing yet. Say the first thing.
Sign in to join the conversation.