
July marked the fourth month since the launch of Quant Atlas. For us, that matters.
Not because four months are enough to prove a model, a process, or a research framework. It is not. Four months is a small sample, especially in markets. But it is enough to begin showing how the system behaves in live conditions, how its signals are structured, and how the research translates into actual trading decisions.
This article is the third monthly update on Quant Atlas trading results. The focus here is on the Vision model, one of our signal models.
Vision is built to generate directional buy and sell signals across markets using a weighted scoring framework.
The goal is not to rely on one indicator, one pattern, or one market condition. That approach is usually fragile. A signal that works in a trending regime can fail badly in a choppy one. A reversal setup can look attractive on paper, but become dangerous when momentum is too strong. Pattern recognition can help, but only when supported by broader structure.
Vision tries to solve this by combining several independent components into one aggregate view. The model is composed of six main components:
Momentum
This component measures directional pressure. It looks at whether the market is showing persistent buying or selling force, and whether that force is improving or fading.
Reversal
This component looks for conditions where price may be stretched, exhausted, or approaching a potential turning point. It is not used blindly. Reversal logic only has value when the broader regime allows for it.
Volatility
Volatility helps the model understand the trading environment. A signal during low volatility does not mean the same thing as a signal during a high volatility expansion. This component helps adjust the interpretation of price movement.
Pattern recognition
This component identifies recurring price structures and technical formations that may carry directional information. The point is not to label charts for the sake of labeling charts. The goal is to extract useful structure from price behavior.
Trend
This component evaluates the broader market direction. It helps the model avoid fighting strong trends too early and gives more weight to signals that align with established direction.
K’s Collection
This is our proprietary collection of indicators and internal research tools. These indicators are designed to capture market structure, pressure, and directional imbalance in ways that standard indicators often miss.
Together, these six components produce a weighted aggregate score. That score is then translated into buy and sell signals in a regime aware way.
In simple terms, the model does not treat every signal equally. It asks a more important question:
Does this signal make sense in the current market environment?
🚨🚨Get your Quant Atlas Free trial (no credit card required) 🚨🚨
Sign up takes ~9 seconds before you have unconditional 10-day access to 100+ institutional market forecasts.
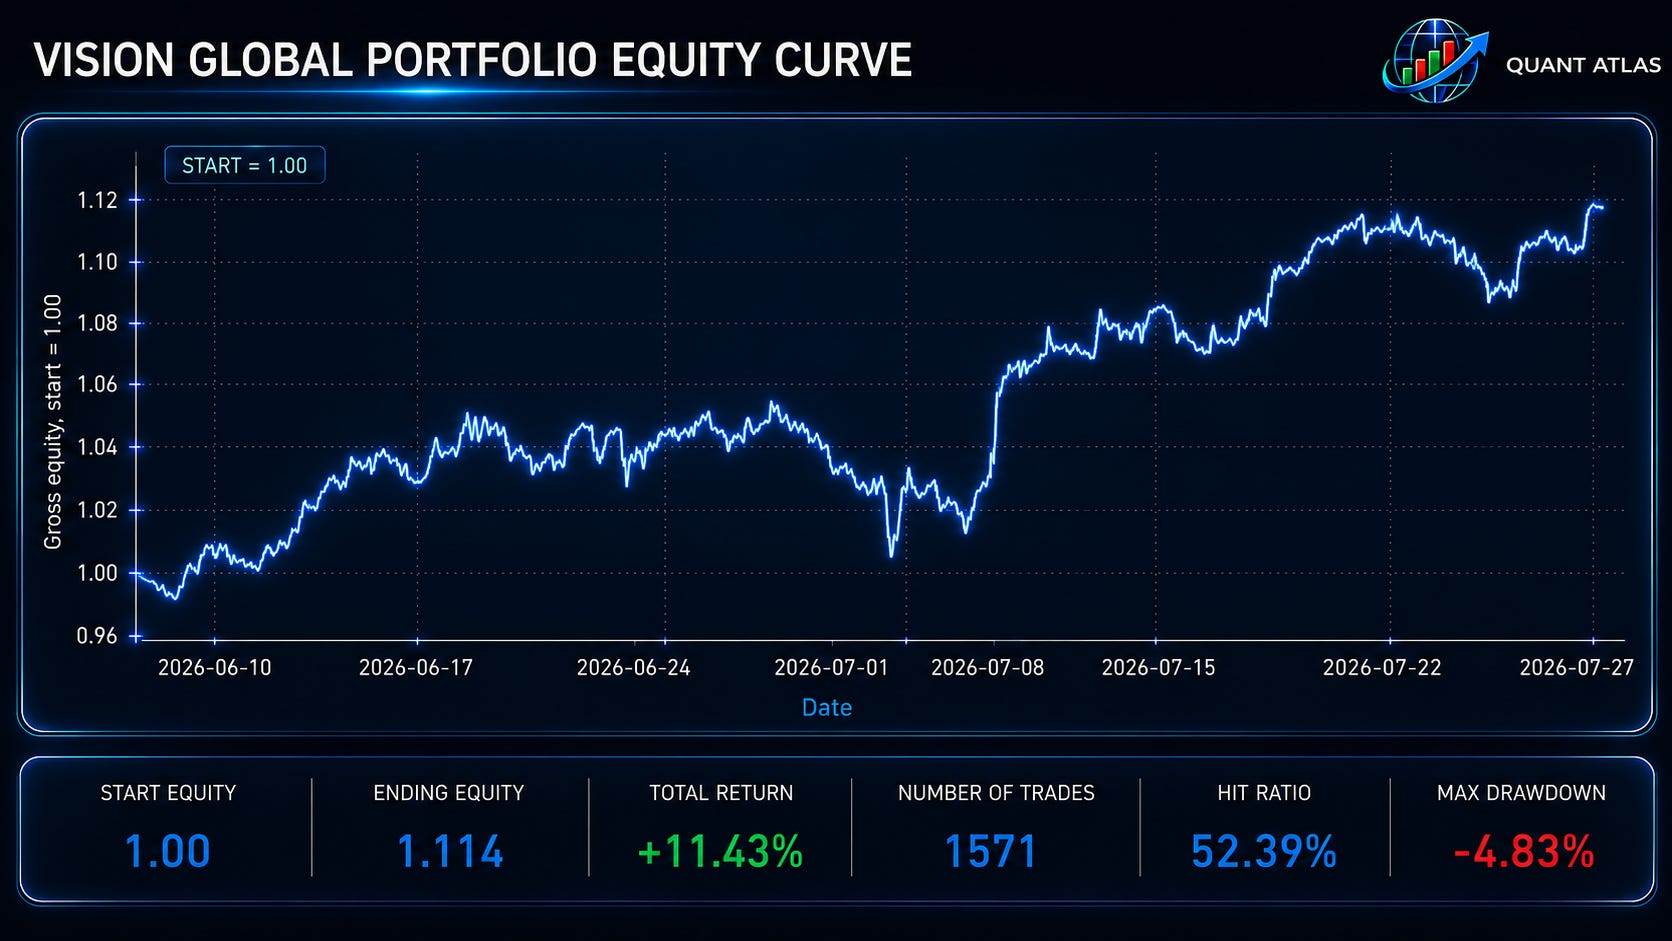
The purpose of this update is transparency. The model will have good months, bad months, clean signals, noisy signals, and periods where it needs to stay selective. That is normal. What matters is whether the process remains consistent and whether the results can be evaluated honestly over time. The following table shows the results since June.
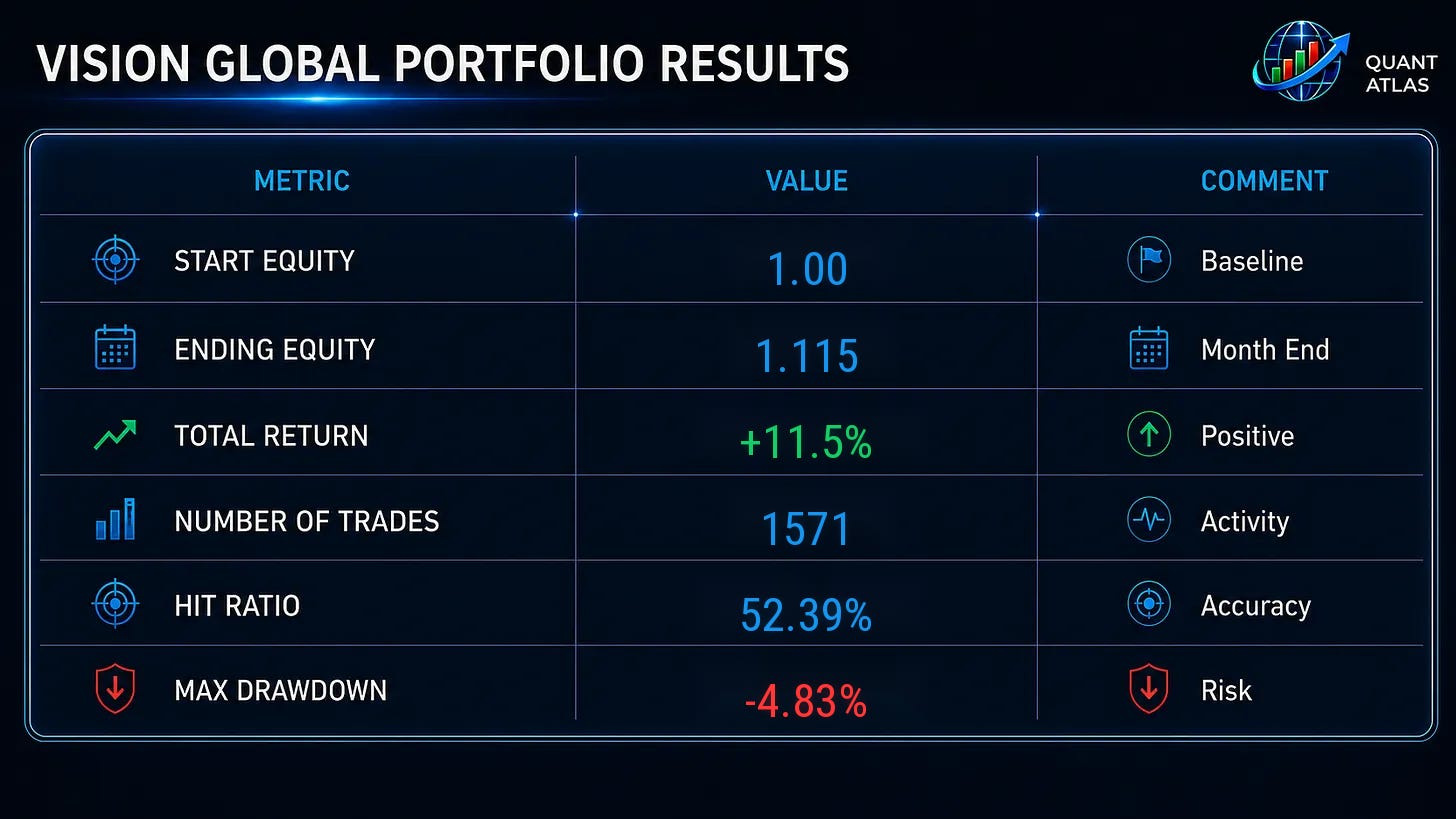
Markets can reward bad logic for a short period and punish good logic over a small sample.
The better question is whether the model is behaving according to its design.
Did it avoid weak environments?
Did it align with the dominant regime?
Did its components support each other?
Did losses stay controlled?
Did the strongest signals come from clear aggregate alignment rather than isolated indicator noise? Those are the questions that matter.
Vision is built around the idea that trading signals should not be judged in isolation. A buy signal supported only by momentum is weaker than a buy signal supported by momentum, trend, volatility structure, and pattern recognition. A reversal signal without regime support is usually fragile. A pattern without confirmation is often just decoration.
The aggregate score is what gives the model its structure.
🚨🚨Get your Quant Atlas Free trial (no credit card required) 🚨🚨
Sign up takes ~9 seconds before you have unconditional 10-day access to 100+ institutional market forecasts.
No posts
Comments
Nothing yet. Say the first thing.
Sign in to join the conversation.