
Every day, Quant Atlas scans 100+ global markets and searches for result-driven strong conviction forecasts.
The goal is not to chase every move. The goal is to identify interesting plays.
🚨 Check out our latest market forecasts (no credit card required) 🚨
Sign up to Quant Atlas takes ~9 seconds before you have 10-day access to 100+ markets.
Every month we publish our seasonality-based forecasting for the main markets.
The July seasonality forecast presents a broadly constructive outlook across risk assets, commodities, and selected currency pairs, based on a model that studies approximately 20 to 30 years of historical seasonal behaviour. In a previous article, we have shown what to expect for July. Let’s see how the views are going.
The current hit ratio is 82% on 11 markets.
An equally-weighted unlevered portfolio of $1,000,000 in July would have made $38,700 gross, or around 3.87% month-to-date.
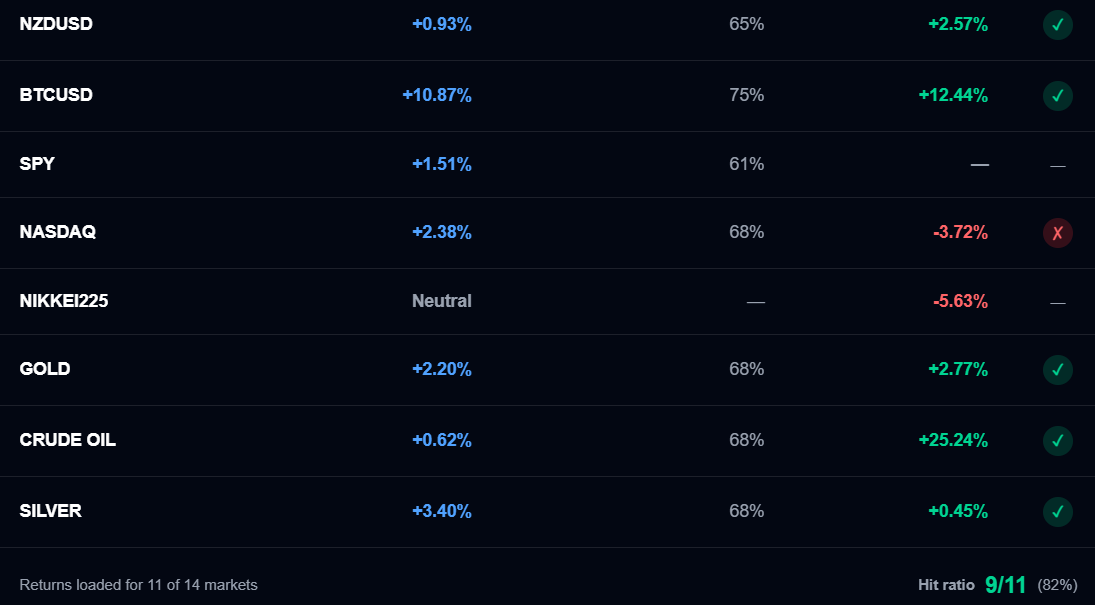
Rather than forecasting a single trading session, the model maps the expected direction and approximate return across the full month, making it particularly relevant for swing traders looking to position around recurring monthly tendencies.
Quant Atlas provide timely forecasts for 100+ global assets (FX, EM, IX, cryptos, stocks, rates, and commodities). Forecasts are ranked by conviction, and strong conviction views are pushed onto subscribers through a notification system.
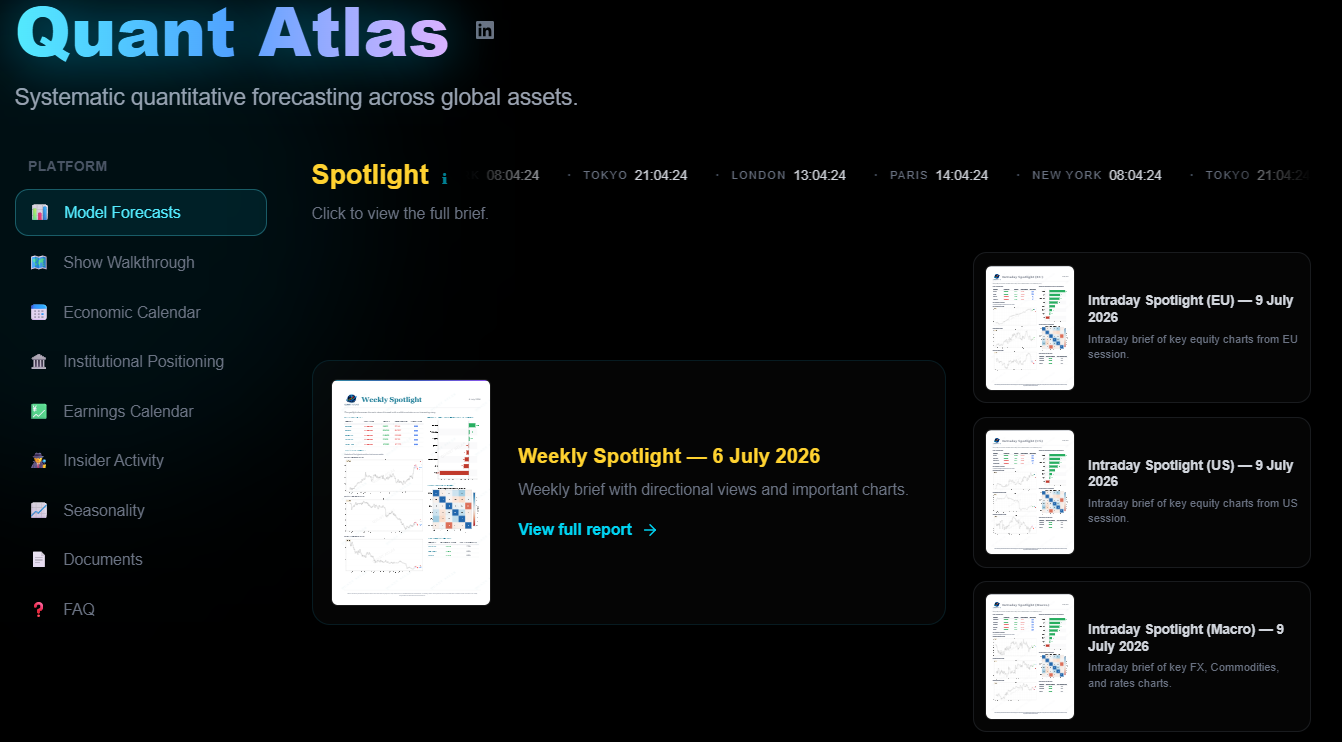
Forecasts are published on the website in the form of charts.
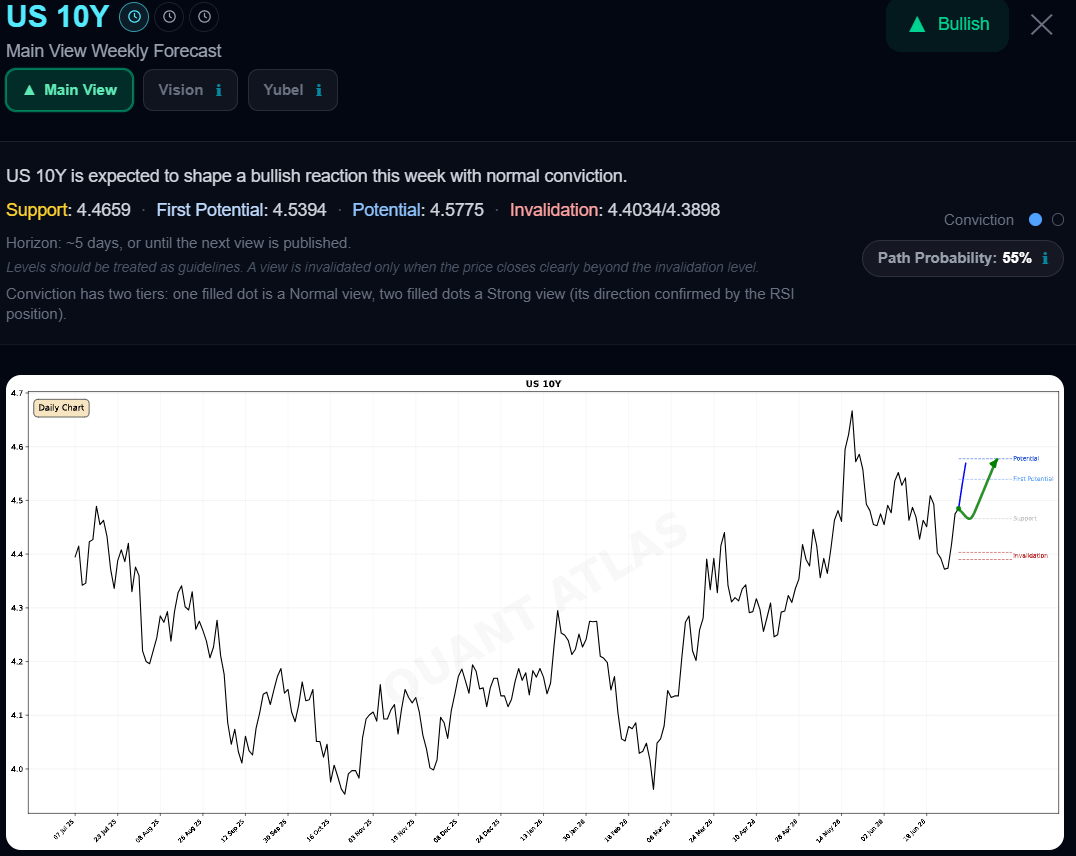
A strong conviction view is represented by two full blue dots as illustrated in the following example.
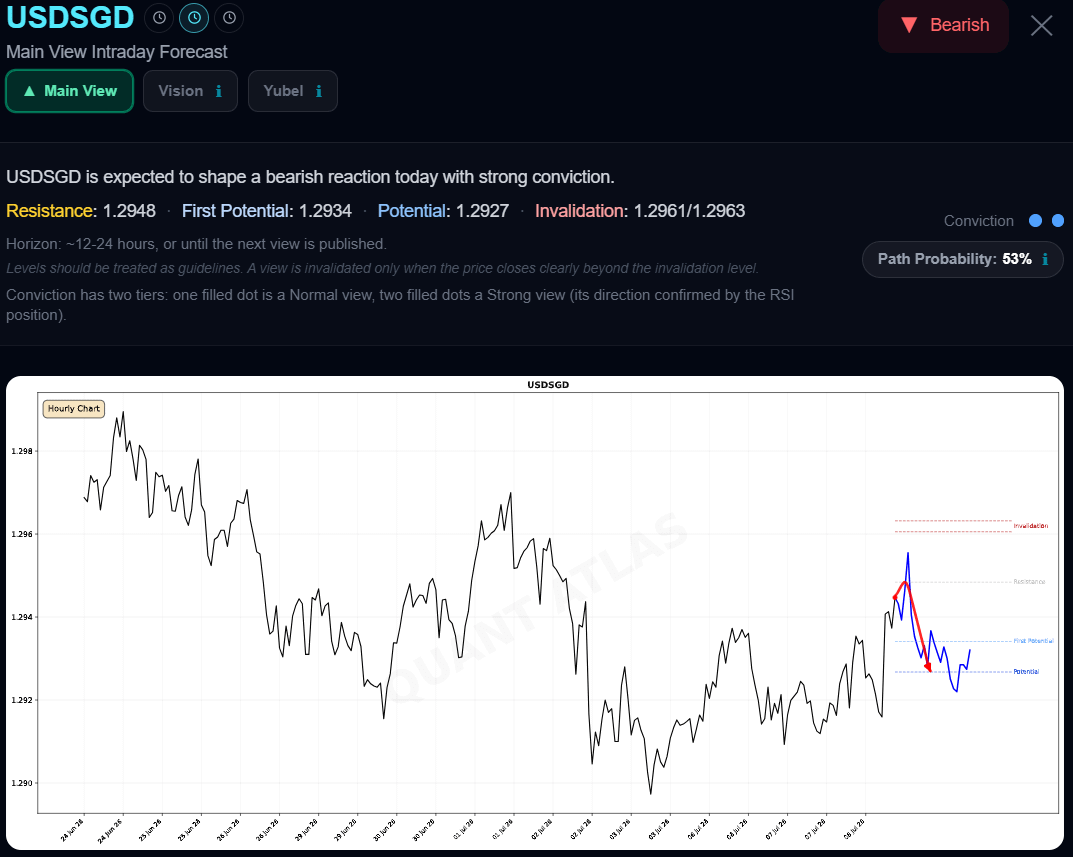
Charts are updated after the forecast to reflect the evolution of price. This allows subscribers to evaluate the forecast. You can also view past charts to evaluate past forecasts.
There are two types of time horizons. We publish Weekly views (once per week on Mondays with a forecasting life span of around 5 days) and Intraday views (once per day with a forecasting life span of 12-24 hours). Weekly views use Daily bars in the charts and Intraday views use Hourly bars in the charts.
The frequency of publication is regular. Weekly views are published early in the morning NY time and intraday views are published around 7:00 AM NY time every day.
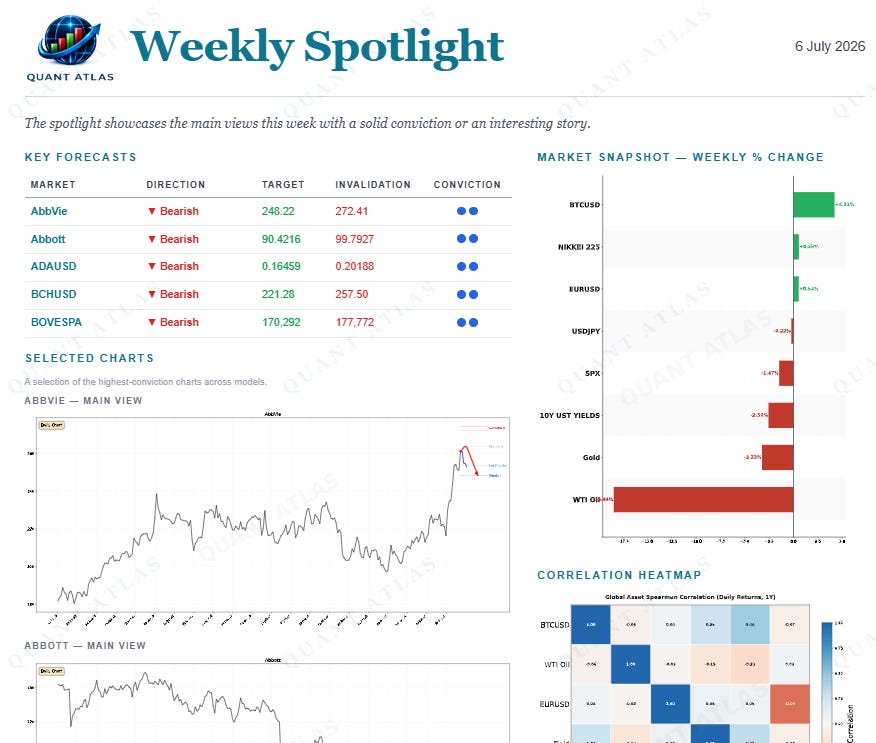
The Spotlight summarizes the views and shows some interesting charts. It’s a quick read if you don’t have enough time to go through the whole list of markets.
You will also find market intelligence tools on the website such as:
Institutional positioning,
Insider activity,
Earnings calendar,
Seasonality tables,
🚨🚨Get your Quant Atlas Free trial (no credit card required).
Sign up takes ~9 seconds before you have unconditional 10-day access to 100+ market forecasts.
No posts
Comments
Nothing yet. Say the first thing.
Sign in to join the conversation.