
If you run a software company, you have an observability tool – the thing that tells your on-call engineers when the site is broken, which server is on fire, and whether last night’s deployment made things slower. For a huge number of companies, that tool is Datadog. The bill is a problem, and the way the industry is trying to solve it is wrong.
About a year ago, I was interviewing for my first job in the AI space, and I spent a bunch of time with some agentic SRE companies (AI tools that try to automate the on-call engineer’s job). As a part of my diligence process with one company, I requested a customer reference call, and spoke to one of their design partners. One of the most important things you can do when doing a customer reference is seek to understand how much of a painkiller the product is (people buy painkillers, not vitamins). So I asked:
“What would your engineers say if you took this product away from them?”
His response: “Well, they’d probably complain a bit.”
Oof. It was probably the worst answer I could have gotten. The product was completely nice-to-have. Can’t sell that.
The next thing he said, though, upended my worldview and has stuck with me for the past year. We’ll get there.
I wrote recently about why every AI application is fundamentally a data application. This post is what happens when you point that thesis at the observability market – all $60-plus billion of it – and follow the logic to its conclusion. The companies looking for a cheaper Datadog are asking the wrong question. The answer isn’t a cheaper Datadog. It’s a different architecture entirely.

Before I go any further, I want to establish that Datadog is brilliant software. They’ve invested so much energy in making it easy to get started and fast to get visibility into your applications. No company is going to go live without some sort of observability solution, and Datadog has an absolute stranglehold on that market.
The problem is that Datadog is the worst kind of golden handcuffs. Not the kind where you’re grumpy about staying at your current company because your options are worth so much that you can’t afford to leave and have to exercise it all (I hope your champagne tastes terrible). These are the kind of golden handcuffs where they’re impossible to get out of, and you voluntarily buy them, put them on, and then you sign a subscription agreement to wear them that costs you 2x every year.
The brilliance of Datadog’s business model is that it’s just so easy and so simple to buy one product. And then you look over their product catalog, and you’re kind of like “oh, that one might be nice too. And that also seems valuable,” and before you know it you’re subscribed to seven different Datadog services. And the dashboards for the newest one you bought relies on data from three of the others you already have. You are officially locked the fuck in. And there’s no ceiling. Buckle up.
Their pricing model is tightly aligned to your success. You bring more volume, you pay more. It’ll never taper off, you’ll never get economies of scale. You’re just resigned to periodic emails from your CFO saying “we’re spending what??”
But here’s the part that should make you genuinely angry.
To keep costs even remotely manageable, most Datadog customers are forced to sample or subsample their telemetry data over time. You’re dropping logs. Losing granularity. Shortening retention windows. Deleting your data after days instead of weeks. You are paying for an observability platform that requires you to throw away observability data to afford it. It’s like paying for security cameras, then turning most of them off because storing all the footage is too expensive. When something actually goes wrong, the moment you need is exactly the moment that didn’t get recorded. The fidelity of your understanding of your own systems degrades over time, by design, because the alternative is a bill that would make your CFO cry.
And when you need to debug a production incident from three weeks ago (and you will – the gnarly ones are always slow-burn regressions that nobody noticed until something caught fire) – the data you need might already be gone. You paid to collect it. Then you paid again by losing it.
This is not a pricing complaint. This is a structural flaw in the model. And it’s the flaw that everything else in this post is about.

That Datadog bill is basically public enemy number one for every *aaS CFO, and so inevitably people start looking for ways out. The other big platforms – Splunk, Elastic, etc. – have already bled out, been bought, forked, or fallen behind on innovation. So how do we cut our costs?
Enter Grafana. Grafana is one of the most popular answers because it is a) open-source, b) modular, and c) cheaper. They’ve got Grafana for viz, Loki for logs, Mimir for metrics, Tempo for traces, Pyroscope for profiles. Sweet, sweet freedom!
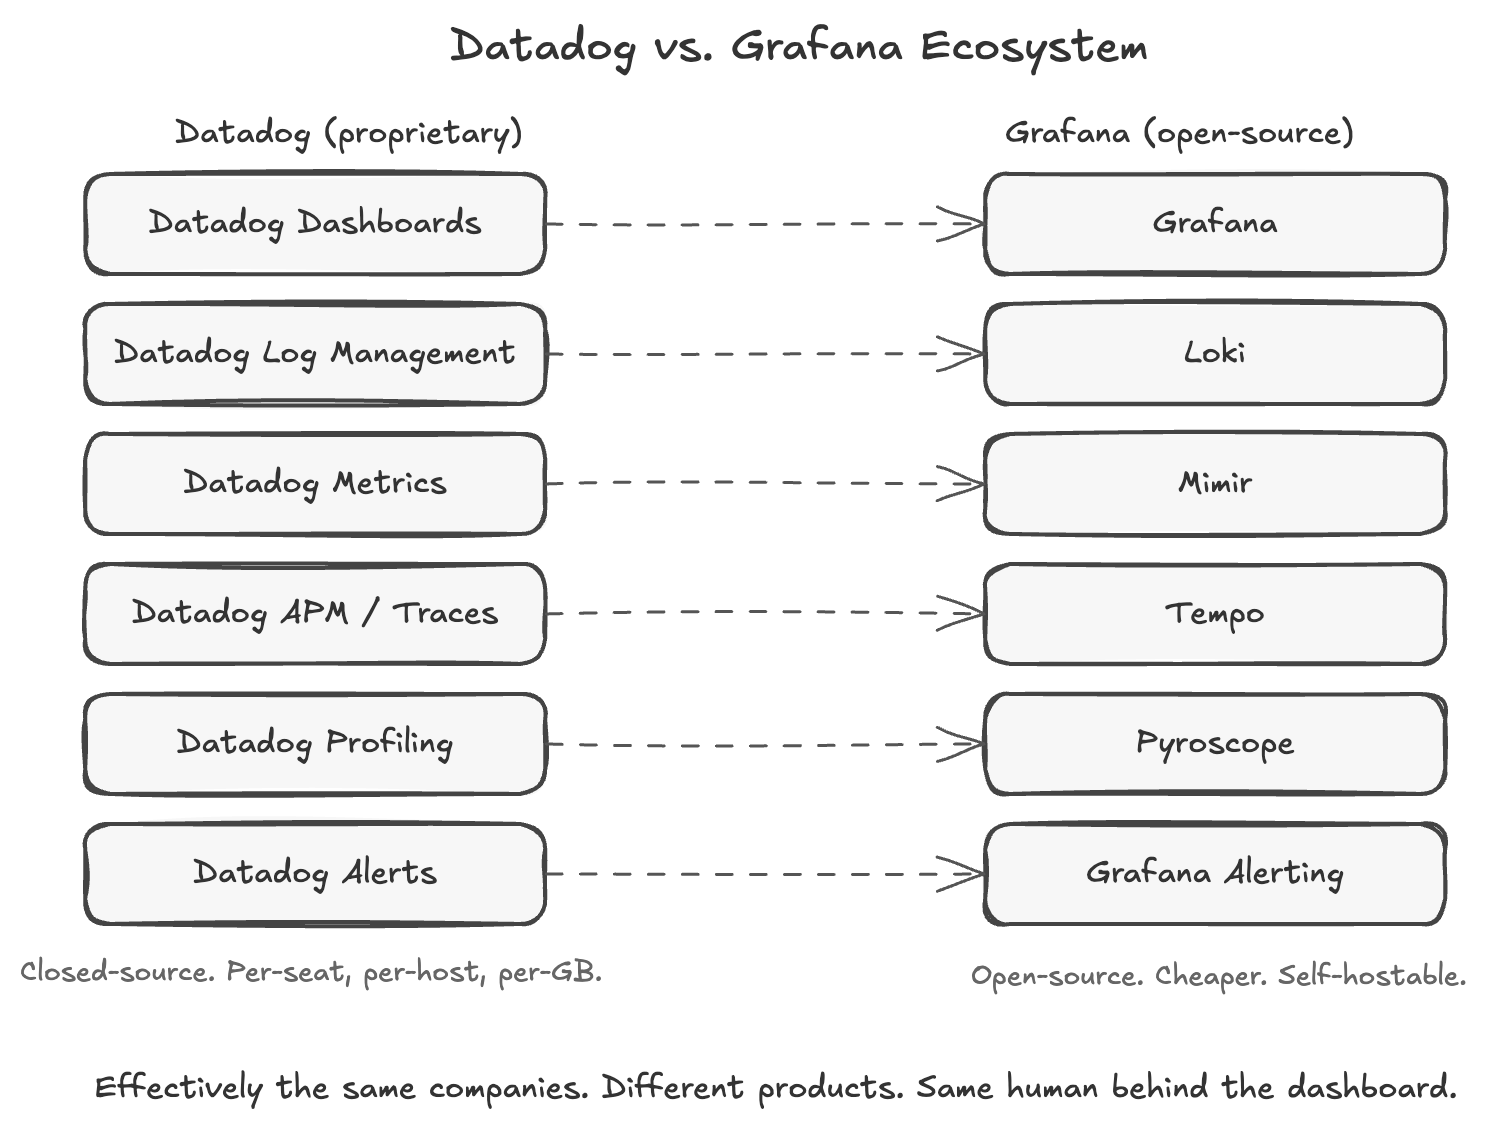
The beauty of Grafana is that you can have both Grafana and Datadog! You still have to untangle the Datadog dependency chain, but if you can get things like logs and metrics out of Datadog, you’re going to save a boatload of money, because those are priced heavily on volume. Grafana provides a fantastic visualization experience, so you introduce a pivot point during investigations, but if it’s saving you a large amount of cash, it’s probably going to be worth the slight hit on the time it takes to resolve an incident. Long-term, the goal is to get fully off Datadog, but that takes a lot of time and effort.
The bigger problem is that you still haven’t changed the paradigm. A human SRE still stares at a dashboard. A human still writes queries. A human still builds alerts, still gets paged at 3am, still manually correlates logs with traces while bleary-eyed and holding terrible coffee. The consumption pattern is identical. You’ve disaggregated the vendor layer but kept the same human-in-the-loop architecture underneath. The cost gets better. The operational model doesn’t change at all.
The real disaggregation of observability isn’t about swapping who provides the dashboard. It’s about eliminating the need for the dashboard in the first place.
So the AI SRE arrives on the stage. It’s an extremely popular category, because there’s a clear line that you can draw directly from AI SREs to lower costs. AI SREs can think faster than humans, they pivot in an instant, they know every inch of your infrastructure inside and out. Incidents are resolved faster, your exhausted SREs are asleep at 3am instead of doom-scrolling PagerDuty alerts. People are genuinely happy. Your CFO is amped, because you just presented a plan to reduce the number of on-call staff during your peak season.
This is great! Can’t fail! What would go wrong??
Well…I hate to break it to you, but the way these current agentic SREs work is by sitting on top of existing platforms. Your new always-on SRE still uses Datadog, still uses Grafana, and is a basically really smart Datadog query generator. So you’re not actually reducing your dependency on those tools, because you still rely on access to the systems to do your root cause analysis.
Now, to be fair, AI SREs probably do reduce cost somewhere: headcount. You can run leaner on-call rotations. You can maybe get away with fewer production engineers. That’s real savings, and I don’t want to hand-wave it. But the Datadog bill and the headcount bill are decoupled costs. Fewer humans on the SRE team doesn’t shrink your telemetry volume. It doesn’t reduce your log ingestion. It doesn’t make your custom metrics cheaper. You’re saving on the people side while the platform side keeps compounding – and the platform side is the one that scales automatically with your infrastructure, with no ceiling in sight. The AI SRE makes the humans cheaper. It doesn’t touch the data cost.
So you’re paying for Datadog AND the AI SRE layer. The total observability spend goes up, not down. Depending on headcount savings, maybe the net infrastructure-plus-people number compresses a bit. But the Datadog line item? That doesn’t move.
Which brings me back to that reference call. “What would your engineers say if you took this product away from them?” “They’d probably complain a bit.” He described a really nice vitamin. I mean, I guess I take hangover pills after I drink, so maybe there’s a business there?

But then he continued.
He told me “but in five years, I don’t think they’re going to be able to live without it.”
Sit with that for a moment.
The reason the business is most likely to be durable isn’t because it solves an egregiously painful problem now, or even that it’s a must-have product. It’s because as AI proliferates, humans are likely to atrophy existing skillsets. They’ll become so used to having an assistant at their fingertips, that they won’t be able to operate without it. With AI, you don’t need Datadog to know how to use it. Honestly, the product doesn’t even need to improve. It just needs to get to a good enough state where humans rely on it more than they go directly to the data source.
To give a concrete analogy, nearly every time I get into my car, unless I’m going somewhere that is really close, and I know every turn to get there, I plug in my phone and get directions from Google Maps. It’s a reflex at this point. I’m old enough to remember printing out MapQuest directions, and memorizing them so that I wasn’t trying to look down at a piece of paper while I was driving. Now, if you gave me an area map and asked me to get somewhere, I’d give up before I got in the car. We’re just incapable of getting anywhere without a GPS at this stage.
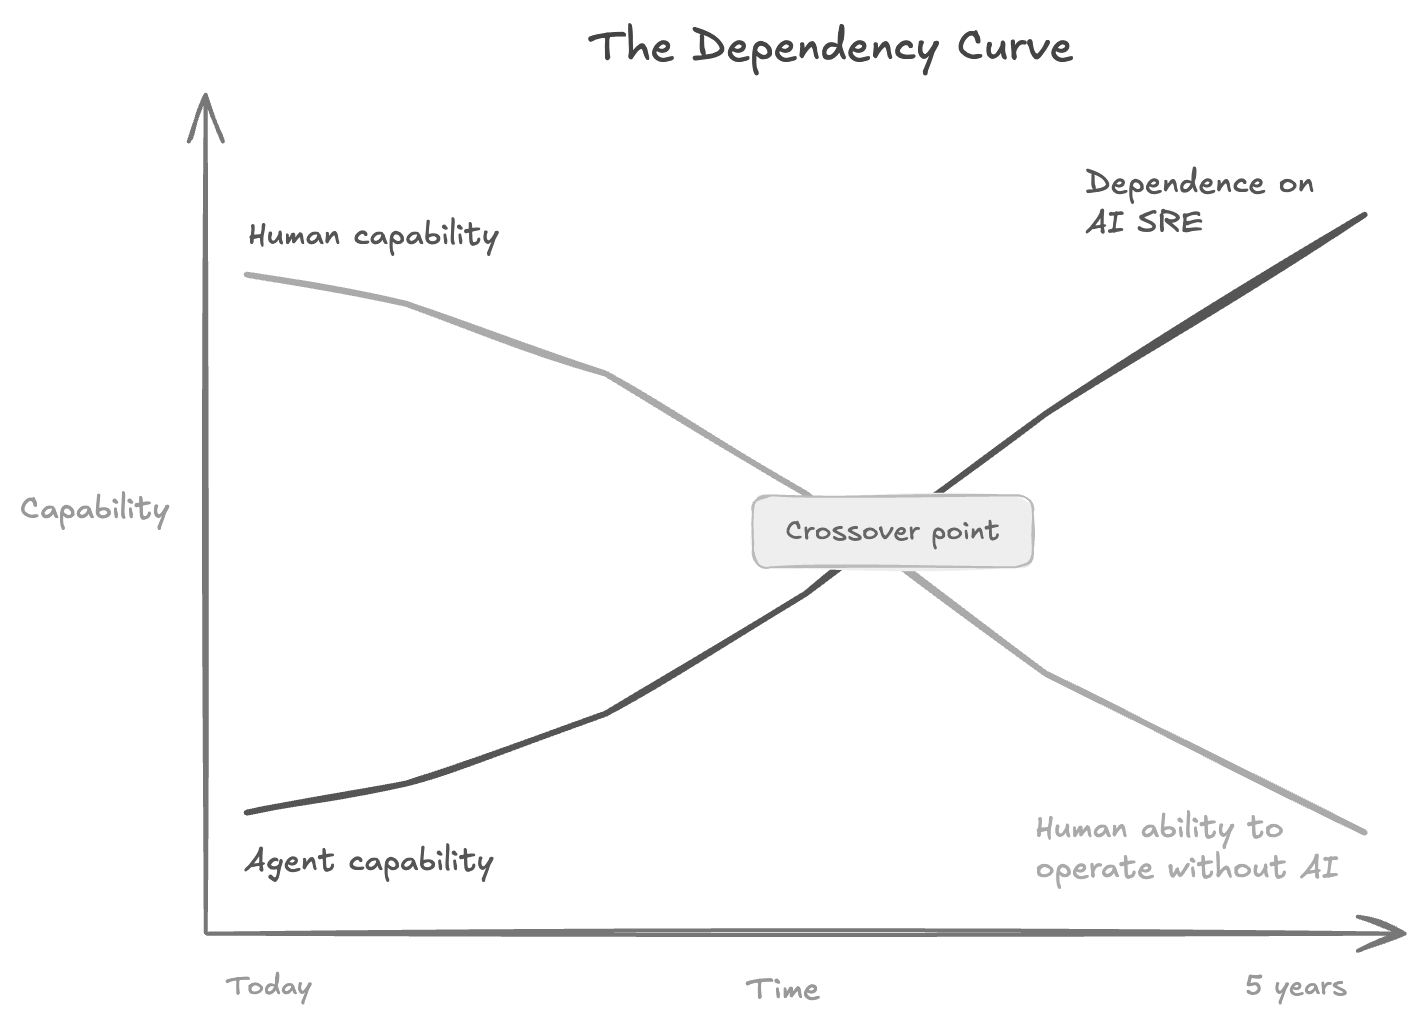
But let’s take this whole thing to a more logical conclusion. Every dashboard, every chart, every cleverly-designed heatmap exists for one reason: human eyes. A human can’t read a million rows, so the chart turns those rows into a shape a human brain can absorb. An agent doesn’t have eyes. Every pixel in your Datadog dashboard is a translation layer for a user that doesn’t need things translated anymore.
So what does the agent actually need? Data. And a way to ask questions.
That’s a database, folks.
Datadog knows where this is going. They employ very smart people, and they’re building their own AI SRE – Bits AI. Smart move, obvious move. But the better Bits AI gets, the more it trains Datadog’s own customers to stop interacting with the UI. Every improvement to the agent experience erodes the value of the thing Datadog charges a premium for: the platform experience. The dashboards, the visualizations, the carefully designed UX – that’s the margin layer, and their own AI product is teaching users they don’t need it.
Building the right product undermines their own pricing model. That’s not a problem you can product-manage your way out of. (I’m sure they’re trying. I’d love to be a fly on the wall in those product reviews.)
Telemetry data tends to look a very particular way. Billions of rows. Mostly numbers and timestamps. Almost never updated after it’s written. It’s queried in big sweeps to answer questions like “what happened to error rates yesterday between 2 and 4pm?” If you described that to a database engineer without naming it, they’d say “you need an analytical database” before you finished the sentence.
Datadog knows this. They’re running a custom-built analytical database underneath their platform, because they needed something that performed really well for telemetry-shaped data. So when you’re paying Datadog, you’re paying platform margin on top of database economics. (This is, if you think about it, the entire business model: charge platform prices for a database workload. It’s brilliant until someone notices.)
The well-suitedness of telemetry data in analytical systems gets even more obvious if you subscribe to what Charity Majors – who is the CTO/co-founder of Honeycomb and has been one of the loudest voices in observability for a decade – calls Observability 2.0, the unified storage model. The core idea: Observability 1.0 is the “three pillars” model – metrics, logs, and traces as separate data types, stored separately, queried separately. You’re hopping from pillar to pillar during an investigation, correlating by timestamp, hoping the data lines up. Observability 2.0 collapses all of that into a single source of truth: wide, structured log events from which you can derive all the other data types. One storage layer. One place to query. No more bunny-hopping between tools.
The reason this matters for the cost argument: in an Observability 1.0 world, your major cost drivers are the number of tools, the cardinality of your metrics – how many distinct metrics you’re tracking – and the dimensionality, meaning the amount of context and detail you store, which is the most valuable part. You’re locked in a zero-sum game between cost and value. In an Observability 2.0 world, cost scales with your traffic and architecture – your business growth, not your data richness. That’s a fundamentally healthier economic model.
And here’s the kicker: Charity has noted that “every single observability startup founded after 2021 that still exists was built using the unified storage model” – wide, structured log events, stored in a columnar database. The market has already voted. The new builds are all columnar.
OpenTelemetry is what makes all of this actually possible. OTel standardizes how your systems emit logs, metrics, and traces into a common schema. Think of OTel as the S3 of observability: it turns the collection layer into a commodity, which means the value shifts to what you do with the data after it arrives.
And this isn’t a pipe dream. Organizations are aggressively adopting OTel for both traditional and AI observability. Without OTel, disaggregation is impractical – there’s too much platform lock-in. With OTel, disaggregation is inevitable.
The other obvious challenge (for relational databases, at least) is PromQL – the query language metrics engineers have spent years learning. If you’re dealing with metrics, you’re dealing with PromQL, and databases generally speak SQL. So how do you deal with that?
Well, as it turns out, PromQL’s moat is that it’s a human interface. But it’s not an agent interface. Agents don’t give a rat’s ass if you’ve got years worth of curated PromQL queries. They’re just as happy to take those PromQL queries, translate them to SQL, and issue SQL against the database. I assure you, Claude Code knows both PromQL and SQL. It’s gonna be fine.
This is the whole thesis in miniature. Every piece of observability “lock-in” that turns out to be human-interface lock-in – PromQL fluency, dashboard muscle memory, alert configuration syntax, saved queries you built two years ago and never cleaned up – is a switching cost that exists because humans are the interface. Remove the human as the primary query author and those costs collapse. What feels like an impenetrable moat is actually a human-interface moat. And we are building a world – quickly, aggressively, with a lot of venture capital behind it – where the human isn’t the primary interface.
Okay, okay. Before you read any further – I do work for ClickHouse. My opinions often happen to align with my employer’s interests, but they’re my opinions.
The thing Datadog doesn’t have a good answer for is fidelity. ClickHouse’s compression ratios make it economically viable to store raw, unsampled telemetry – everything, full granularity, for as long as you want it. Where Datadog forces you to subsample to control costs, ClickHouse lets you keep the lot.
Concretely: when you’re debugging a production incident that started as a slow memory leak three weeks ago (and you will hit this), the data is still there. Full granularity. Nothing aged out, nothing downsampled, nothing dropped to save a few bucks. You go from “we retained what we could afford” to “we retained everything, and it was cheaper.” That’s not a sales pitch – that’s compression ratios and storage economics. And when storage is that cheap, retention stops being a panic (”what can we afford to not delete this month?”) and becomes an architectural decision (”how long should we keep this?”).
The other thing it does is move fast enough that an agent can actually use it. An AI agent in a ReAct loop – query, reason, query again, refine the hypothesis, query again – needs every step to come back fast. A 30-second response kills an agentic workflow dead (the agent just sits there, context window open, burning tokens and going nowhere). A 200-millisecond response lets the agent iterate ten times in the same window.
Here’s what that looks like in practice. Picture a real outage where a small config change two hours ago is breaking checkout. A spike in 5xx errors hits your checkout service at 2am. The agent queries error rates by endpoint, isolates it to the payment flow, pulls traces for failed requests and sees they’re all timing out on a downstream call to your inventory service. It queries the inventory service’s resource metrics over the past 6 hours, finds connection pool exhaustion that started creeping up after a config deploy that afternoon. Root cause: someone halved the max pool size in what they thought was a staging environment. Eight queries, two minutes, zero humans paged, and the agent’s already opened the rollback PR.
Sub-second queries on billions of rows isn’t a nice-to-have here. It’s the engine underneath the whole “agent as primary interface” idea.
Not a whiteboard architecture. Not a “what if.” A shipping product: OTel for collection, ClickHouse for storage and query, HyperDX for the visualization layer when humans want to look (because they will, sometimes). The stack compresses. Dashboards become a feature, not the product. You’re paying for data and compute, and that’s it.
Now I do want to acknowledge the obvious counterargument: there is a non-trivial migration cost here. Raw telemetry in a database isn’t plug-and-play. Schema design, retention policies, materialized views for common query patterns, pipeline management – it’s real engineering investment. For companies with strong platform engineering teams and meaningful scale, that tradeoff is a no-brainer. You’re already doing harder things than this before lunch. For a 20-person startup that just needs their shit to work? Datadog might genuinely still be the right call. I’m not going to pretend otherwise.
But the line is moving, and it’s moving fast. OTel adoption is accelerating. ClickStack and products like it are collapsing the setup cost. Agents are getting better at working with semi-structured telemetry directly. The question isn’t whether this transition happens. It’s when the crossover point reaches your company.
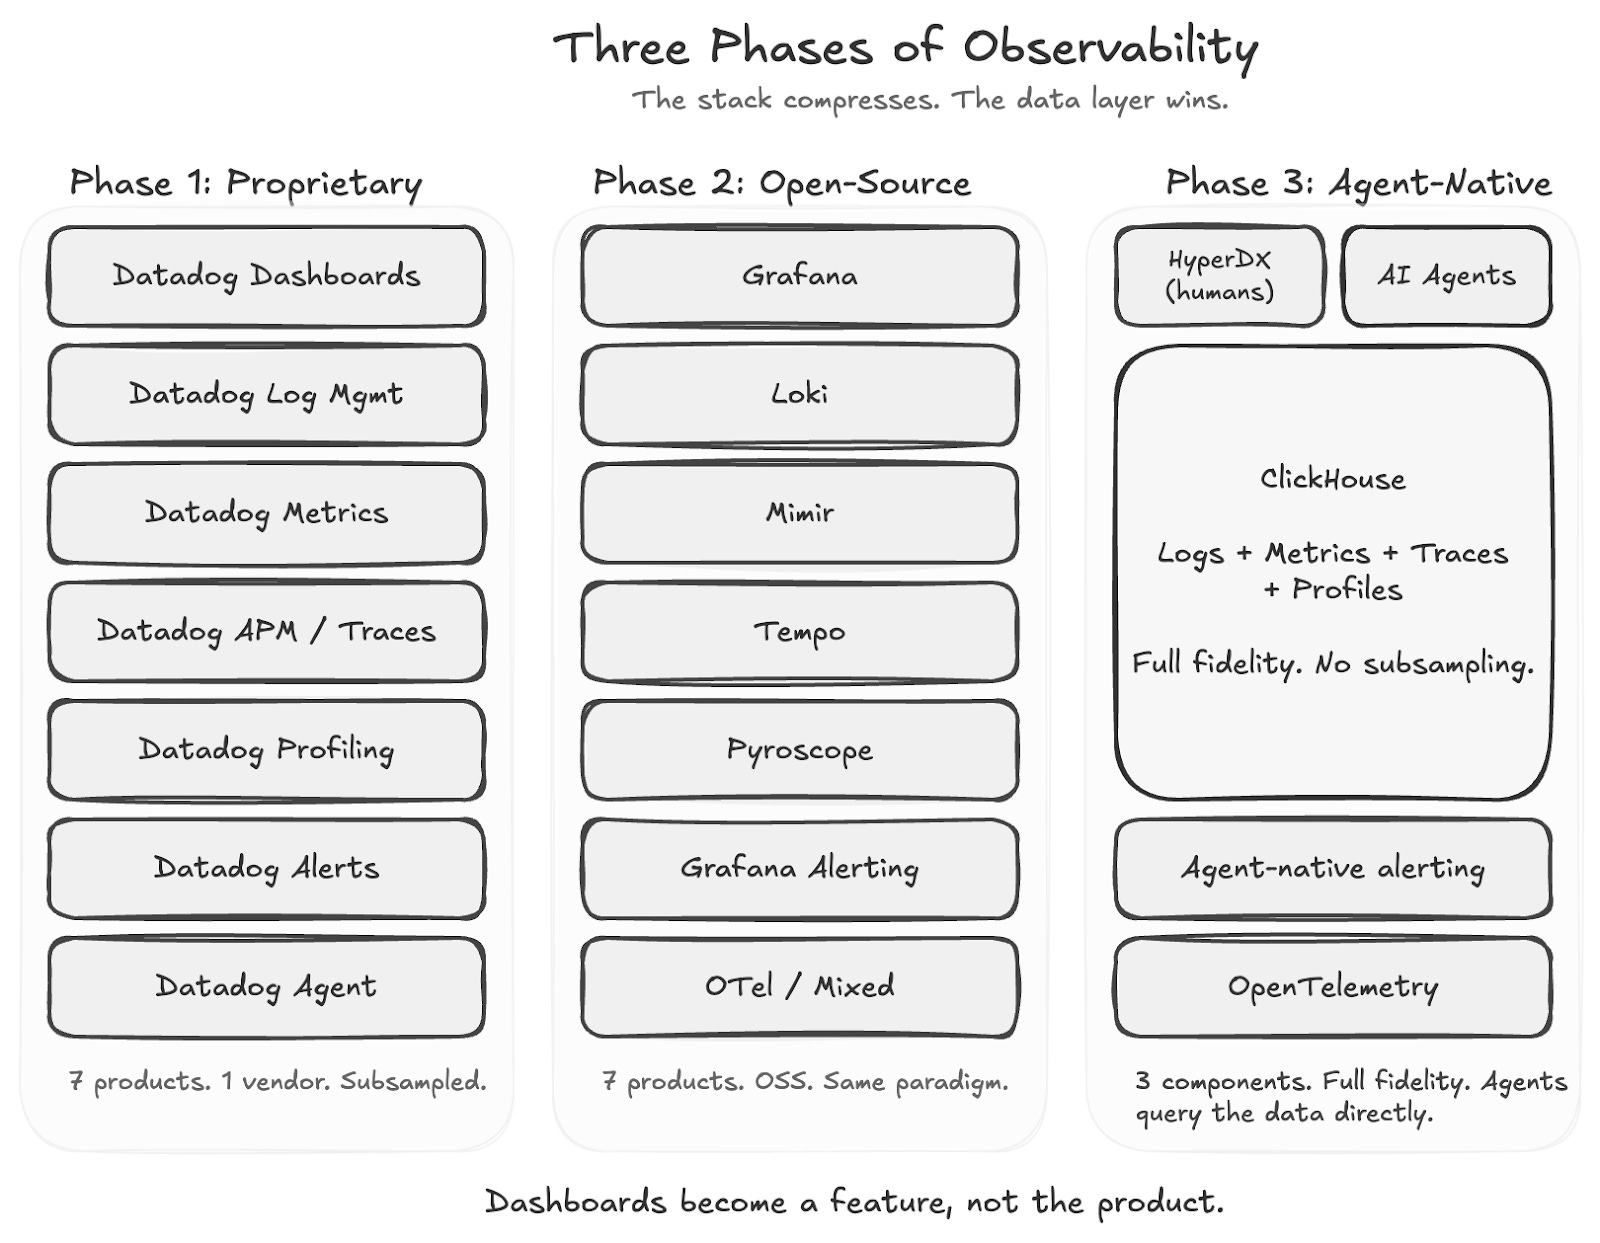
Here’s the thing that sticks with me: the current observability model forces you to throw away your own data to afford it. That’s not a pricing problem. That’s an architectural one. And architectural problems don’t get solved by negotiating a better contract or switching to a cheaper vendor. They get solved by a different architecture.
OTel commoditizes collection. Columnar databases handle storage at a fraction of the cost, without subsampling. Agents handle the reasoning. The UI becomes a feature, not the product. ClickStack is one answer – and it’s a good one – but the whole post-2021 generation of observability startups is building on this same thesis. The direction is clear, even if the timeline is debatable.
My bet, obviously, is sooner than most people think. But I’m biased.
So, next time you’re staring at your Datadog invoice, don’t ask “how do I make this cheaper?” Ask “what am I actually paying for?”

No posts
Comments
Nothing yet. Say the first thing.
Sign in to join the conversation.