
“The company has debt” is treated by a lot of investors as a red flag on its own. It isn’t. Some of the best businesses in the world carry debt deliberately, because it’s cheaper than equity and it lets them grow faster without diluting shareholders.
“The company has too much debt relative to what it can service” is the actual red flag. Most people never get to that second sentence, because they never learn how to check it.
Debt is probably the single most misread number in investing, not because it’s complicated, but because most people look at only one number, in isolation, and stop there.
Let’s fix that.
If I tell you a company has ₹200 crore in debt, you genuinely cannot tell whether that’s fine or alarming. It depends entirely on the size of the business, what the debt is funding, and whether the business generates enough cash to service it comfortably.
A ₹200 crore debt load on a company with ₹50 crore in annual operating profit is a very different situation from the same debt load on a company with ₹500 crore in operating profit. The number needs context before it means anything.
That context comes from ratios, not the raw figure.
This is the single most useful debt ratio, and the most overlooked. It answers one question directly: can the company comfortably pay the interest on its debt, using the profit it generates from actually running the business?
The formula is simple: Operating Profit (EBIT) divided by Interest Expense.
Here’s how to read the result:
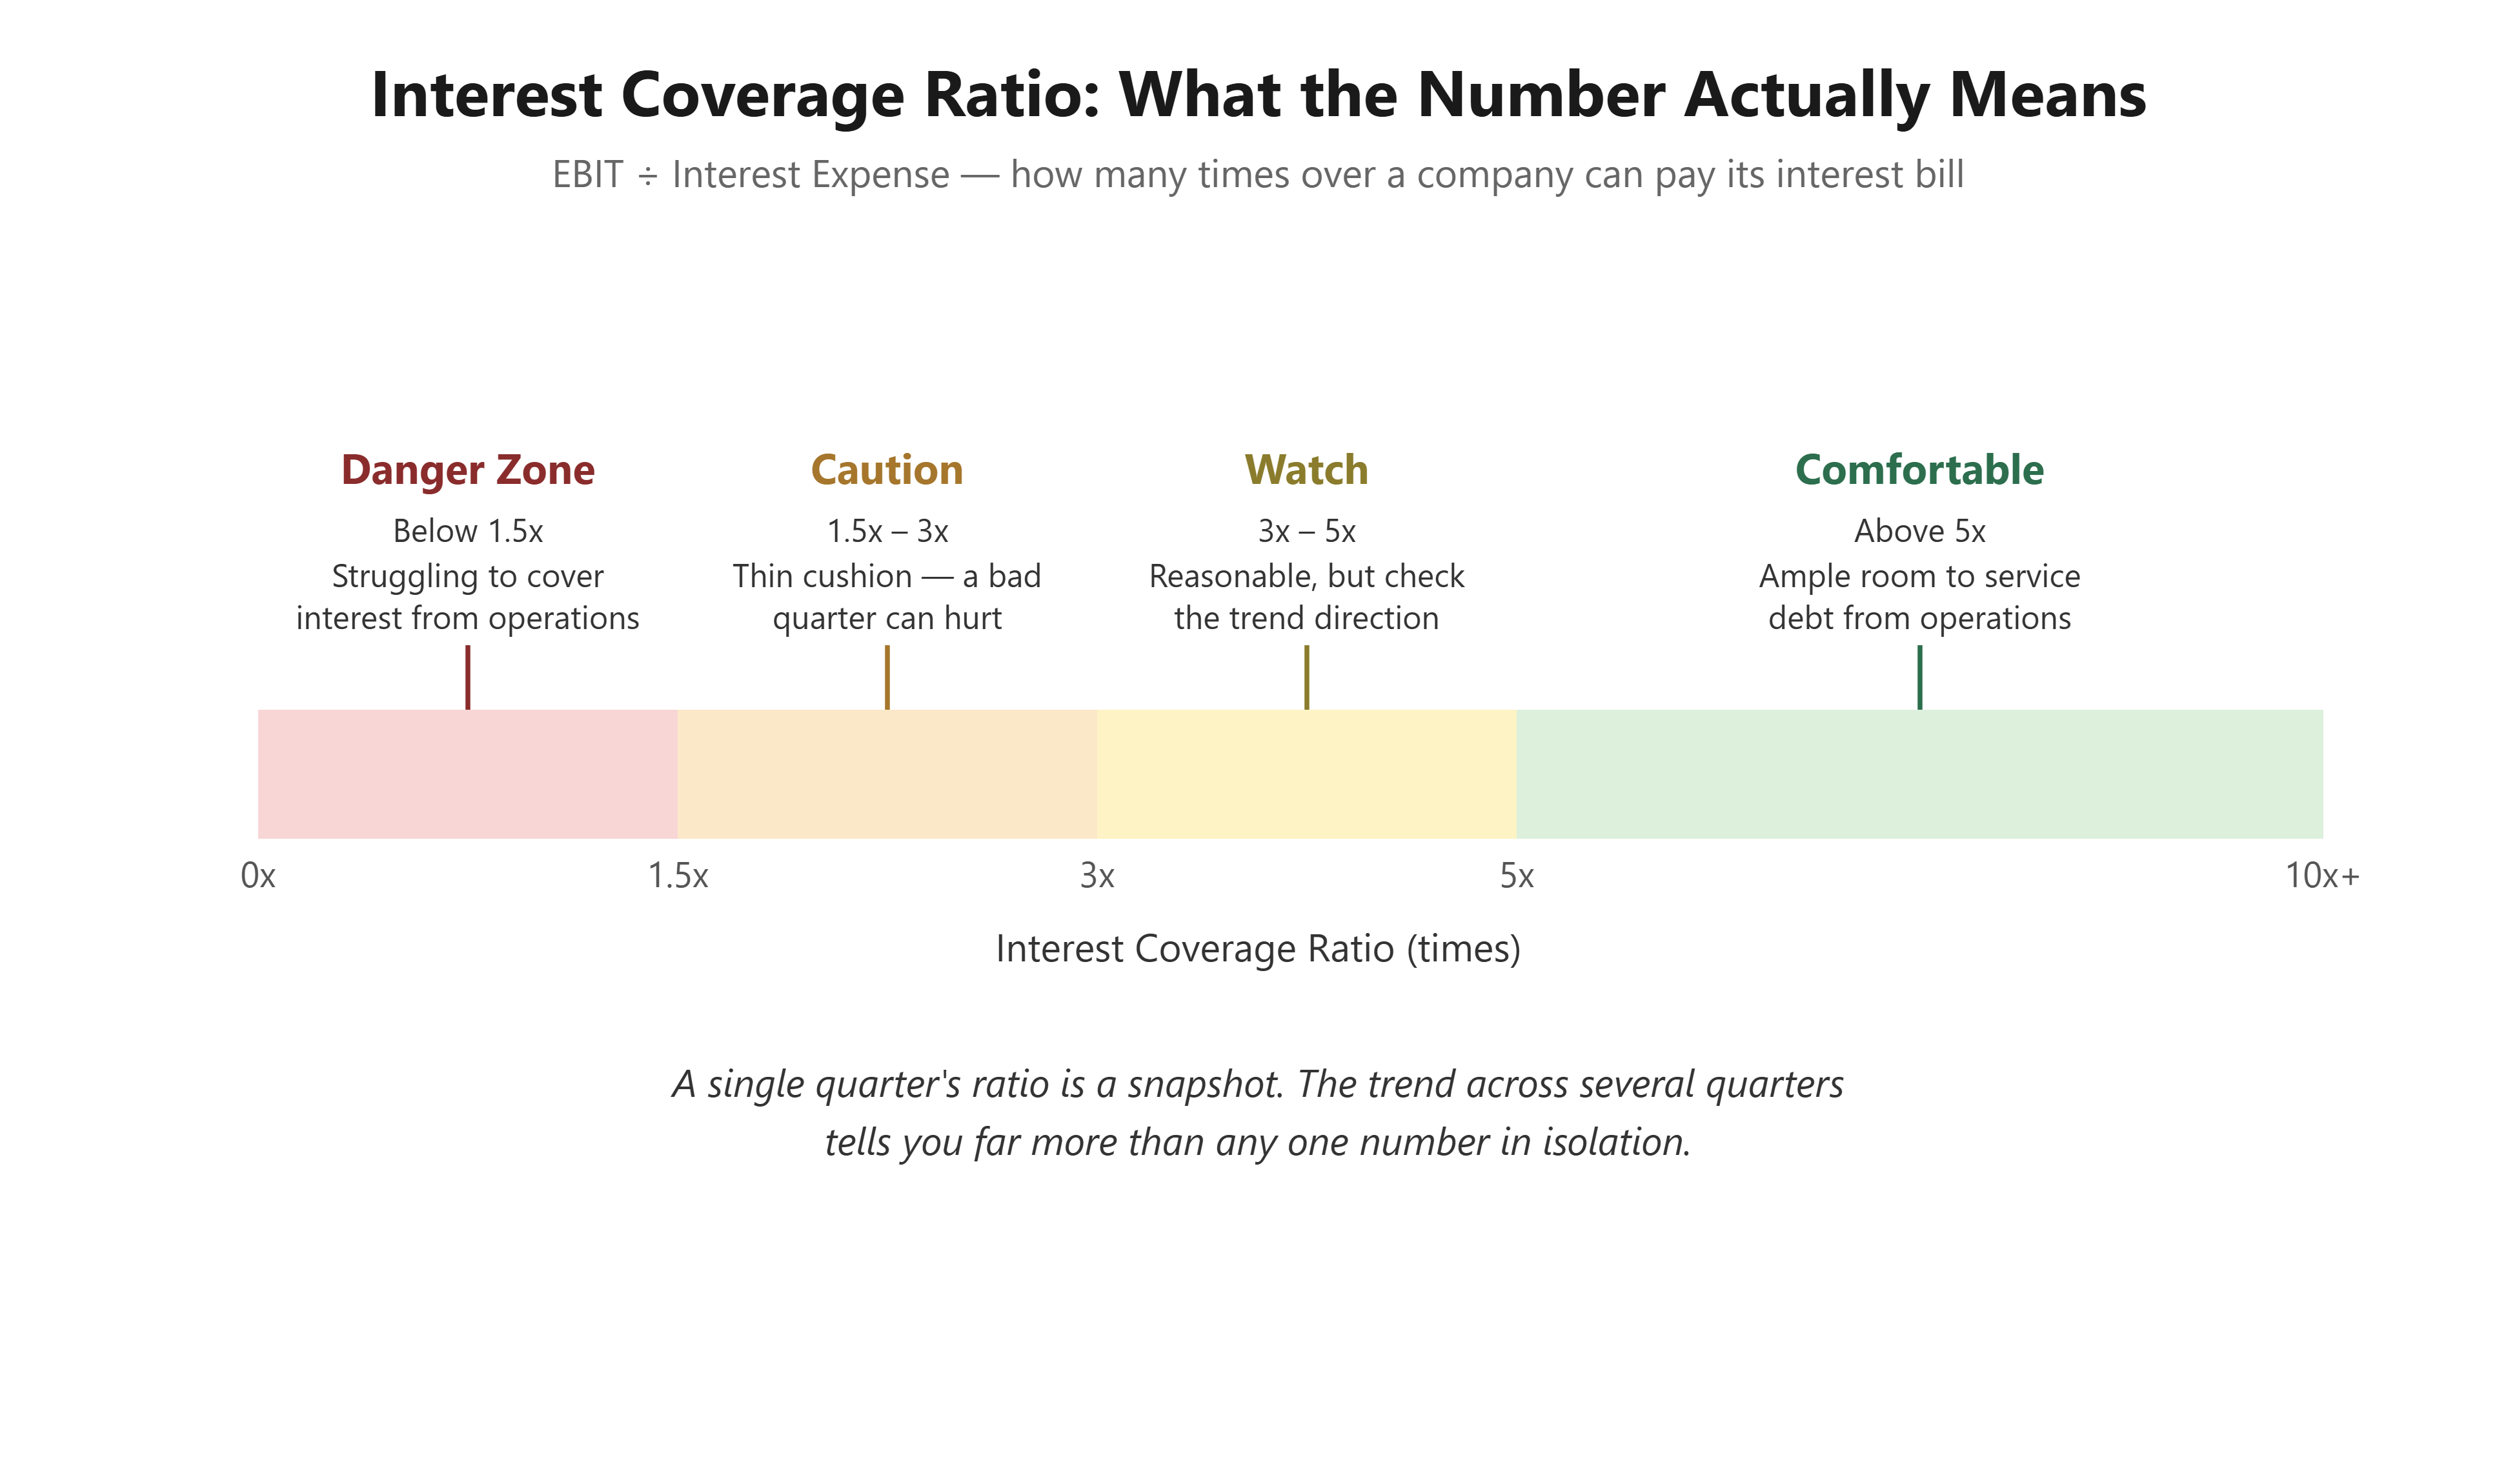
If a company’s interest coverage ratio is below 1.5 times, it means operating profit barely covers the interest bill, let alone leaves room for anything else, like repaying principal or investing in growth. That’s a genuinely fragile position. Above 5 times, a company has real breathing room, and a single weak quarter isn’t going to threaten its ability to service debt.
One number, checked over several quarters rather than just the latest one, tells you far more than the raw debt figure ever will.
This ratio compares total debt to shareholder equity, and tells you how much of the business is funded by borrowing versus by the owners’ own capital.
There’s no single “correct” number here, because it varies hugely by industry. A capital-intensive manufacturing or infrastructure business might run comfortably at a debt-to-equity ratio of 1 or higher, because the business model assumes leverage. An asset-light services business carrying the same ratio would be a much bigger concern, because it doesn’t have the same hard assets to fall back on if things go wrong.
The useful comparison isn’t debt-to-equity in isolation. It’s debt-to-equity compared to close industry peers, and compared to the same company’s own history over the last several years.
This is where a lot of confusion creeps in, because different sources sometimes report different numbers, and it’s rarely explained why.
Gross debt is simply everything a company owes in borrowings. Net debt subtracts the cash and cash equivalents the company is holding. A company with ₹200 crore in gross debt but ₹150 crore sitting in cash and short-term investments has a net debt position of just ₹50 crore, a much healthier picture than the gross number alone suggests.
This matters in practice, not just in theory. It’s entirely possible to see one data provider report a company’s debt rising, and another report it falling, in the same period, simply because one is tracking gross debt and the other net debt, or because they’re measuring at different points in a quarter where cash and borrowings both moved. When you see numbers that don’t match across sources, this is often the first thing to check before assuming either one is wrong.
Not all debt serves the same purpose, and this is easy to miss if you only look at the balance sheet.
Term debt, taken to fund a new factory or long-term capacity expansion, is a different animal from working capital debt, borrowed short-term to bridge the gap between paying suppliers and collecting from customers. Rising working capital debt alongside rising debtor days, for example, can be an early sign that a company’s growth is starting to strain its cash cycle, rather than a sign of expansion funded by legitimate need.
If you see debt rising, the first question isn’t “is that bad.” It’s “what is this actually financing.”
Debt shows up as a single line item on a balance sheet, and it’s tempting to treat a single number as a verdict. But debt is really a relationship between three things: how much is owed, how easily it can be serviced from operating cash flow, and what it’s being used for. Strip away any one of those three, and the number stops meaning much on its own.
This is also exactly why, in a case study we published recently, different data sources reported meaningfully different debt figures for the same company within the same few months. It wasn’t necessarily an error on anyone’s part. It was net debt versus gross debt, measured at different points in a volatile few quarters, each telling a partial version of the same story.
The lesson isn’t to distrust every number you see. It’s to know which version of the number you’re looking at, and to check more than one data point before forming a view.
Whenever you see “debt” mentioned about a company, before reacting either way, ask three quick questions:
Can operating profit comfortably cover the interest, and has that coverage been improving or worsening over recent quarters?
Is the debt-to-equity level reasonable for this specific industry, not industries in general?
Is the debt funding growth, or quietly plugging a widening gap in working capital?
Answer those three, and you’ll understand a company’s debt position far better than 90% of people looking at the same balance sheet.
Next Monday, we’ll look at capital allocation: once a business generates profit, what management actually chooses to do with it, and why that choice matters more than the profit number itself.
No posts
Comments
Nothing yet. Say the first thing.
Sign in to join the conversation.