
Two companies can report the exact same revenue growth. The exact same profit margin. The exact same return on equity.
And five years later, one of them is worth three times more, and the other has quietly destroyed shareholder wealth.
The difference was never in the numbers. It was in the people running the company.
This is the part of investing that frustrates most beginners, because it cannot be calculated. There is no ratio for honesty. No formula for capital discipline. But there are patterns — specific, checkable patterns — that tell you a lot about the people you are trusting with your money.
Today I want to walk through how I actually do this.
A number tells you what happened. It does not tell you why, and it does not tell you whether it will happen again.
Profit can be grown by cutting a marketing budget that should not have been cut. Margins can look stable while quality quietly declines. Revenue can be pulled forward from next year into this year, making this year look better than it is, and next year look worse than it should.
None of this shows up as a lie in the financial statements. It shows up, eventually, as a pattern — and by the time the pattern is obvious in the numbers, the damage to the business is usually already done.
Management quality is the thing that decides whether the good numbers you see today are likely to continue, or whether they were borrowed from tomorrow.
You cannot calculate this. But you can observe it, carefully, over time.
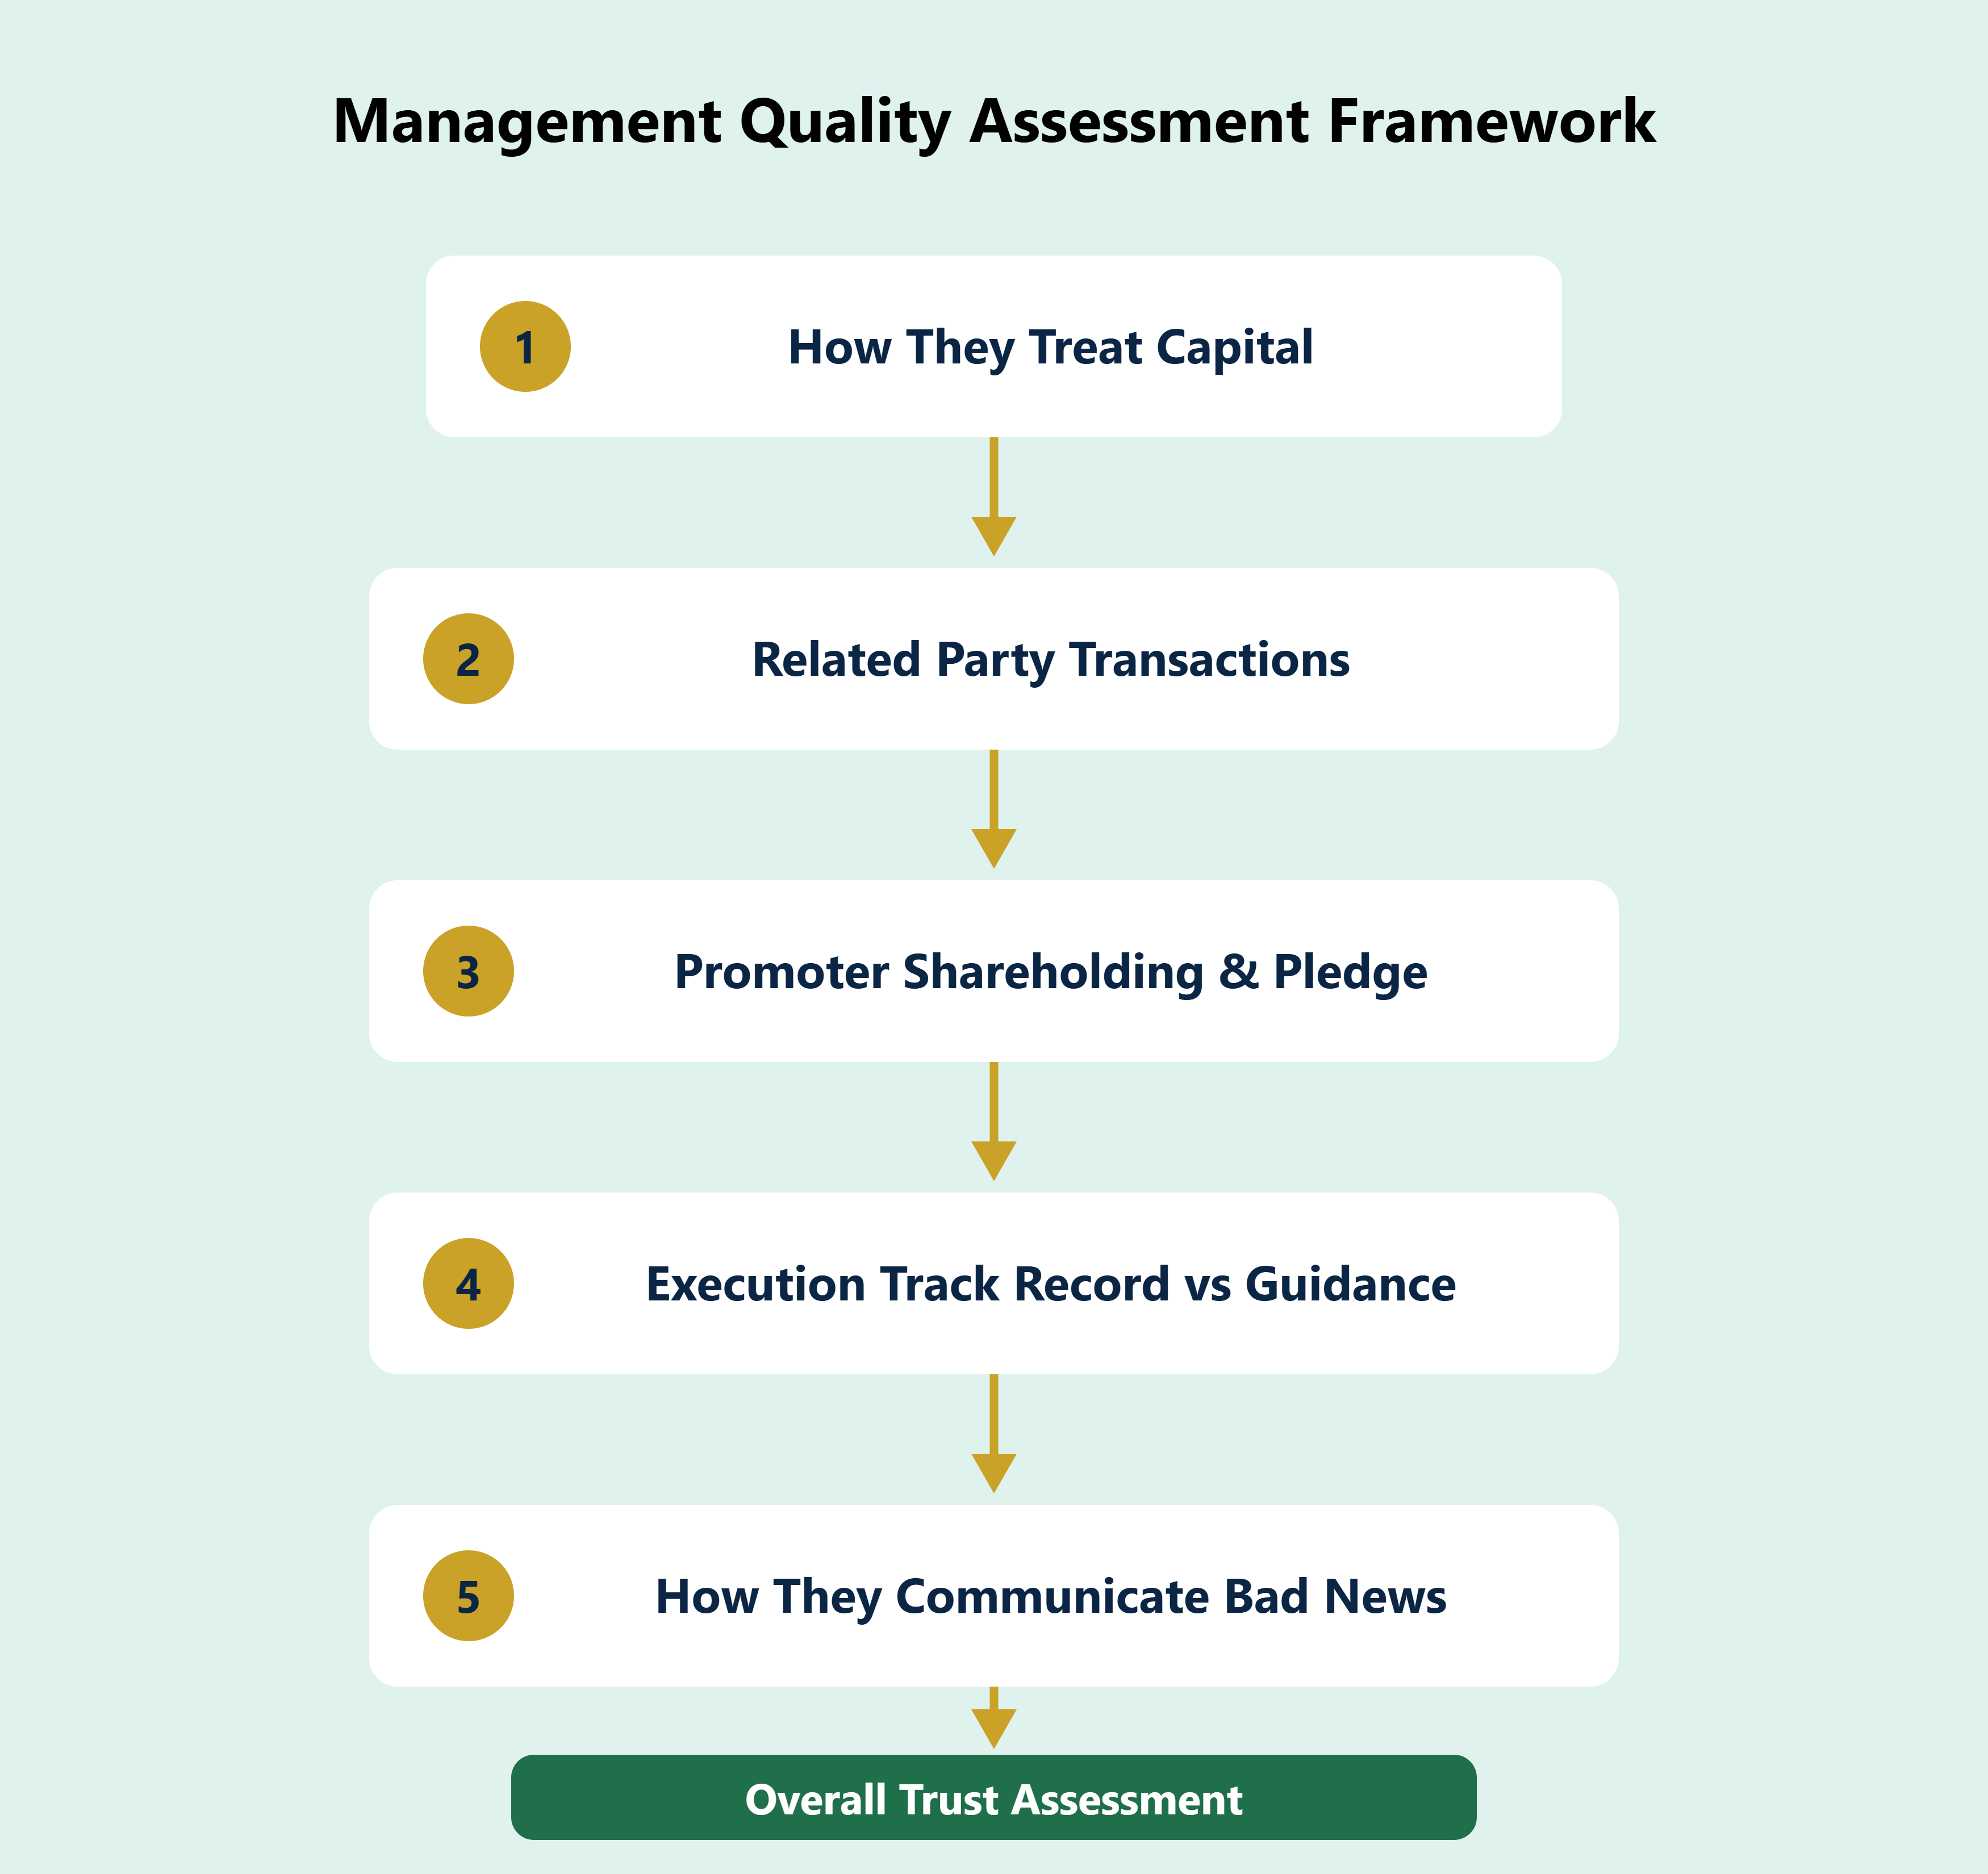
This is the single most revealing thing about any management team: what do they do with the cash the business generates?
Good capital allocators reinvest in the business only when the returns justify it, return money to shareholders when they cannot find better use for it, and are honest when an acquisition or expansion has not worked out.
Poor capital allocators tend to do the opposite. They chase acquisitions in unrelated businesses to “diversify.” They raise fresh capital from shareholders even when the balance sheet does not need it. They rarely admit that a past expansion failed — instead, the story quietly changes, and a new initiative takes its place.
Look at how a company has spent its cash over the last five to seven years, not just the last one. One bad capital decision can be an error in judgement. A pattern of them is a management style.
This is one of the most under-read sections in any annual report, and one of the most important.
A related party transaction is simply a deal between the listed company and an entity connected to its promoters or directors — a private family business, for instance. These are not automatically wrong. Many are entirely routine and fairly priced.
What deserves attention is the direction of value. Is the listed company selling to the related entity at prices lower than the market rate?
Is it buying from the related entity at prices higher than the market rate? Either pattern quietly moves value out of the listed company — the one you own shares in — and into a private entity that shareholders have no stake in.
This section is usually a small note deep in the annual report. It is worth reading every year, even when nothing changes, because the year it does change is the year that matters most.
Promoters are the founding or controlling shareholders of a company. What they do with their own shares tells you something numbers cannot.
A rising promoter shareholding, especially through open market purchases rather than preferential allotments, usually signals confidence. A steadily falling promoter shareholding, especially when it is not clearly explained, deserves attention.
Pledging is when promoters use their own shares as collateral to borrow money, often for reasons unrelated to the listed company itself. A high or rising pledge percentage means promoter shares could be forcibly sold if that personal loan runs into trouble — which can hurt the stock price of a company that otherwise did nothing wrong. This information is disclosed by exchanges and is worth checking independently of the annual report itself.
Every management team makes forward statements — about revenue targets, margin expansion, new capacity, or expansion plans. What matters is not the guidance itself, but how often it turns out to be accurate.
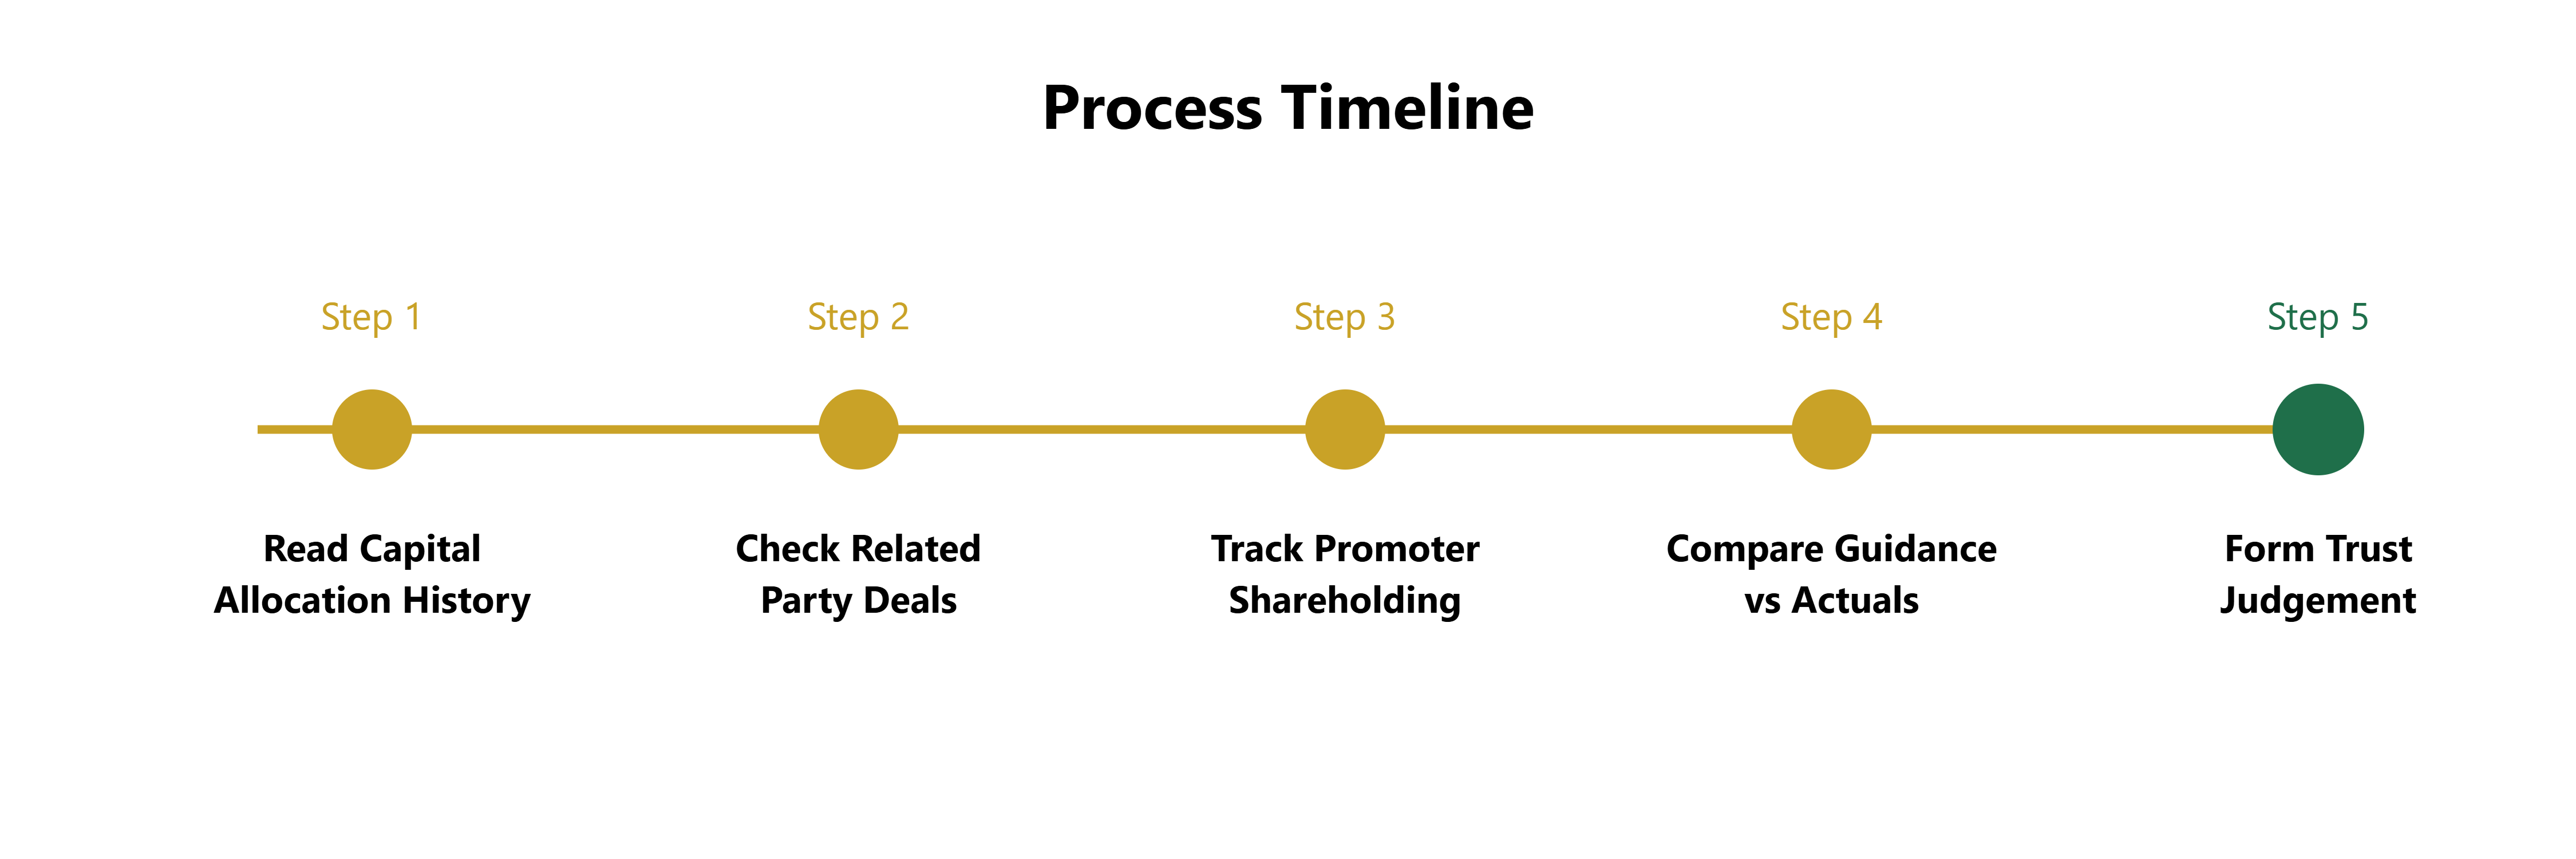
Keep a simple private record, if you follow a company over multiple years: what did management say they would do, and what actually happened? A management team that consistently delivers close to what it promises, even if the promises are modest, is more trustworthy than one that promises ambitious numbers and consistently falls short.
Consistent under-delivery is not a one-time excuse. It is a pattern of overpromising, and it tends to repeat.
This is perhaps the simplest test, and one of the most reliable.
Every business has a bad quarter or a bad year eventually. What separates management teams is how they talk about it when it happens.
Some managements explain the problem clearly, take responsibility for what was within their control, and describe specific steps being taken. Others blame external factors exclusively, use vague language, or simply avoid addressing the issue directly on earnings calls and in the MD&A section.
The willingness to be specific and honest during a bad quarter is one of the clearest signs of a management team you can trust during the good quarters too.
Frequent changes in auditors, especially without a clear, disclosed reason. Auditors are not supposed to be replaced casually.
Frequent changes in CFOs, particularly if the departures are not spaced normally and are not accompanied by a clear explanation.
Unusual related party transactions that appear suddenly, especially involving the sale of assets or businesses to promoter-linked entities at prices that are hard to independently verify.
A consistent gap between reported profit and operating cash flow. Profit is an accounting number. Cash flow is what actually enters the bank. When profit rises year after year but cash flow does not follow, it deserves a closer look — we will cover exactly how to read this next week.
Promoter shareholding pledged at a high percentage, particularly if it has been rising steadily over recent quarters.
None of these signs are proof of a problem on their own. But the same discipline applies here as with the annual report: one warning sign is worth noting. Two or three together, in the same company, are worth taking seriously.
Before trusting a management team with your capital, ask:
Has capital allocation over the last five years created value, or destroyed it?
Are related party transactions priced fairly, and disclosed clearly?
Is promoter shareholding rising or falling, and is the pledge percentage low and stable?
Does management’s guidance from previous years match what actually happened?
How does management talk about bad news — specifically, or vaguely?
Have auditors or CFOs changed recently, and if so, is the reason clearly explained?
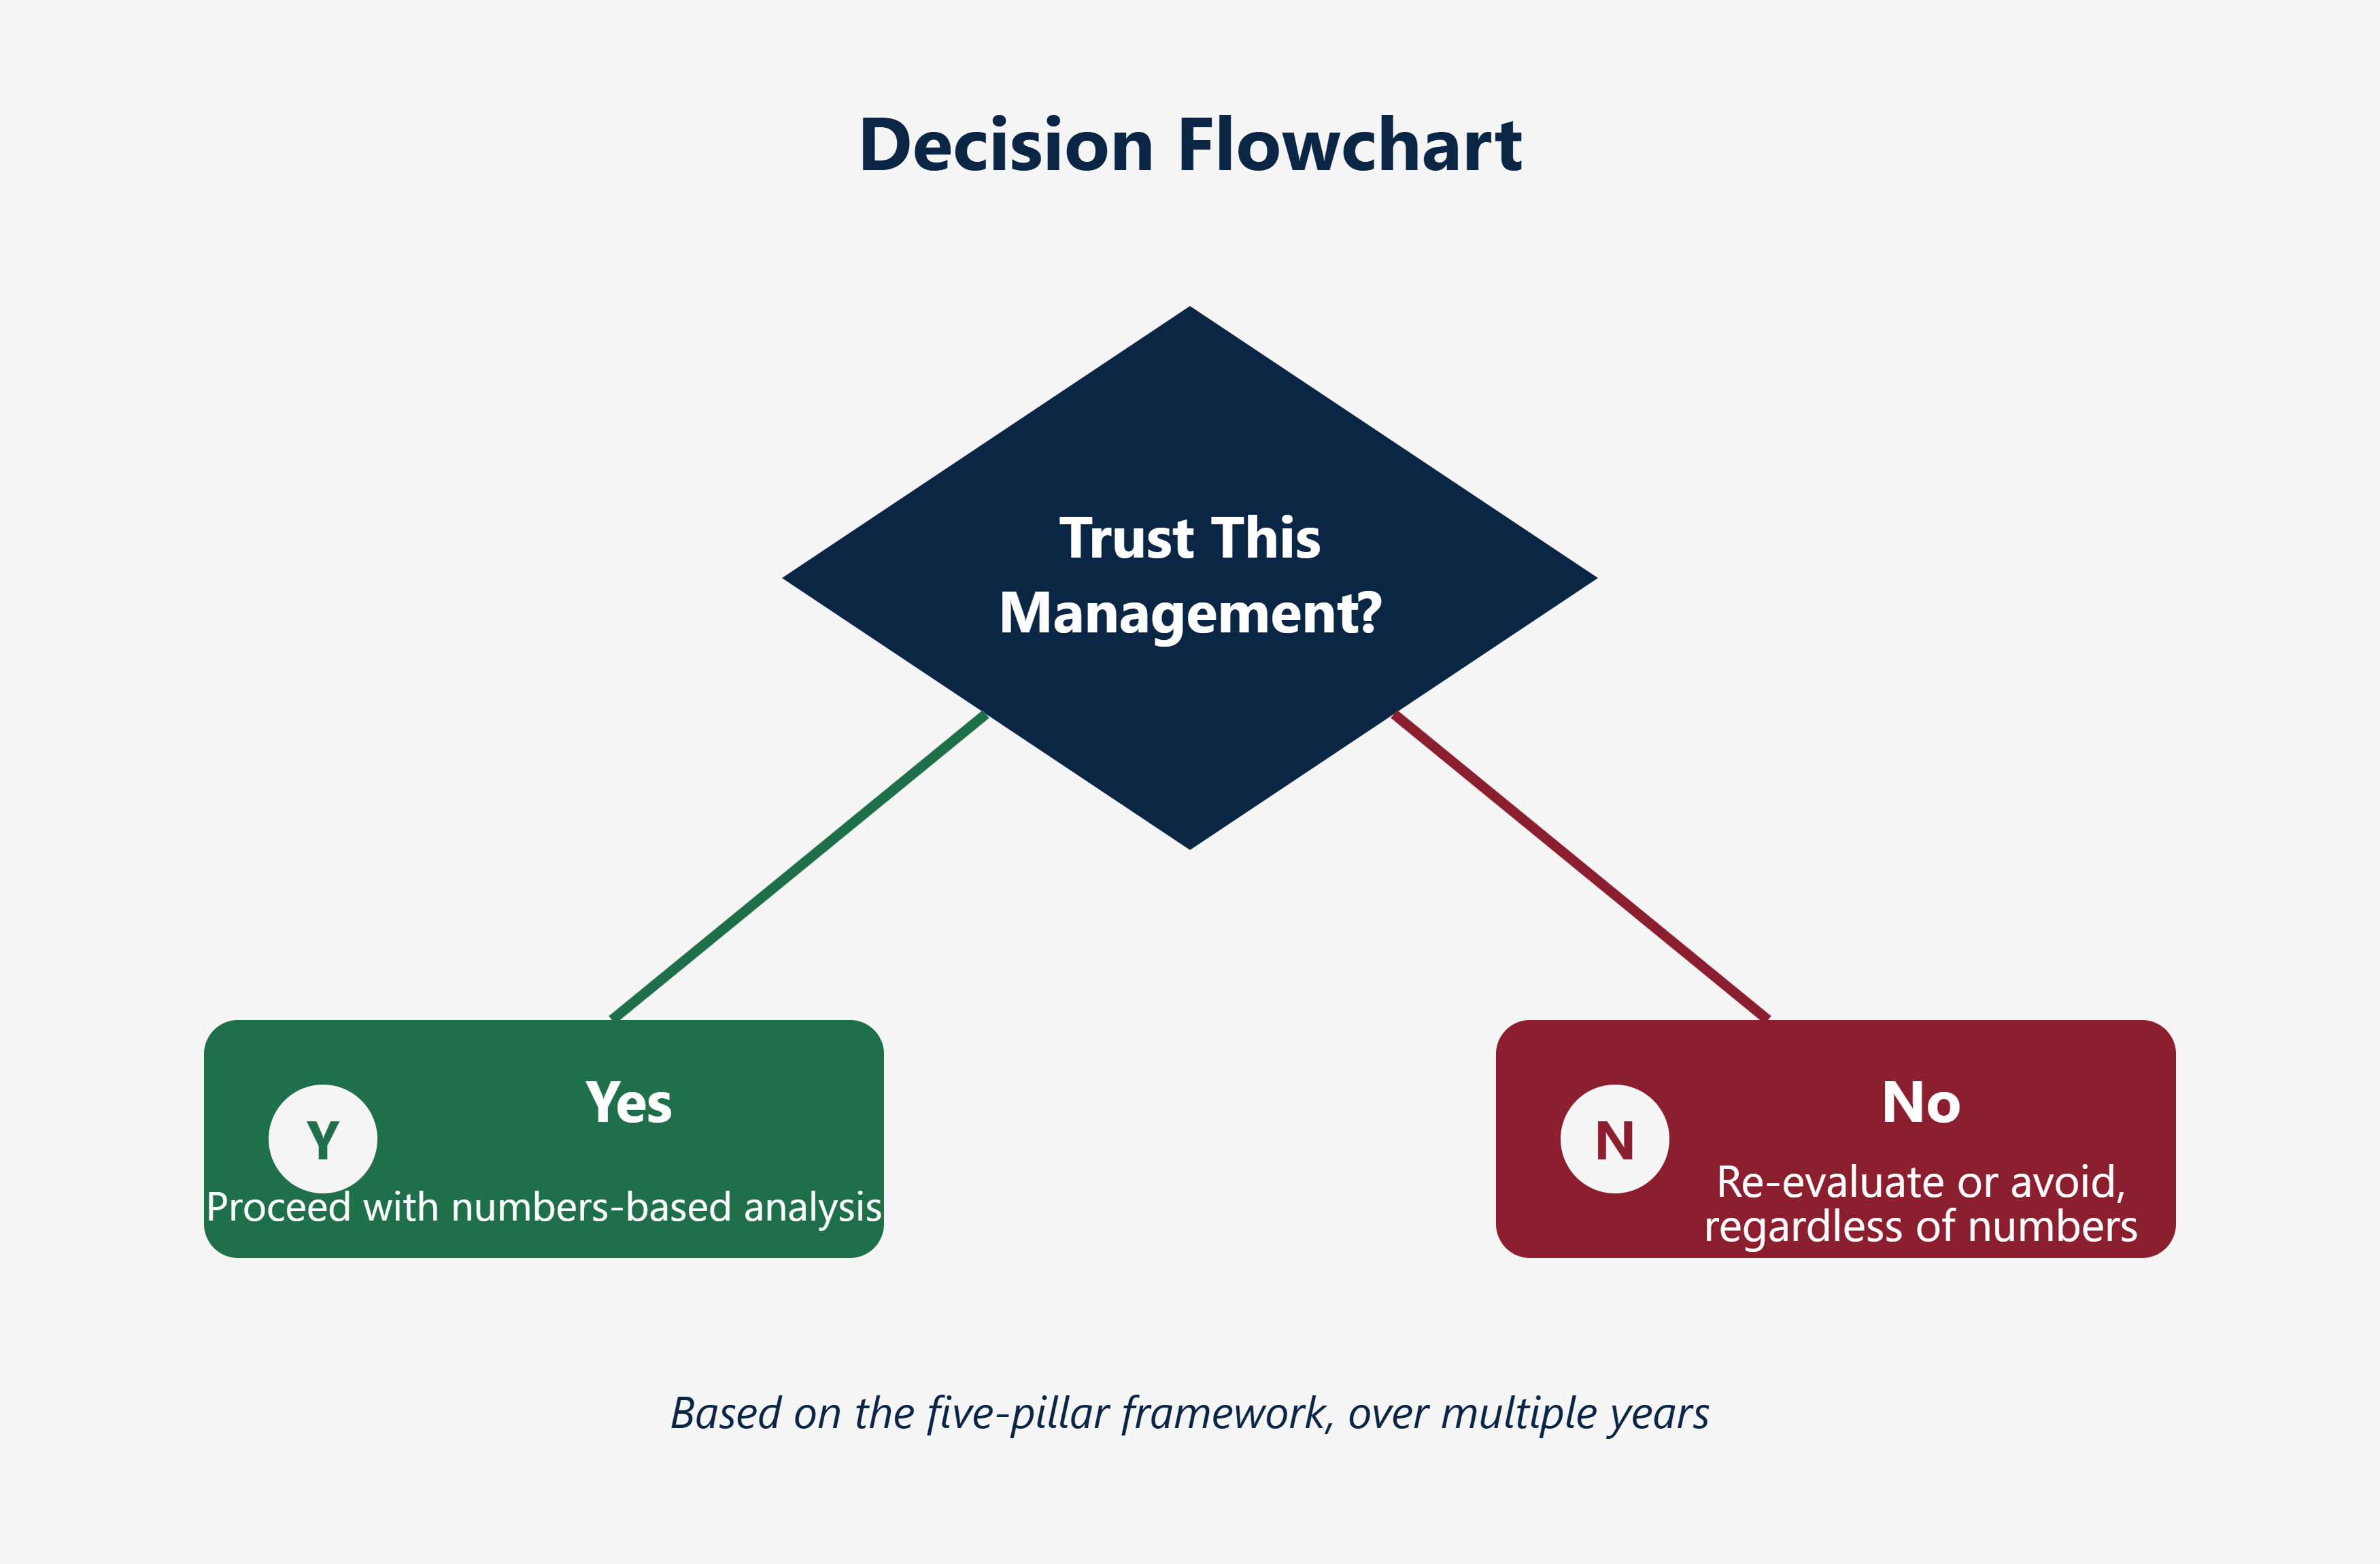
If most answers are comfortable, management quality is unlikely to be the reason to avoid a company. If several answers are uncomfortable, that discomfort deserves more weight than the numbers alone might suggest.
Numbers describe what a business did. Management quality describes whether you can trust it to keep doing it well, honestly, and in the interest of all shareholders — not just the promoters.
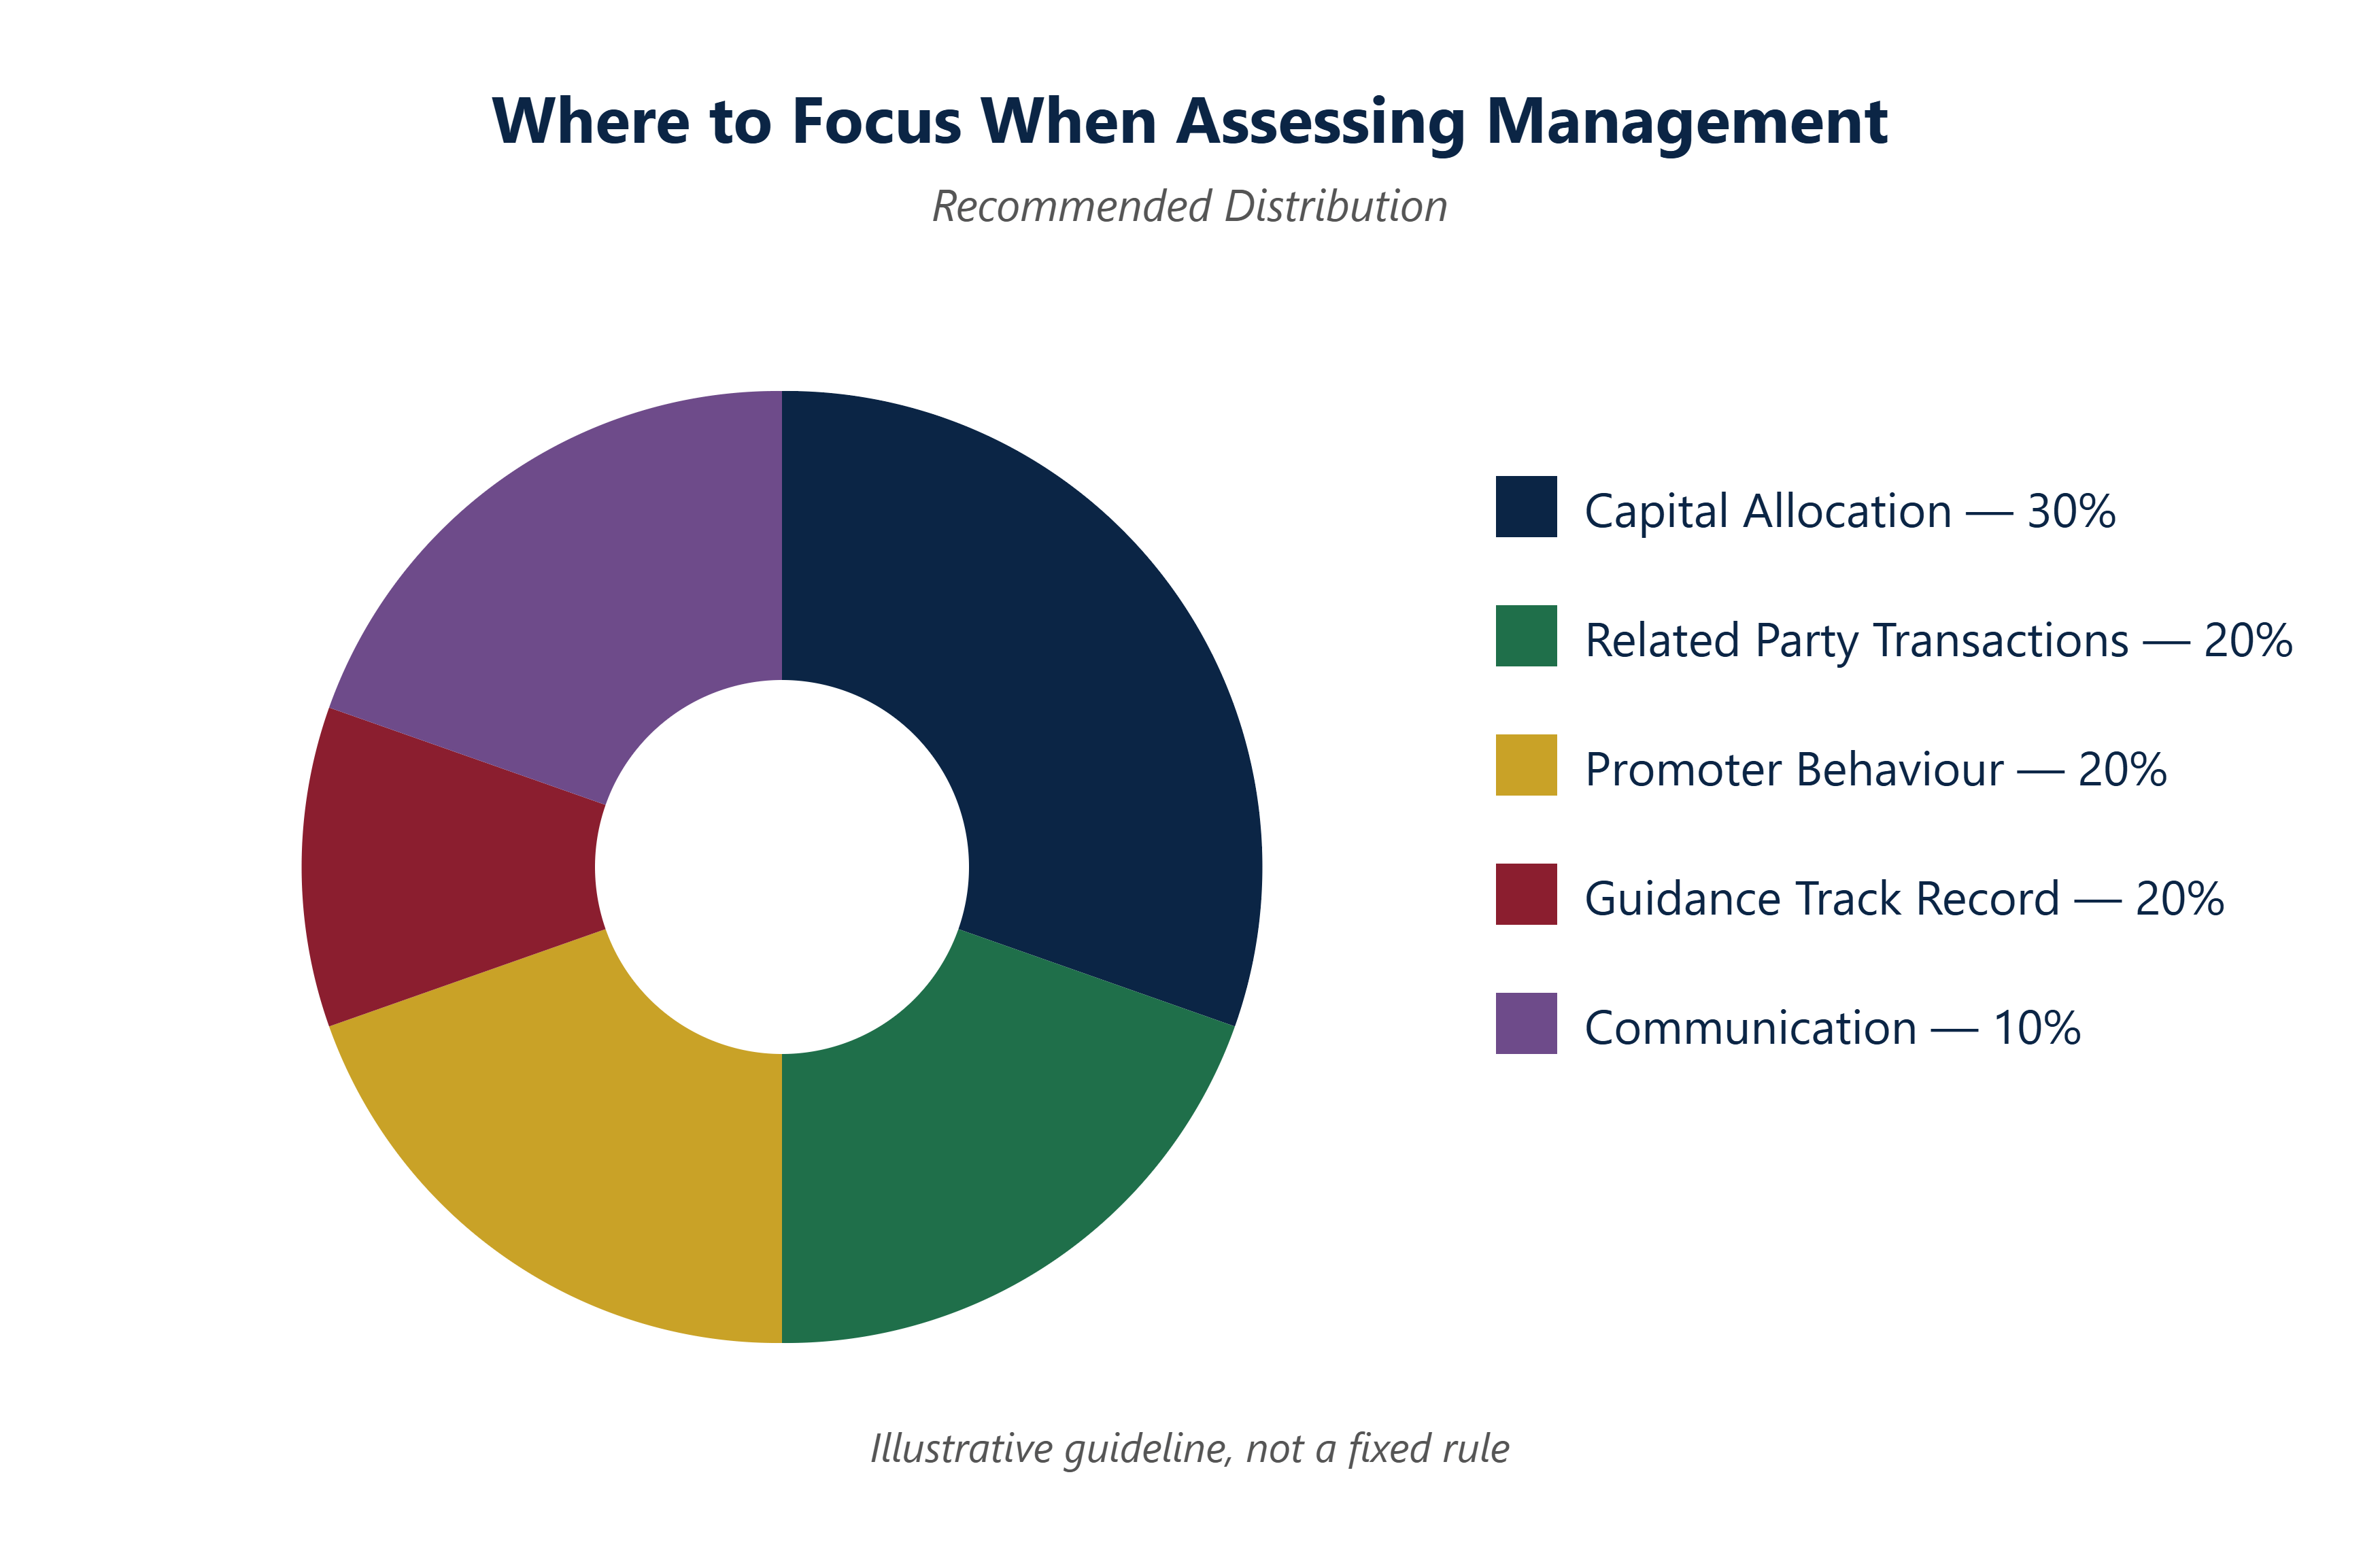
This cannot be reduced to a single ratio. It has to be observed — through capital allocation, related party dealings, promoter behaviour with their own shares, the accuracy of past guidance, and how bad news is communicated.
None of these signs are conclusive alone. Together, over multiple years, they build a picture that numbers cannot give you on their own.
There is one number that appears on every financial statement, that most investors think they understand, and that quietly misleads more people than almost any other figure in investing.
It can make a struggling company look profitable. It can make a genuinely strong company look weak. And the difference between the two readings often comes down to a handful of lines most people skip entirely.
Next Monday: Understanding Cash Flow: The Number Most Investors Misunderstand
No posts
Comments
Nothing yet. Say the first thing.
Sign in to join the conversation.