
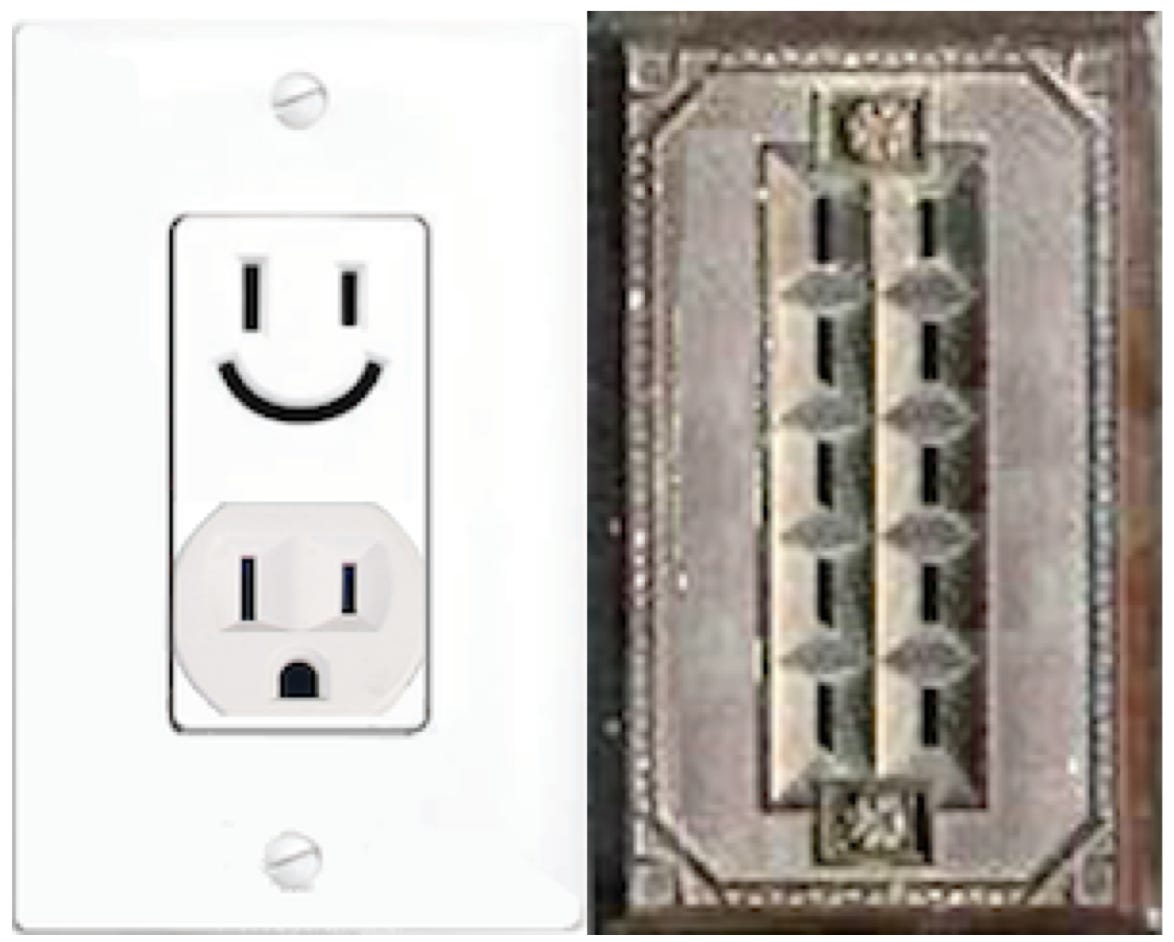
Whether the Happy & Grumpy one at left, or the old geezer at right from another era, time marches, and life goes on. But there lurk wonders and dangers both behind those facades.
Most users rarely think about, or consider, what may drive the energy behind those faces. A few feel it their duty to impose their focus on sources for sustainability, green-ness, renewable, etc., for what they think would be a better world. Be those as they may, power gets used, and predictably. So much so, in fact, that planners schedule fuel purchases (when using consumables) for capacity to exceed peak demand, to lock in the best price, whose benefit eventually trickles down to the consumer.
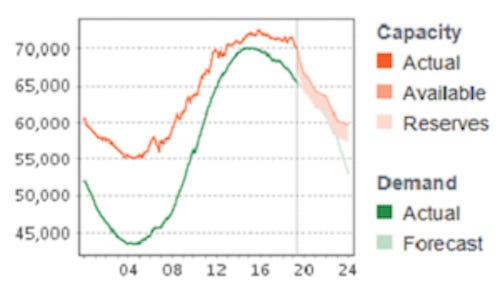
Peak demand? Well, power gets used 24/7. Shown below is the Texas power system Demand (that actually consumed) and Capacity (that available) curve for 24 hours, shortly after they had a major winter outage in 2021, when much damage ensued, and many questions were raised. Note the left vertical area depicting MW (MegaWatts), and that it never goes to zero, and almost doubles near its highest (Peak) demand, from the lowest nighttime value.
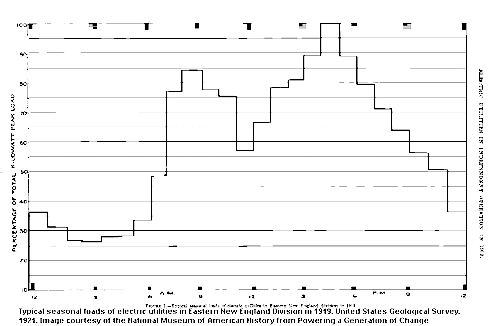
For contrast, below is a similar 24 hr usage curve for Eastern New England around 1920. Note the genteel crowd still took a lunch break. Well, no more.
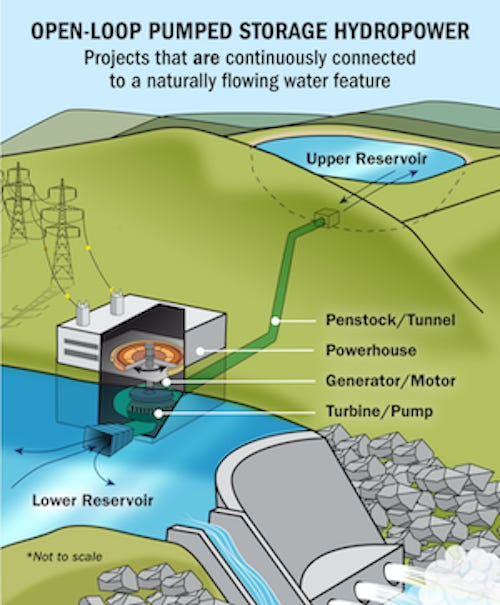
But this gives a very broad bird’s eye view of total usage. For those that may be environmentally conscious, consider Pumped Storage. Because daytime usage is much greater than nighttime, daytime usage is also more costly because more generators may have to be put online. Pumped Storage uses two reservoirs, an upper and a lower. When power is needed in daytime, or during emergencies, the water in the upper reservoir is allowed to go downhill through generator units. When the demand is lower, the generators are used as pumps to relocate the water back up to the top reservoir. Connection to a small stream conveniently supplies necessary liquid lost due to evaporation. No concern for fuel oil or radiation leakage, they are the epitome of clean energy.
But back to fundamentals, the energy coming out of your sockets, is Not 120. You may think it is, but that is only its equivalence to a DC value. When Energy sources first became available in the late 1800s / early 1900s, there were ongoing battles between Direct current (DC) and Alternating current (AC) providers, and in the latter there were ongoing battles between various Frequencies due market competition before standardization. The energy coming out of your sockets now varies between 170V positive and 170V negative relative to Earth Ground at 60 Hz (Hertz, or cycles per second), that in the aggregate is equivalent to that provided by 120V DC, a constant value.
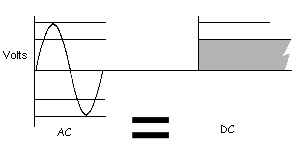
What is shown above left is one cycle of alternating voltage, which when connected to some load will provide alternating current. The alternation is absolutely smooth, its depiction of smoothness limited by my lack of artistic talent, and when a meter is used to measure either the left or the right, it will provide the same numerical value. Of course, the meter will also display AC or DC. Since alternating power changes continuously, it can be viewed as a Frequency on a Spectrum, 60 Hz being a single blip in a frequency desert. That is what the utilities bend over backwards to provide each user. Should some major user produce feedback into the power system, causing its Voltage to be distorted to other users, the utilities are quick to regulate their usage, imposing user-paid engineered corrective measures, that make their usage look smooth to the utility, and neighboring users.
Feedback? Really? Really.
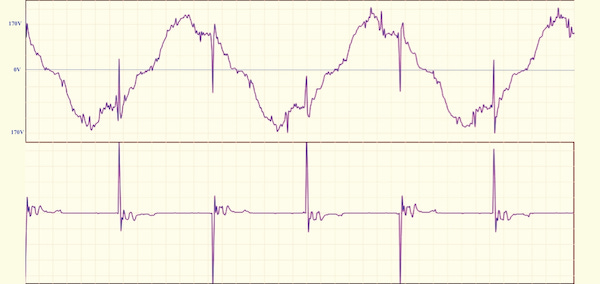
Shown above are two waveforms, or shapes, of the Voltage in the upper portion (recall from the previous sketch that it’s supposed to be Smooth), and the Current in the lower. This is typical of most residential users, and has been common since the early days of electricity and nonlinear lighting, read Fluorescent, Arc, etc.
By necessity the display is static, it pictures three cycles of 60 Hz, and being each cycle takes 1/60 second / 16.6 ms (milliseconds), what is shown is about 50 ms. Note that each time a burst of current is demanded, a change up or down, is also coupled to the supply voltage.
In contrast to a constant load, like an “old fashioned” incandescent lamp, or a heater, which both use current continuously, and the current waveform is identical to the voltage waveform, nonlinear loads, fluorescent lighting, or switching power supplies generally, do not use current until a certain voltage is reached, say about 80 volts for fluorescent. At that point the lamp fires / lights, and remains on until the voltage crosses the zero threshold (the horizontal line in the middle of the waveform), and turns off. On the other side of the zero threshold, when the voltage reaches 80, it fires again, and so on. Since human eye persistence is centered around 1/30 second (or 30 Hz), anything faster (such as the fluorescent firing 120 times per second, or twice per cycle of 60 Hz) looks like a steady-on lamp. All your digital devices (and variable frequency devices as well; yes, that treadmill you’re using) function similarly, each having a differing voltage threshold, and thus appearing at different points in time on the voltage waveform. So depending on how many of these doodads you have plugged in, and how much current they use, your voltage could look pretty trashy.
Therein we now have a marketing scheme, or rather scam, from my perspective.
The voltage no longer being a smooth 60 Hz, it is “dirty.” Thereby “Dirty Electricity.” And, oh boy, have I got a filter for you to buy. And if you don’t have many outlets, buy power strips, and gang these filter together for better effect. Or even more better, have a whole-house unit installed, to clean up “everything.”
Problem is, that even if everyone in my neighborhood cleaned up their act, my power usage, would most likely still reflect that shown above. So Isolations-Transformers are Not The Answer. Who’s to gain? “Dirty Electricity” filter vendors, of which there are many.
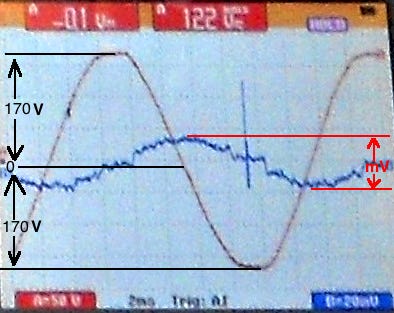
The slickness of the scheme even enlists a few “engineers” to give it credibility, using a novel measurement scheme. In this scheme an oscilloscope is used to display two waveforms. One is the unaltered “120V,” (shown in Brown below) the other is Voltage fed through a Series filter that eliminates most frequencies slower than about 4 kHz (kiloHertz, or thousands of Hertz). This latter signal is supposed to signify the electrical “dirt” (as shown below in Blue). For what it’s worth, I rarely see such a smooth 60 Hz as shown here, so this was “good orchestration.” For true geeks, note there is a phase difference between the “dirt” and the 120V, that is Not supposed to be there. This is an artifact from their filtering method. Bring on artifacts, and we have smoke and mirrors!
Shown below is the voltage acquired by a person being near any energized wire in a home (or possibly workplace), on the upper half. Consider that all wiring is energized, waiting for you to plug something in, or flick a switch to turn something on. All such wiring produces an Alternating Electric Field right through wall, floor, and ceiling structures (peculiarly, even through Glass, which is an Insulator - although glass blocks DC electric fields, when the source is Alternating, the field is replicated from one side to the other), because the average between the “hot” wire at 120V, and the return neutral/ground at zero, is 60V, making for a very effective source of emissions. The very sharp spikes are contributed by nonlinear loads, in this case fluorescent lighting. The smaller “chaff” riding the wave, so to speak, are nonlinearities by various devices scattered about the home. Talk about living near a power line . . .
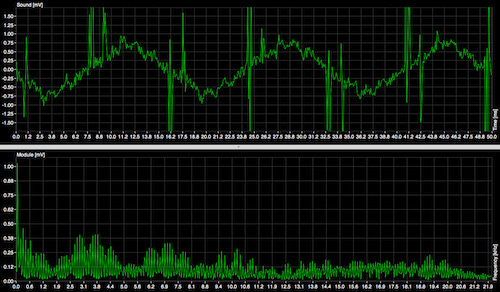
The lower half is the Frequency Spectrum across the audio spectrum of the voltage waveform. It consists of Harmonics, or “echoes” of 60 Hz, and all those shown, as is typical, are Odd multiples of 60. Thus 180, 300, 420, 540 Hz, etc. Note that the most intense activity is on the lower end at left, which “dirty electricity” measurements conveniently block out. The “convenience” comes in because the “dirty electricity” filters themselves produce Harmonics, that are most intense below 4 kHz.
Long ago I visited a client who claimed to be sensitive to electricity. On arrival most breakers had their wiring previously removed, to kill the structural cavity wiring. Yet he claimed he still felt electrical irritation. His home was in a gully, the electric supply wiring was underground, the neighborhood high voltage wiring was underground, and there were many trees. Obviously, I thought, it Must Not Be electric. But it was.
I hooked myself up to an oscilloscope & spectrum analyzer and acquired something like the following. The first portion is the Voltage waveform, the second is the Frequency Spectrum of the voltage waveform, the third is an enlargement of the slower end of the frequency spectrum to shown the discrete harmonics, being odd multiples of 60 Hz. Note the major components being shown at 0.06 (the Fundamental), 0.18, 0.30, 0.42, 0.54, those values being expressed in kHz, or 60, 180, 300, 420, 540 Hz, etc.
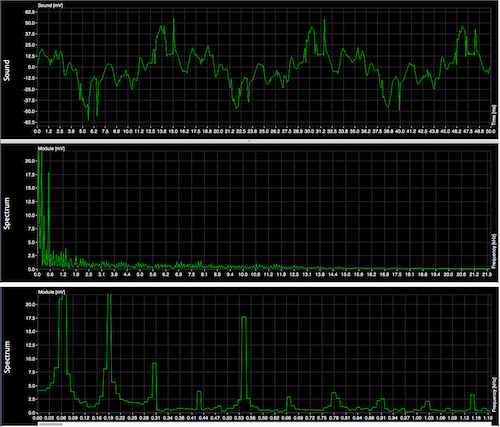
What the gentleman must have been reacting to, was the minuscule Alternating Electric Field emission from the Electrical System Ground (ESG) which was still connected everywhere, since when I acquired the above waveforms I used an Isolated Earth Ground (IEG) as a reference. To verify this, I connected the instrument to the ESG, still using the IEG as a reference, and acquired the same waveform, except stronger because I was now directly connected with it. As I recall it was not more than a few hundred mV (milliVolts), a typical value.
He additionally remarked that he felt similar irritation when his landline phone was in use. Well, installed landline wiring, similar to electric power wiring, is covered in plastic which (although an Insulator) is transparent to Alternating Electric Fields. And while telephone wiring in use has only about seven volts DC, the voice frequencies superimposed on that DC are also located exclusively below / slower than about 4 kHz, the same as the strongest Harmonic activity on any power system.
While this exposure may have been minuscule, and a healthy person wouldn’t blink an eye because of it, or even the emissions from energized wiring which are more than 100 times greater, bring on immune system injury and all bets are off. While a “ground” is generally considered to be at zero volts, the moment current flow comes into the picture the minuscule electrical resistance of typical wiring causes voltage to build up at a point-of-use ground relative to a supply-point ground. So although both points are in fact “grounded” the flow through the wire causes a measurable voltage difference at each point relative to an IEG. If, in turn, that “ground” is also interconnected with a neighborhood metallic infrastructure, such as water piping, coax cable, or telephone ground, then substantial (and possibly lethal, should you break the path) currents can/Will flow between different users, because of the relative difference of voltages on the different “grounded” points! A ground is a ground, is a ground, is Not a ground, when there is more than a few milliAmps of current flow between users. If you know how to measure current, and find it in your case, ask an electrician about it, and expect profound ignorance (despite their maybe 30-odd years in the business)!
From a “dirty electricity” perspective, the gentleman was imagining things, because the “slow” end of the spectrum is “irrelevant.” Further, no filter could be sold to him, because these require 120V to perform their “magic.” Nor could the “dirty electricity” measurement scheme acquire this valuable data, because it similarly requires 120V. Maybe I imagined it as well . . .
The client was originally healthy and the wiring was not an issue. Having become sensitized by injury, a Pandora’s Box was opened to him, which was not pleasant.
So if you are told you have “dirty electricity,” and a filter / filters they can sell you will eliminate them, please ask them if they will also eliminate the drone that keeps flying about in the kitchen . . .
Yours truly,
Sal
PS. Several subscribers to this blog are “techies,” and much of my rambling is obvious to them, or should be. Should something not be obvious to you, please advise, and I will do what I can to correct the failing.
PS addendum. I recently was curious about a “B” size Acetylene tank, and its empty and full weights. An internet search, yielded several sources claiming from 23 to 36 lbs, and full from 27 to 72 lbs, accentuated by the page-top AI assisted winnowed data. I then looked at the mechanical stamp on the tank which was TW 23, being tare weight 23 lbs. I then looked up the specific gravity of Acetylene and found it to be 0.07273 lb/cu/ft. Since this tank can hold 40 cubic feet, that translates to about 2.9 additional pounds when full. So 23 and 26. So if you’re not alert with your wits, or have a sound frame of reference, you’ll be overwhelmed with BS. So much for the IoT. Cheers!
No posts
Comments
Nothing yet. Say the first thing.
Sign in to join the conversation.