
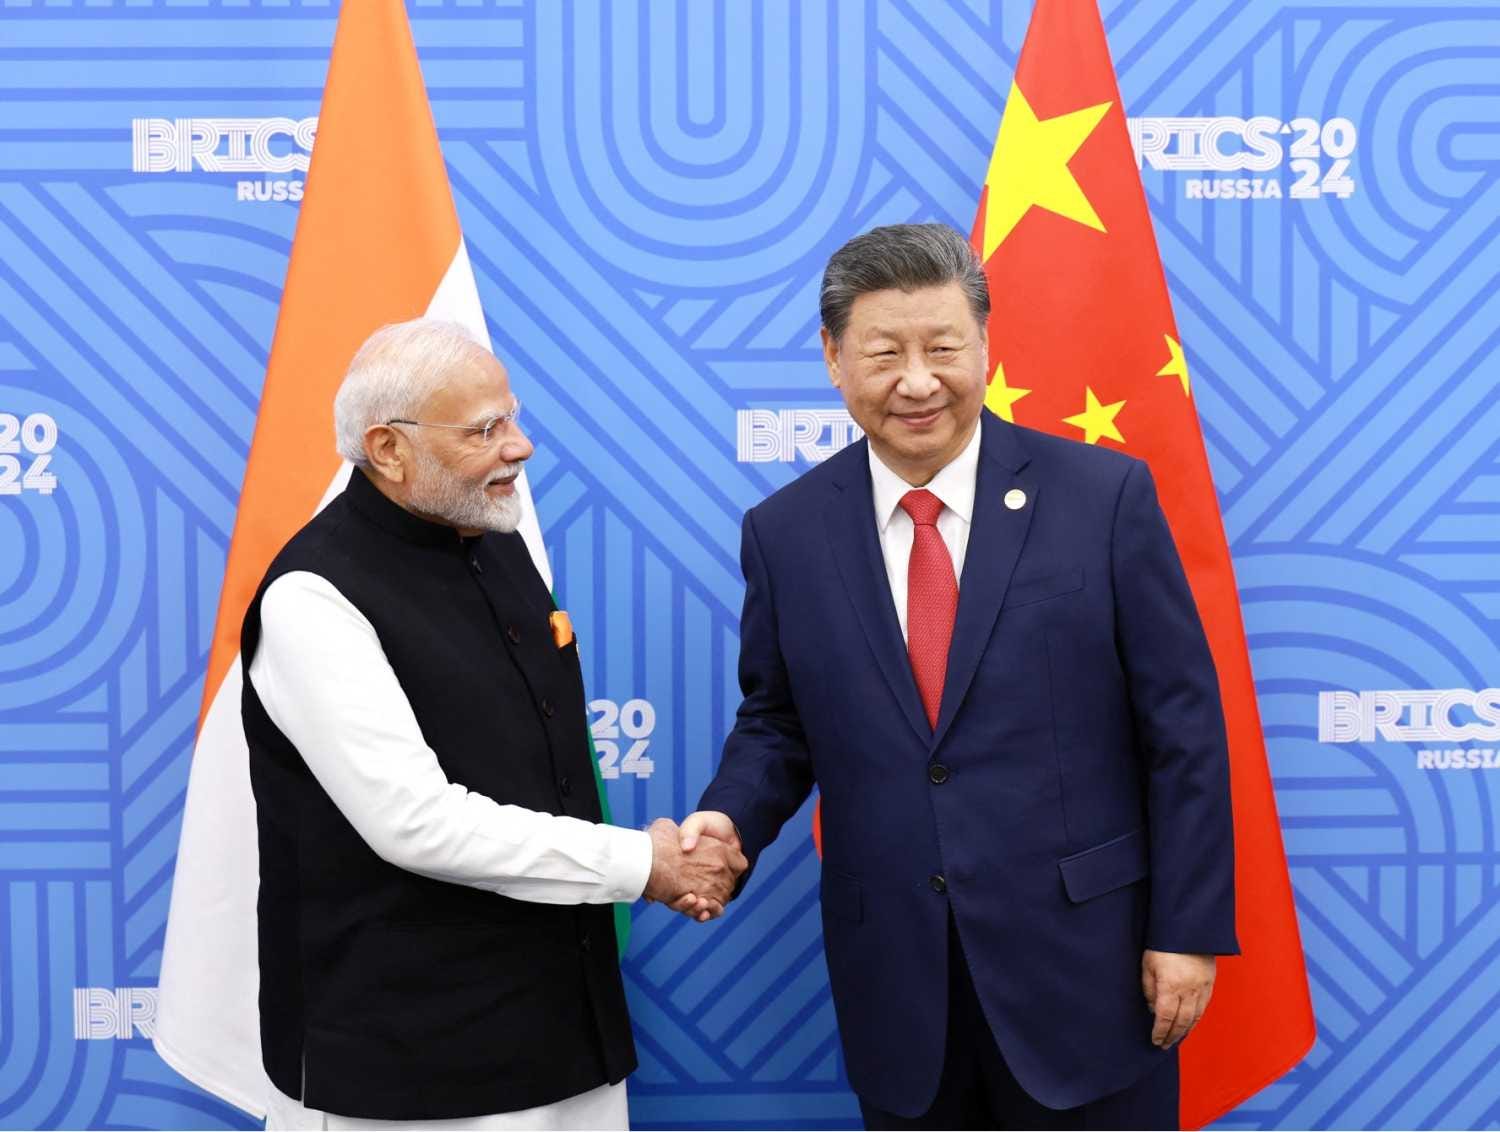
The only correct comparison for India is China. China is already a regional superpower. While India dwarfs Pakistan militarily, China’s help evens out the battle. Operation Sindoor was a good illustration. It has launched an aggressive plan for inventing new technologies. It is on the verge of being classified as a developed nation.
And this is just stuff that we can measure. Qualititatively, many people are impressed when they visit Shanghai and Beijing. Cities are big, there are endless towers and apartment complexes and airports are humongous.
As long time readers know, one metric I am pretty fond of is GDP per capita. Any single metric will have drawbacks, but if there’s one that shows how far a country has come, it is GDP per capita. GDP per capita is strongly correlated with a bunch of positive outcomes that you would want anyway. So instead of targeting, let’s say, reduction in infant mortality, you would be better of increasing GDP and you would get your target as a side-effect1.
China’s GDP per capita is $13,400. But China is a huge country and that masks the wide spatial disparity in development. Its top cities are much richer. Two examples suffice. Beijing and Shanghai have a GDP per capita of $32,000 and $30,500 respectively. That makes them as wealthy as European countries like Estonia, Lithuania and Spain. They’re much wealthier than countries like Greece and Hungary. Combining Shanghai and Beijing, they hold about 3% of the population. That’s about 50 million people. And much more than the population of many European states.
Paeans to China aside, it is interesting to ponder when India would catch up to China. How many years behind is it?
One metric is of course GDP per capita. But other human development metrics aren’t a good comparison since all of them are downstream of income. As GDP per capita increases, life expectancy will increase.
But maybe the right perspective isn’t to look at it in number of years. It matters more whether India is diverging or converging with China. If it is converging, then it is only a matter of years before it catches up. If it is diverging, then the gaps are widening and the fundamentals must be looked at.
The rest of this piece will mostly be graphs interspersed with commentary.
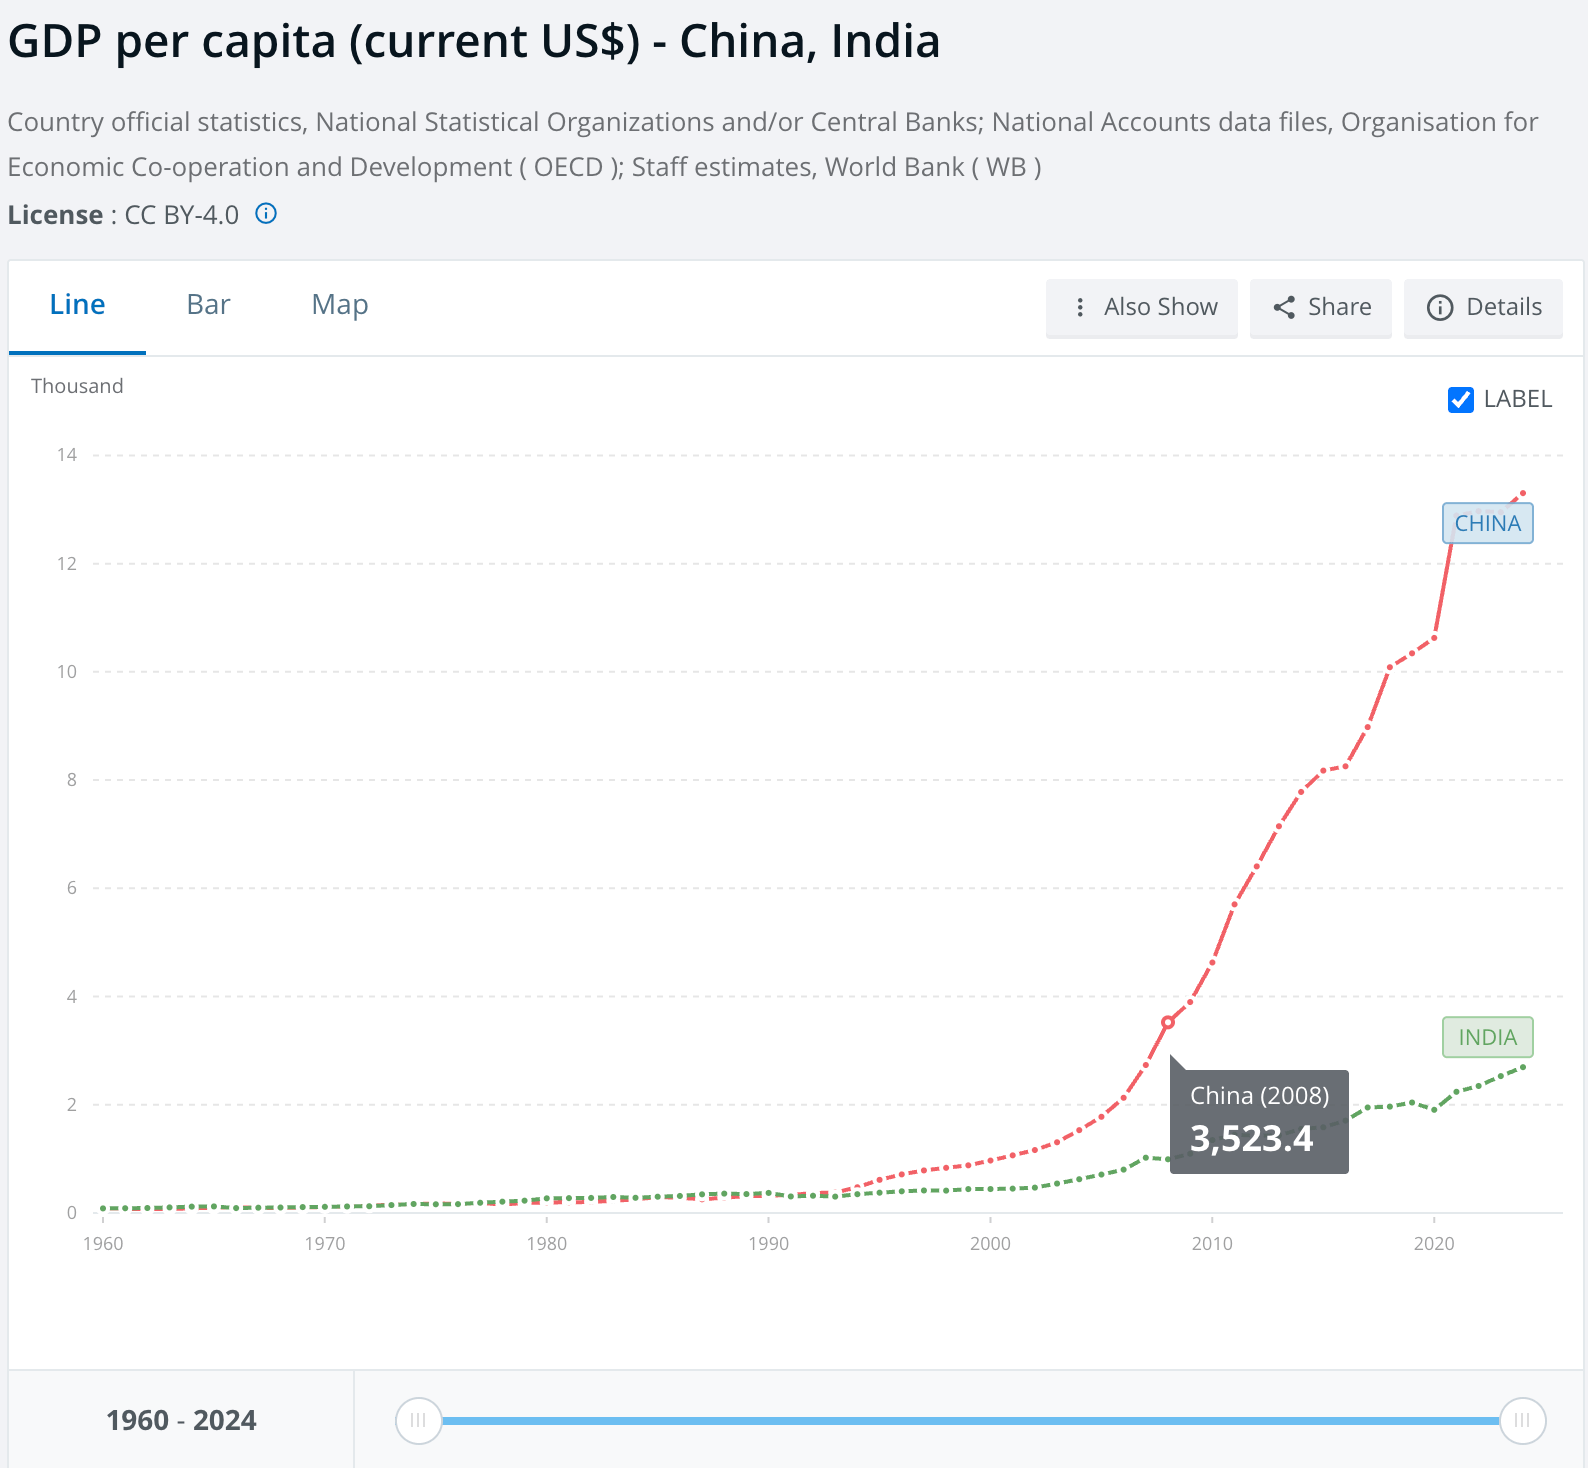
India’s nominal current GDP per capita is around $2,900. China was at that level approximately between 2007-08. In plain nominal terms, India is about 18 years behind. The Beijing Olympics were held in 2008 heralding China’s arrival on the global stage. That’s not too bad, considering various global headwinds that this decade has thrown almost every year.
This is a comparison in nominal dollars though. Purchasing Power Parity (PPP) measures the level of basket of goods citizens can buy locally. That comparison is much more appropriate in some senses.
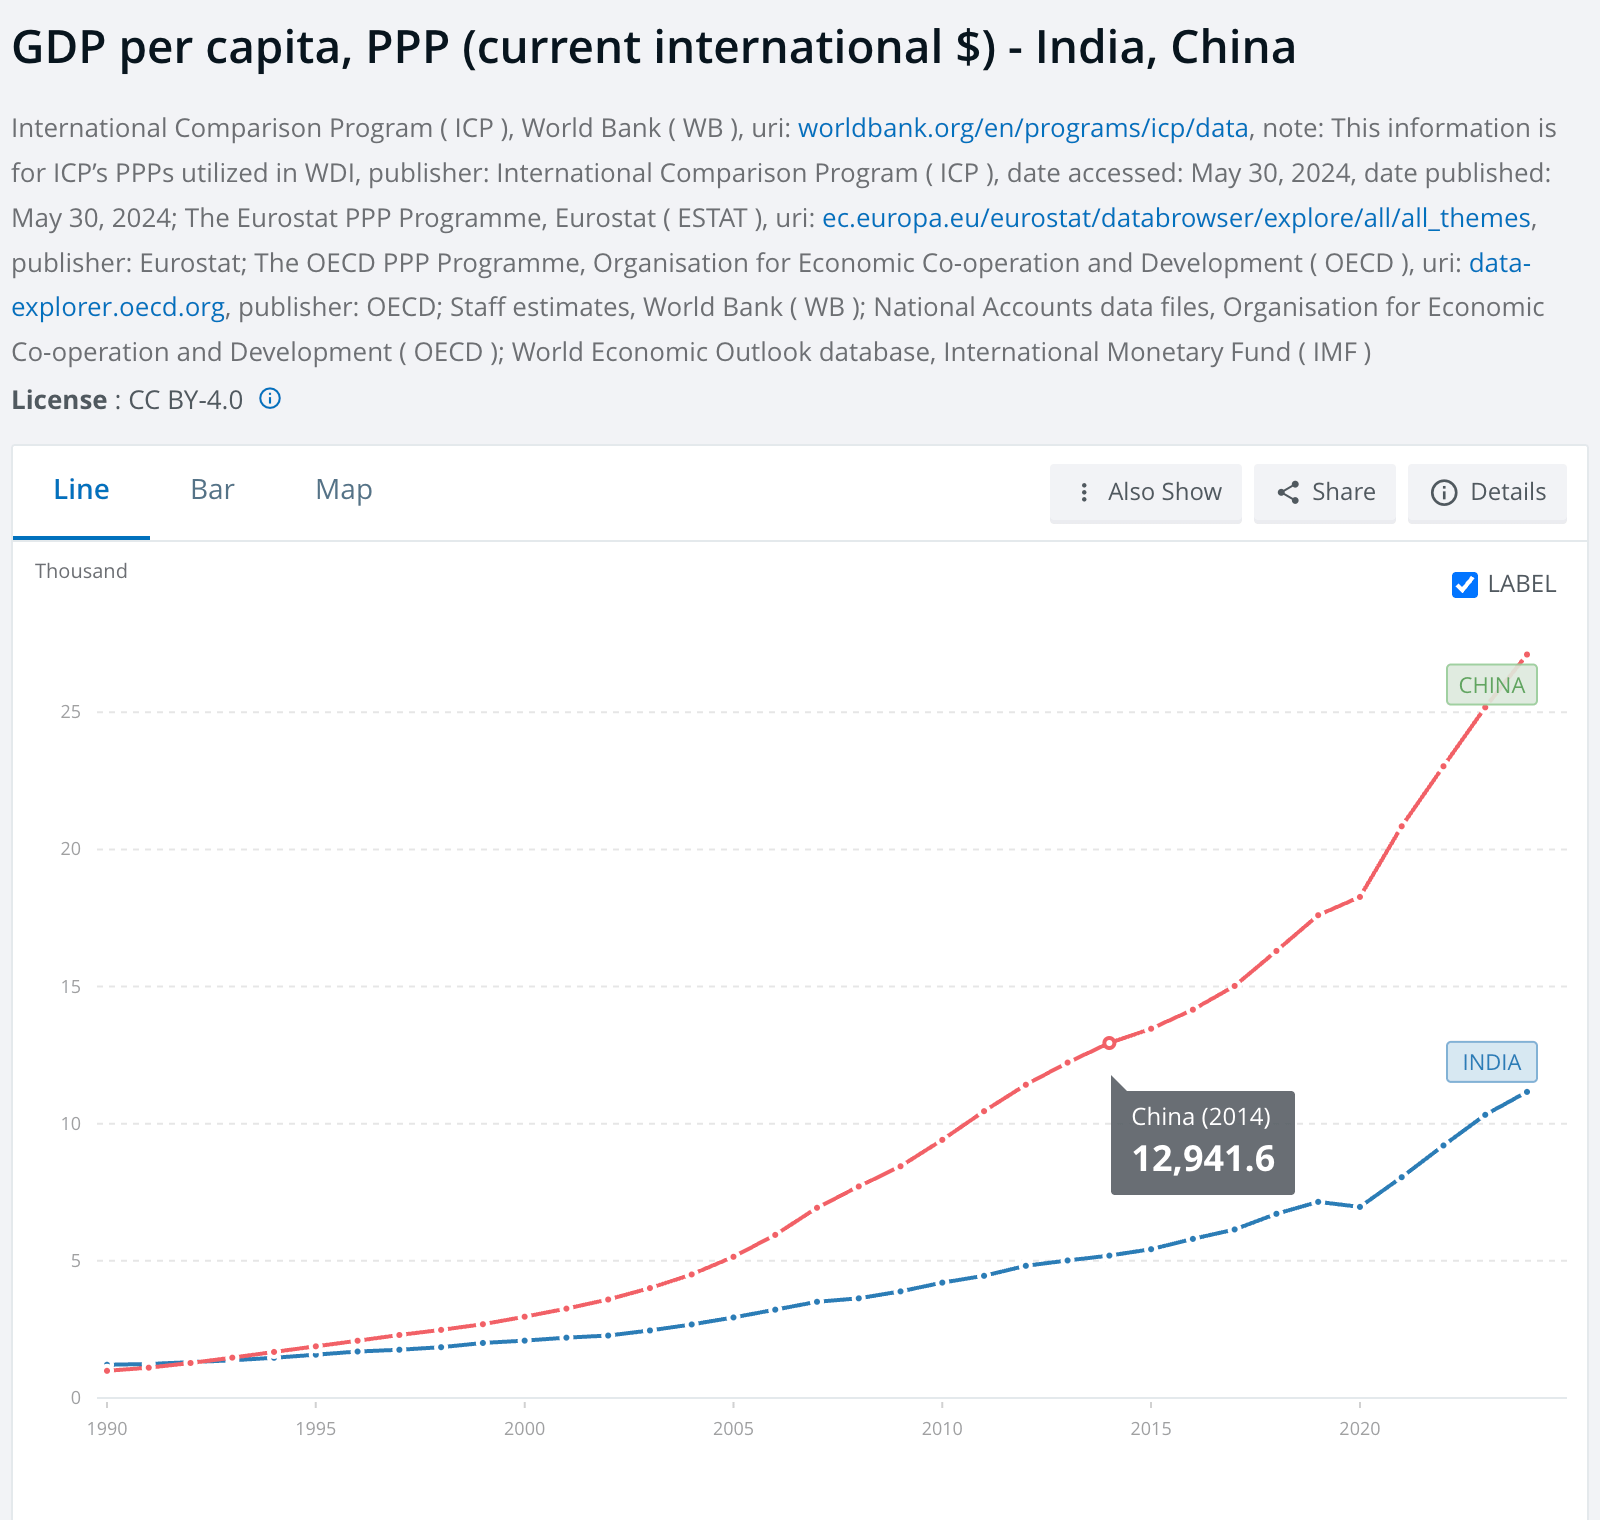
Here China is about 12 years ahead of India. PPP has its faults. When you buy an iPhone, you have to buy it internationally and PPP is useless. But when buying local services like haircuts, food and houses, the comparison is apt.
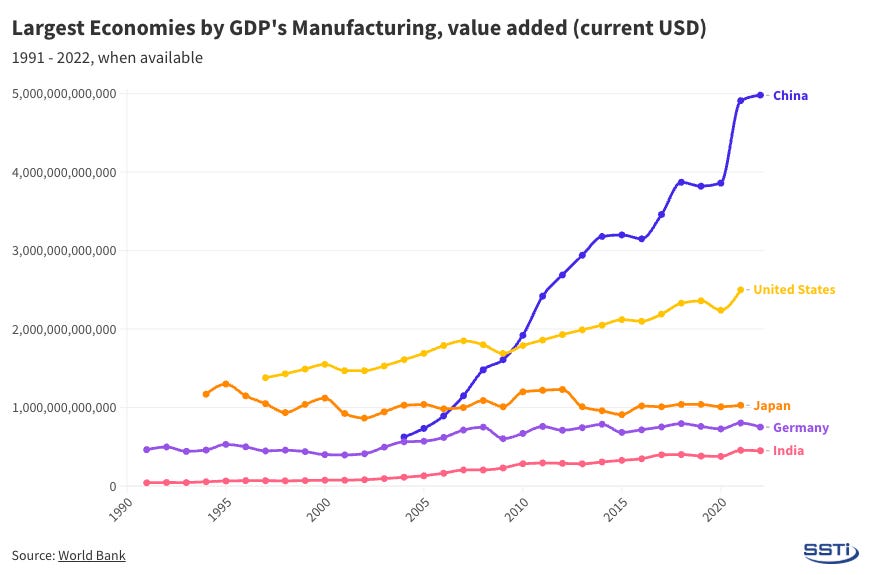
Manufacturing is where India is dwarfed by China. In 2022, India added about $451 billion of value in manufacturing. 2004 is the first year for which we have data from China. And China added $625 billion of value that year. Not only is India is decades behind China, the gap is only increasing and the outcomes are diverging. I find this concerning.
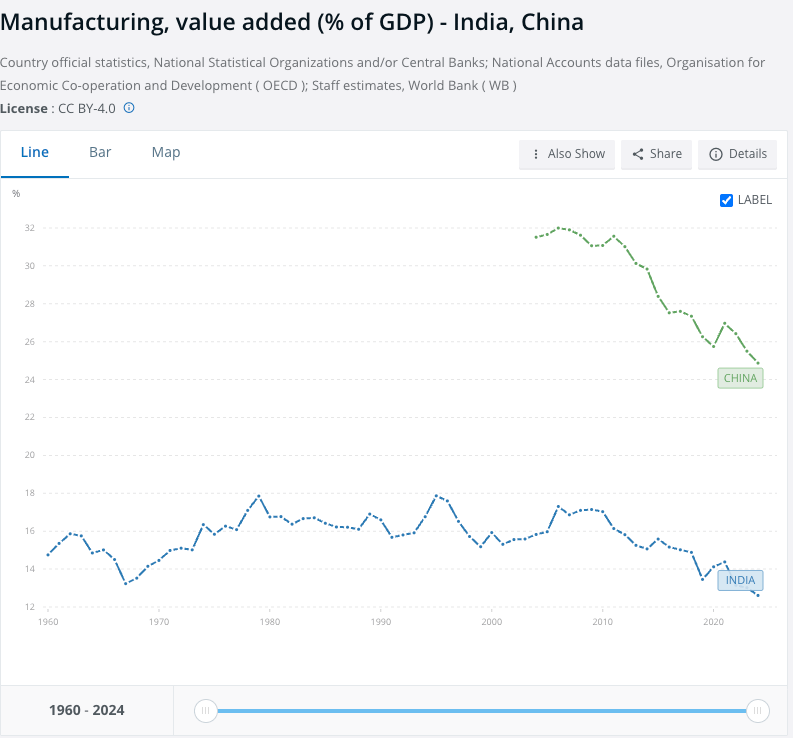
Even as share of GDP, India is far below China and the trend line doesn’t suggest that India will ever catch up to China. China simply does manufacturing better. Why so? Plenty of reasons, but two will suffice: more industrial policy and fewer labor-friendly laws.
One caveat here: Many people are concerned about manufacturing value add. But India needn’t aim to be dominant in goods trade. As long as its manufacturing sector can support defence and space industries, growth can come from elsewhere. And even services could be a viable source for mass employment.
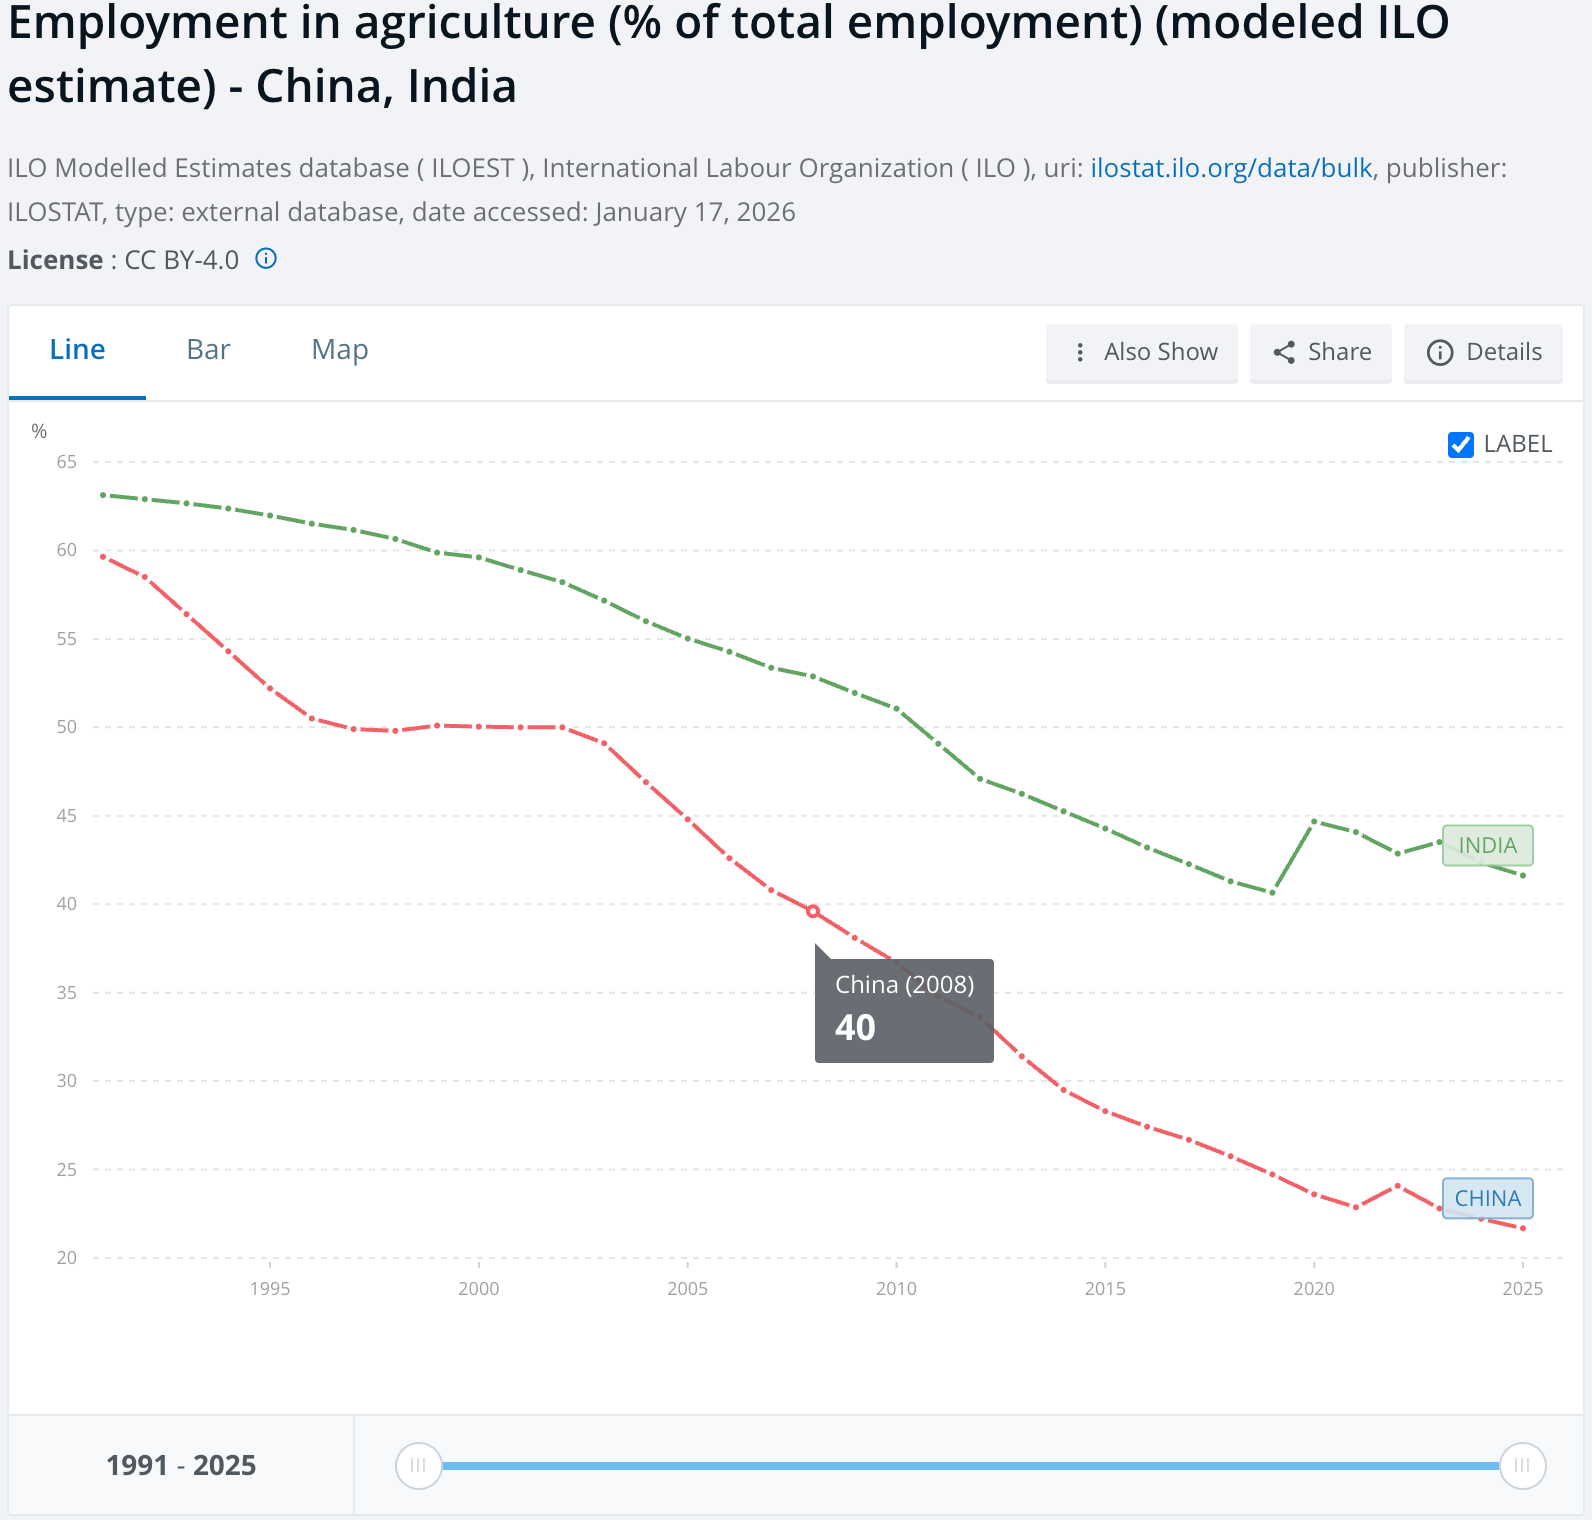
Agriculture tends to be low productivity, and subsistence. For the effort you put into agriculture, you might get character development out of it, but very likely won’t get money. So usually people tend to want to leave for greener (ironic, no?) pastures.
China has about 20% of its population in agriculture. India has 40%. China had 40% in agriculture back in 2008. So again, India is approximately 18 years behind here.
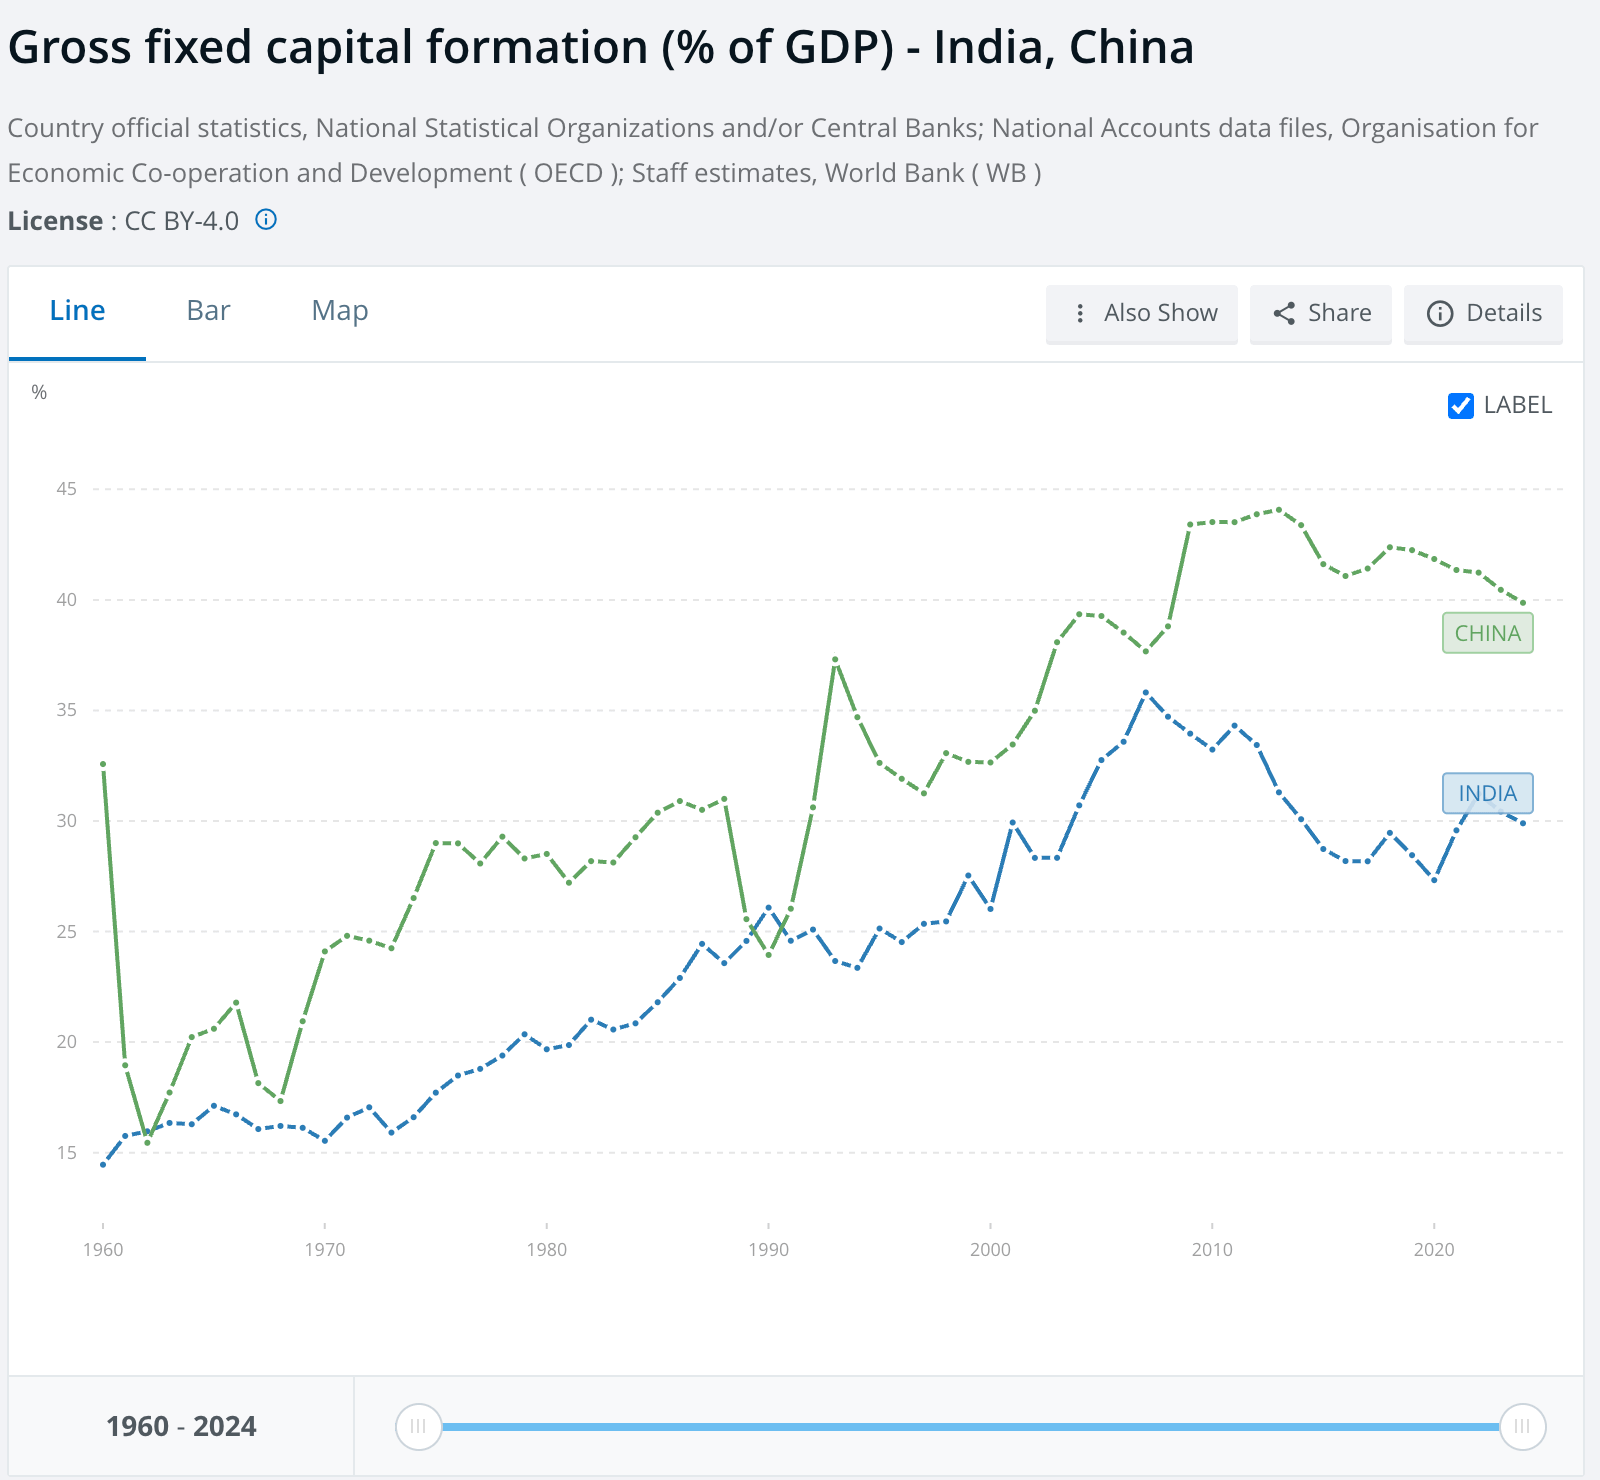
Gross Fixed Capital Formation (GFCF) tracks the amount of investment happening in the economy. Consumption is the amount of money that is spent on personal use. Investment is the money that is saved over from consumption. That gets stored in banks and then lent out.
Investment is important because it creates the capital goods that will produce more output tomorrow. Investing money in buying another lathe machine will allow a factory owner to manufacture more goods, earning more money.
What’s concerning is that India’s GFCF is at a permanently lower level than that of China.
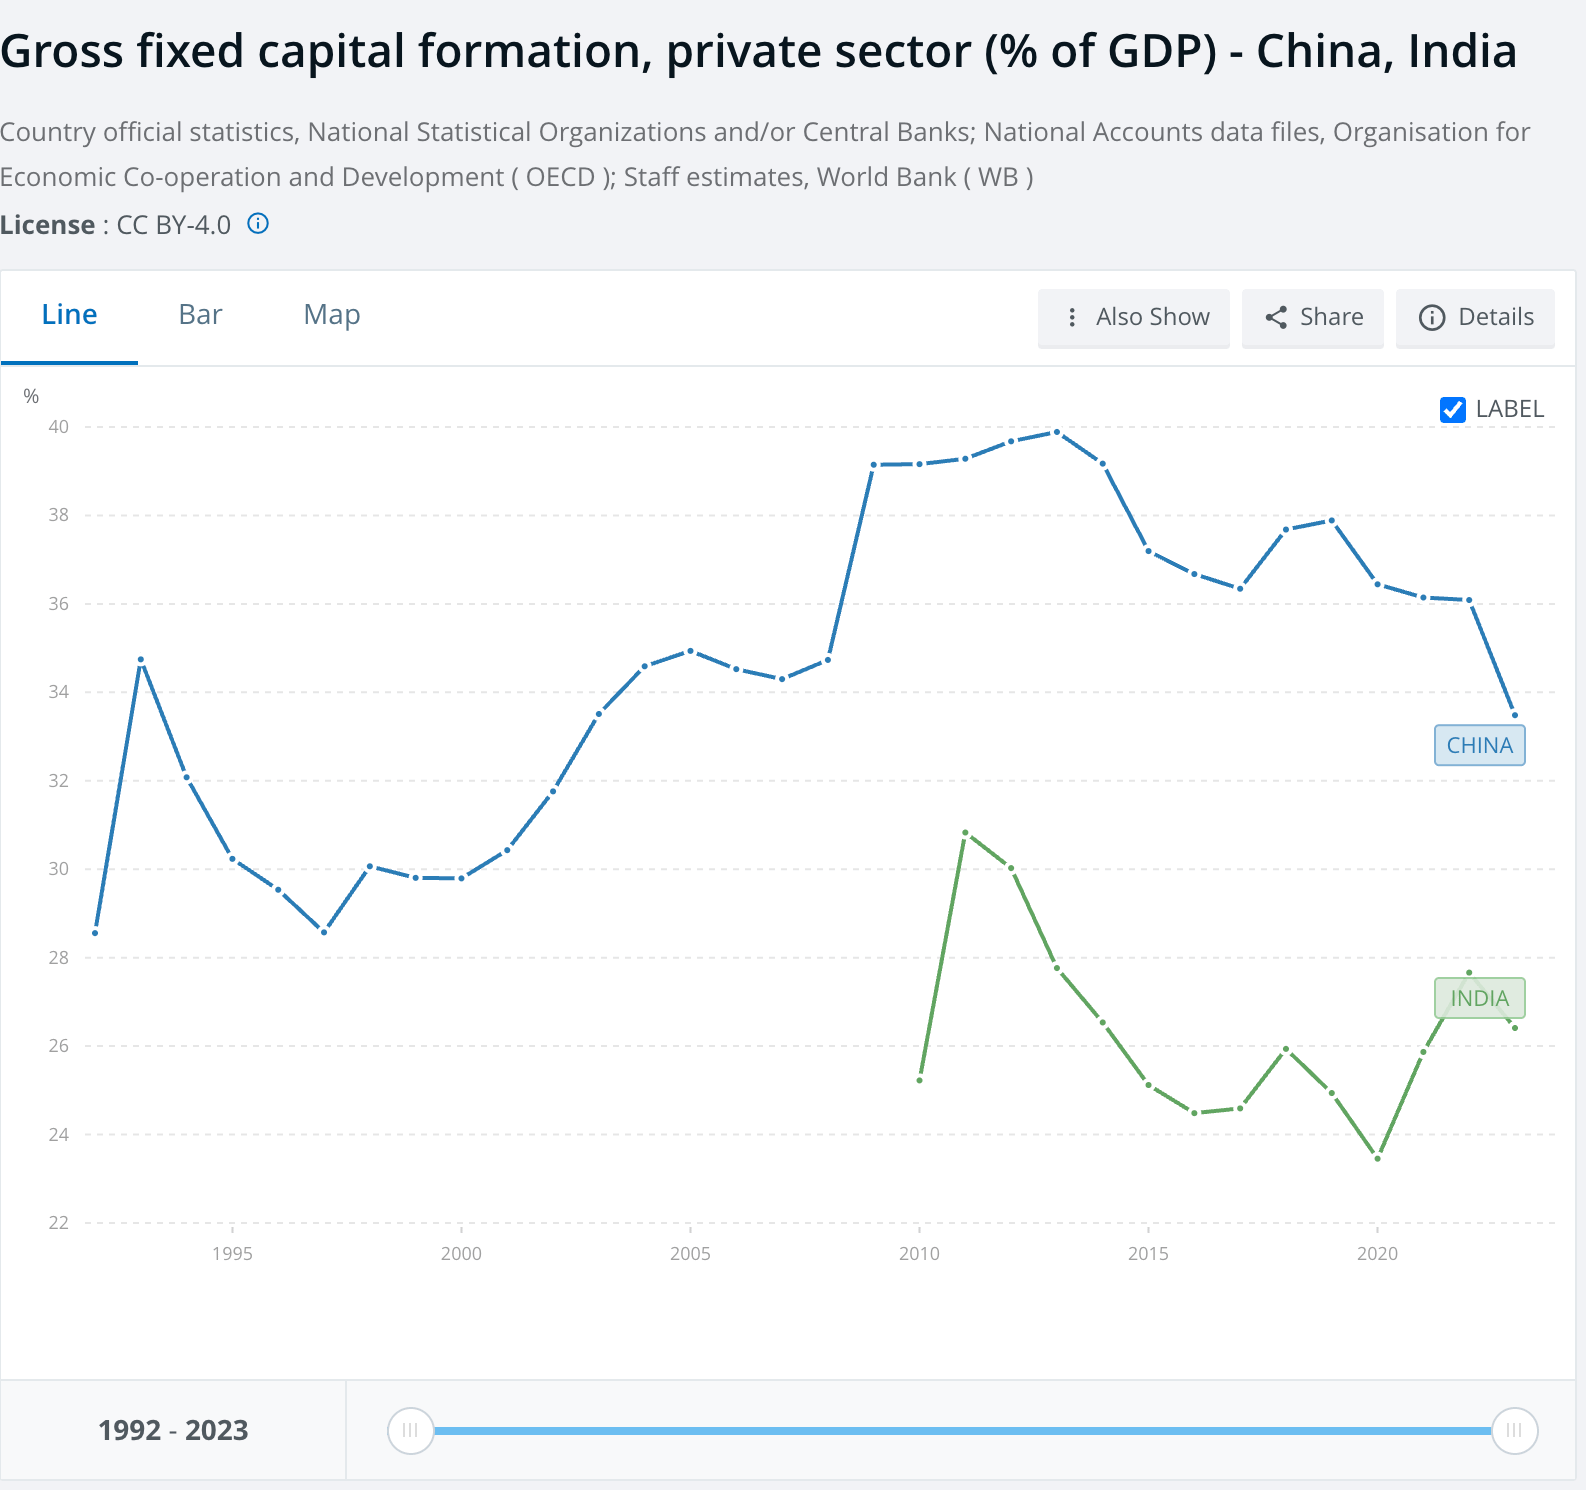
There are two types of investment: government and private. Government investment is in roads, highways and ports among others. But private investment is even more important. Private companies invest in research, machinery and factories. That drives job growth and wage growth.
It is more concerning that India and China have such a big gap in private investment. Part of the reason is that China has repressive financial policies that spur investment. But part of the gap is things like India retrospectively taxing Vodafone or making it hard for Nokia to shut down its factory.
There’s a clear divergence here and I’m not clear on what’s causing this.
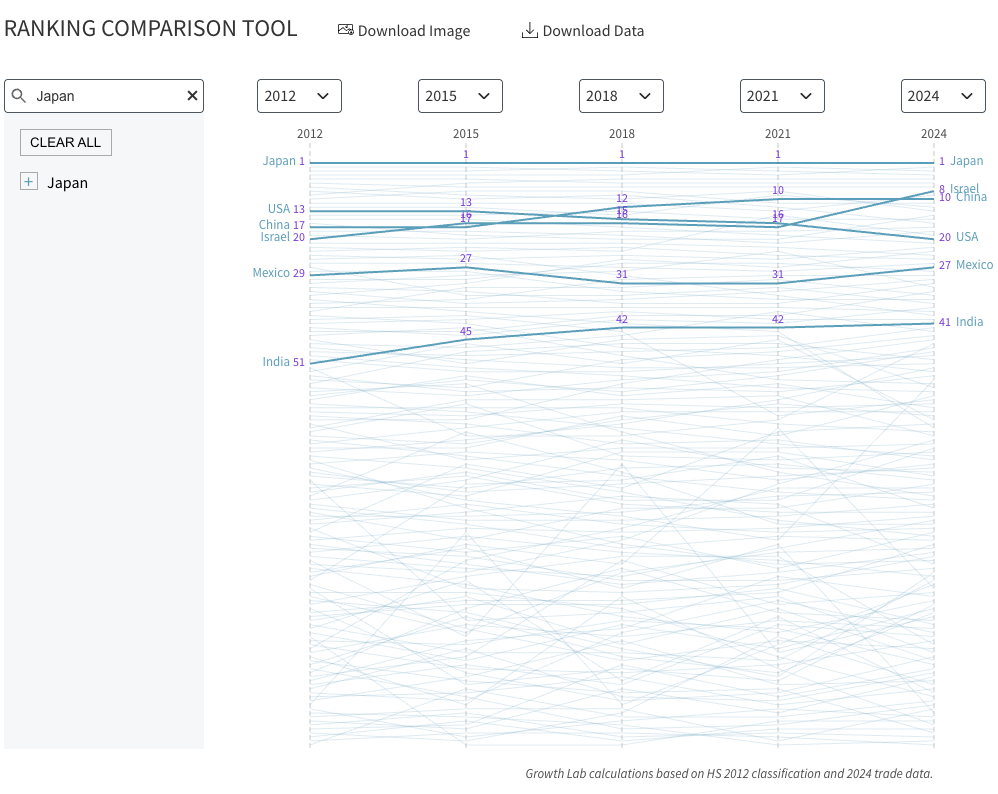
The intuition behind classifying a society as advanced based on numbers like exports or imports tends to favor large countries like the US, China and India. But that doesn’t tell us the technological sophistication of a country. Israel is a small country and puts out small numbers on an absolute scale. Same for Japan. But they have enough technological heft to put out global tech giants.
Economic complexity tends to measure that. China has climbed the ranks over the past decade, but even it falls behind countries like Japan and Israel.
India is also climbing the ranks in economic complexity. And while it is difficult to see, I think India will converge on this metric.
This is an underrated metric. While India might struggle with putting out manufacturing plants at scale, as long as it increases its technological sophistication, it will always be in the game. Policy missteps are costly in terms of time, but they can be fixed. Losing the technological frontier is costlier, and might lead to lost generations.
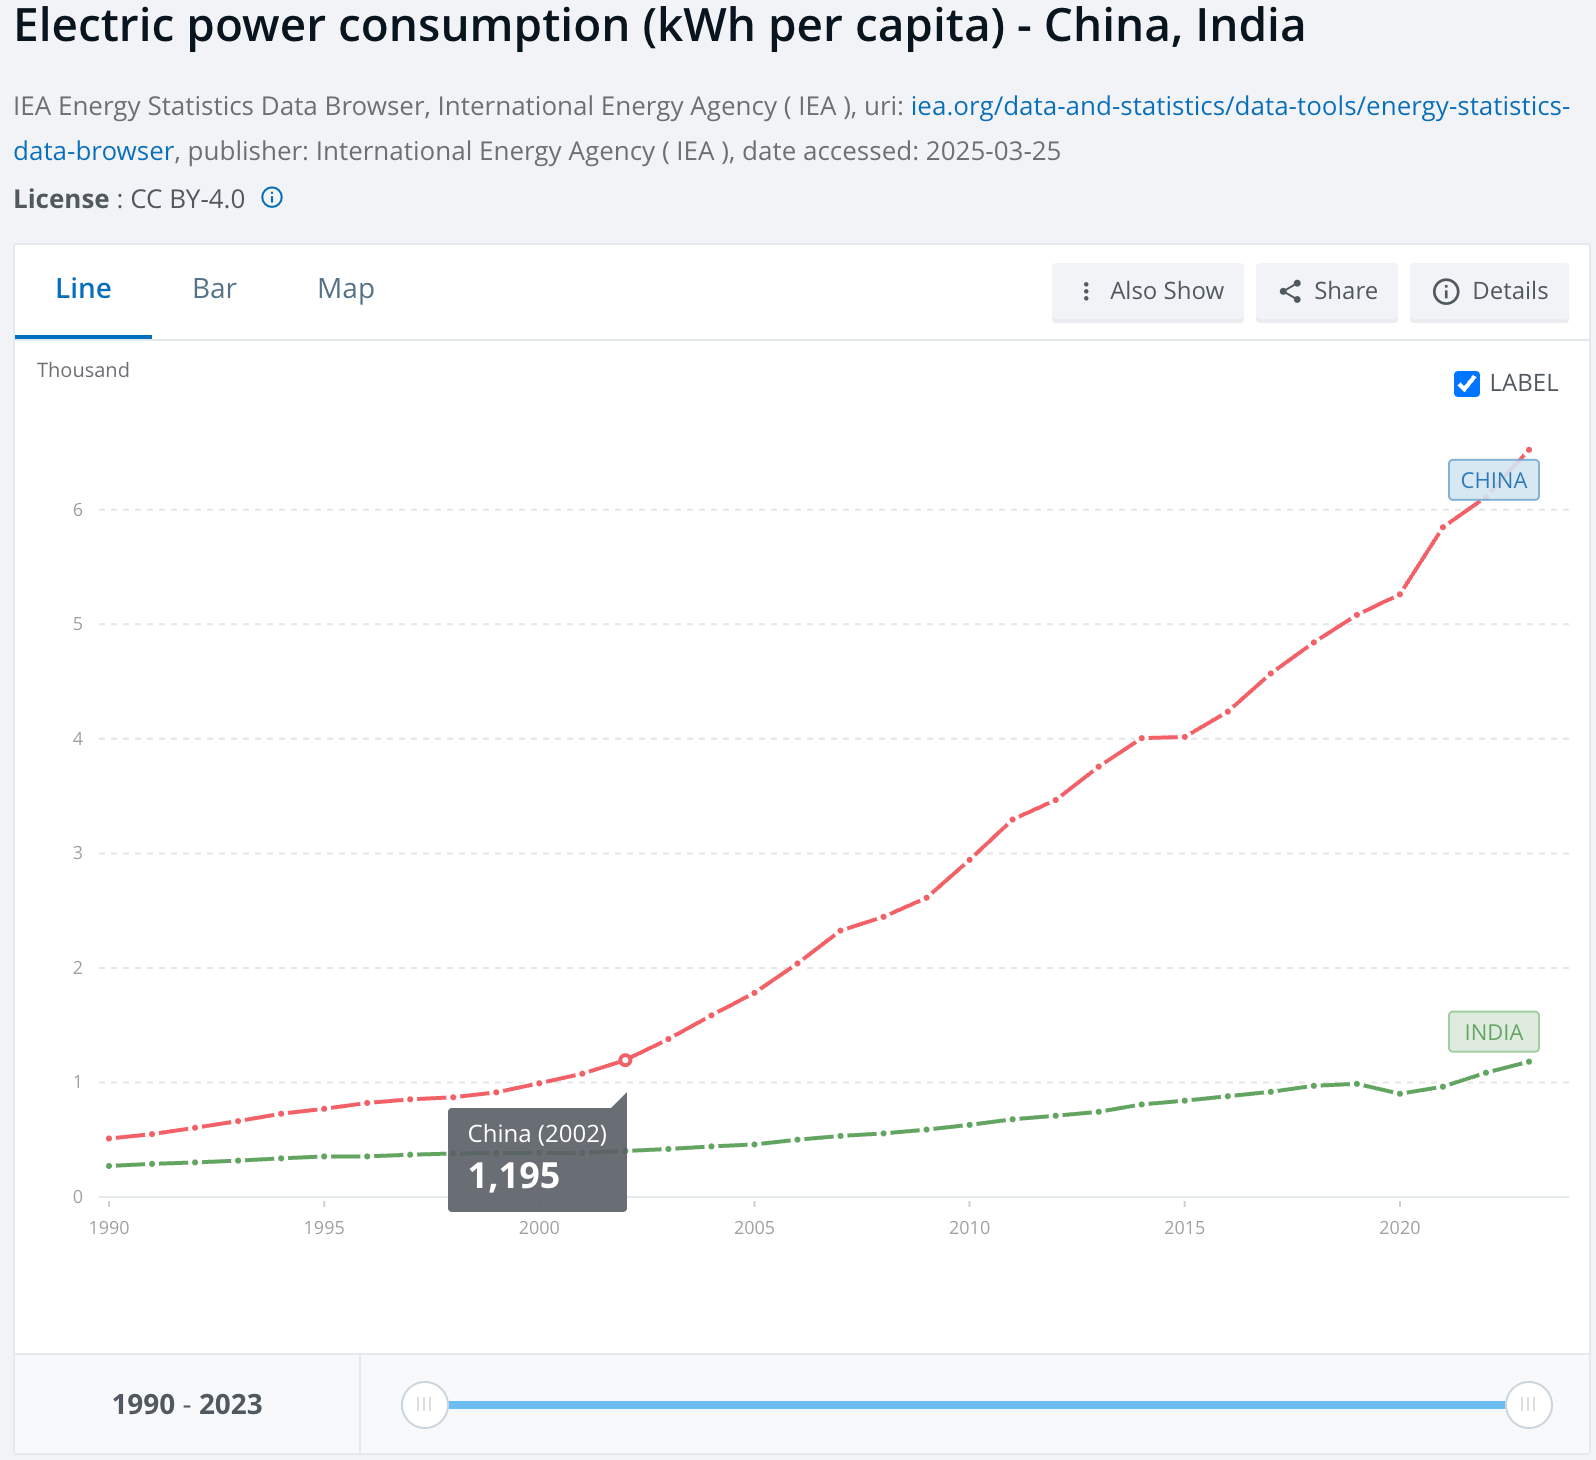
Electricity consumption per capita is an interesting comparison. It is downstream of income. Because India is where China was in 2008 in terms of GDP per capita, you would expect its electricity consumption per capita to be the similar.
However, India’s electricity consumption per capita is at the level where China was in 2002. So India is approximately 24 years behind.
But this gap essentially reveals the dominance of China’s manufacturing sector in the company. Structurally, China’s economy is different than India. So even at the same level of income, China is consuming more electricity to produce whatever output it produces.
Gaps in electricity consumption underscore the difference in service-led growth and manufacturing-led growth.
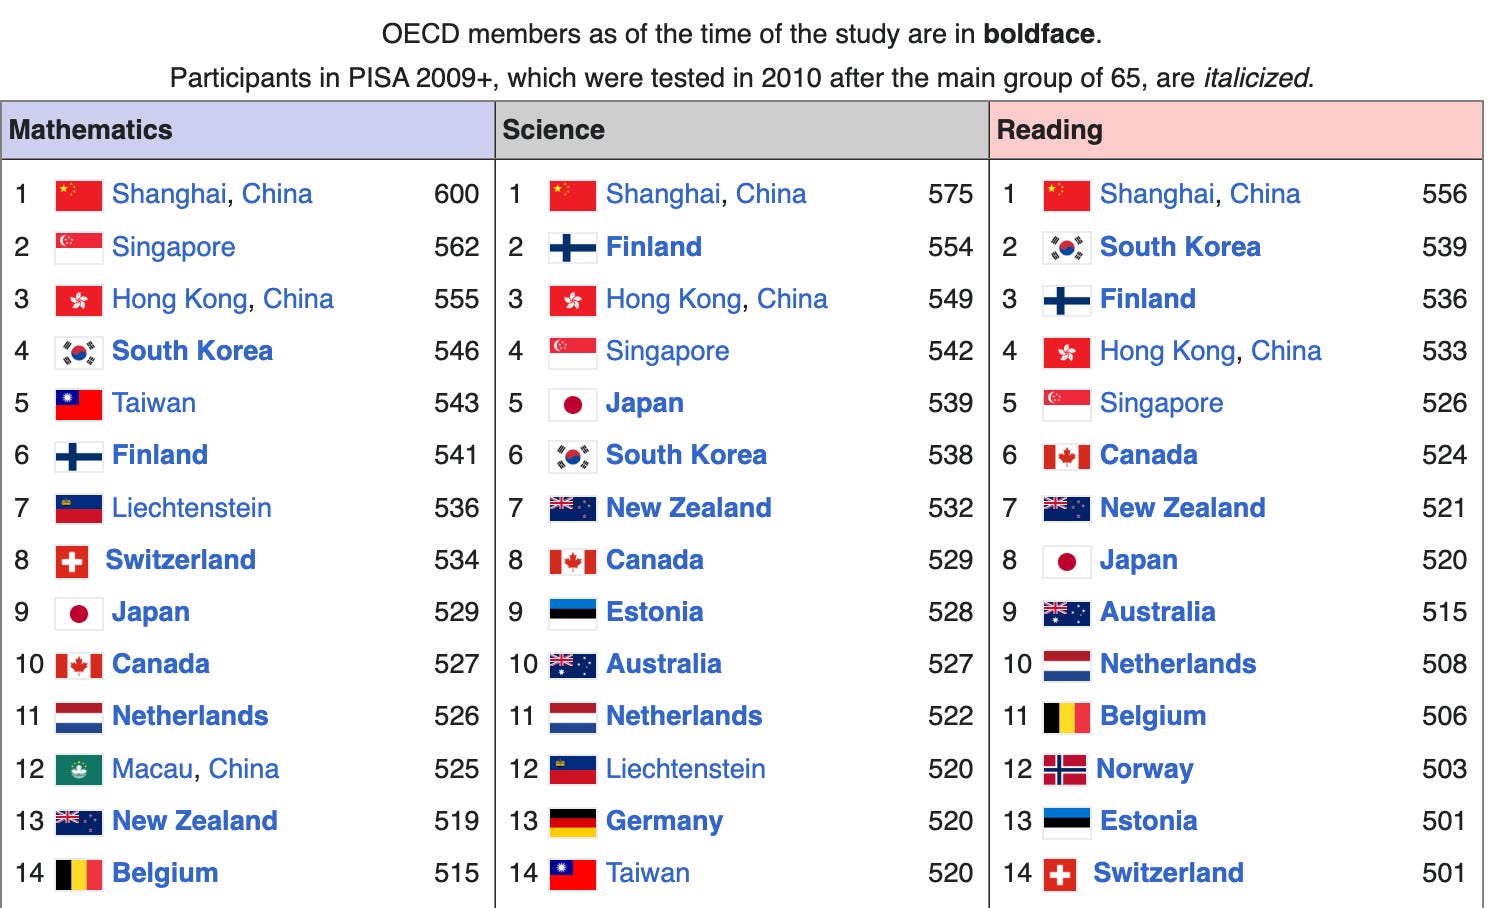
In 2009, India participated for the first and only time in the Programme for International Student Assessment (PISA). PISA ranks countries in math, science and reading. Students from Tamil Nadu and Himachal Pradesh were sent to be evaluated.
The results were embarrassing. India finished 72nd out of 73 countries. China finished first that year. In general, China finishes near the top.
A caveat here is that China’s score are limited to the Beijing, Shanghai, Jiangsu and Zhejiang regions. So they won’t be generalizable to the entire country. It would be similar to India sending students from only Mumbai and Delhi. But even then, I am not so sure that India would rank closer to China.
That’s a much bigger gap that needs to be closed. Free markets aren’t everything. Human capital needs to be cultivated for free markets to unleash prosperity.
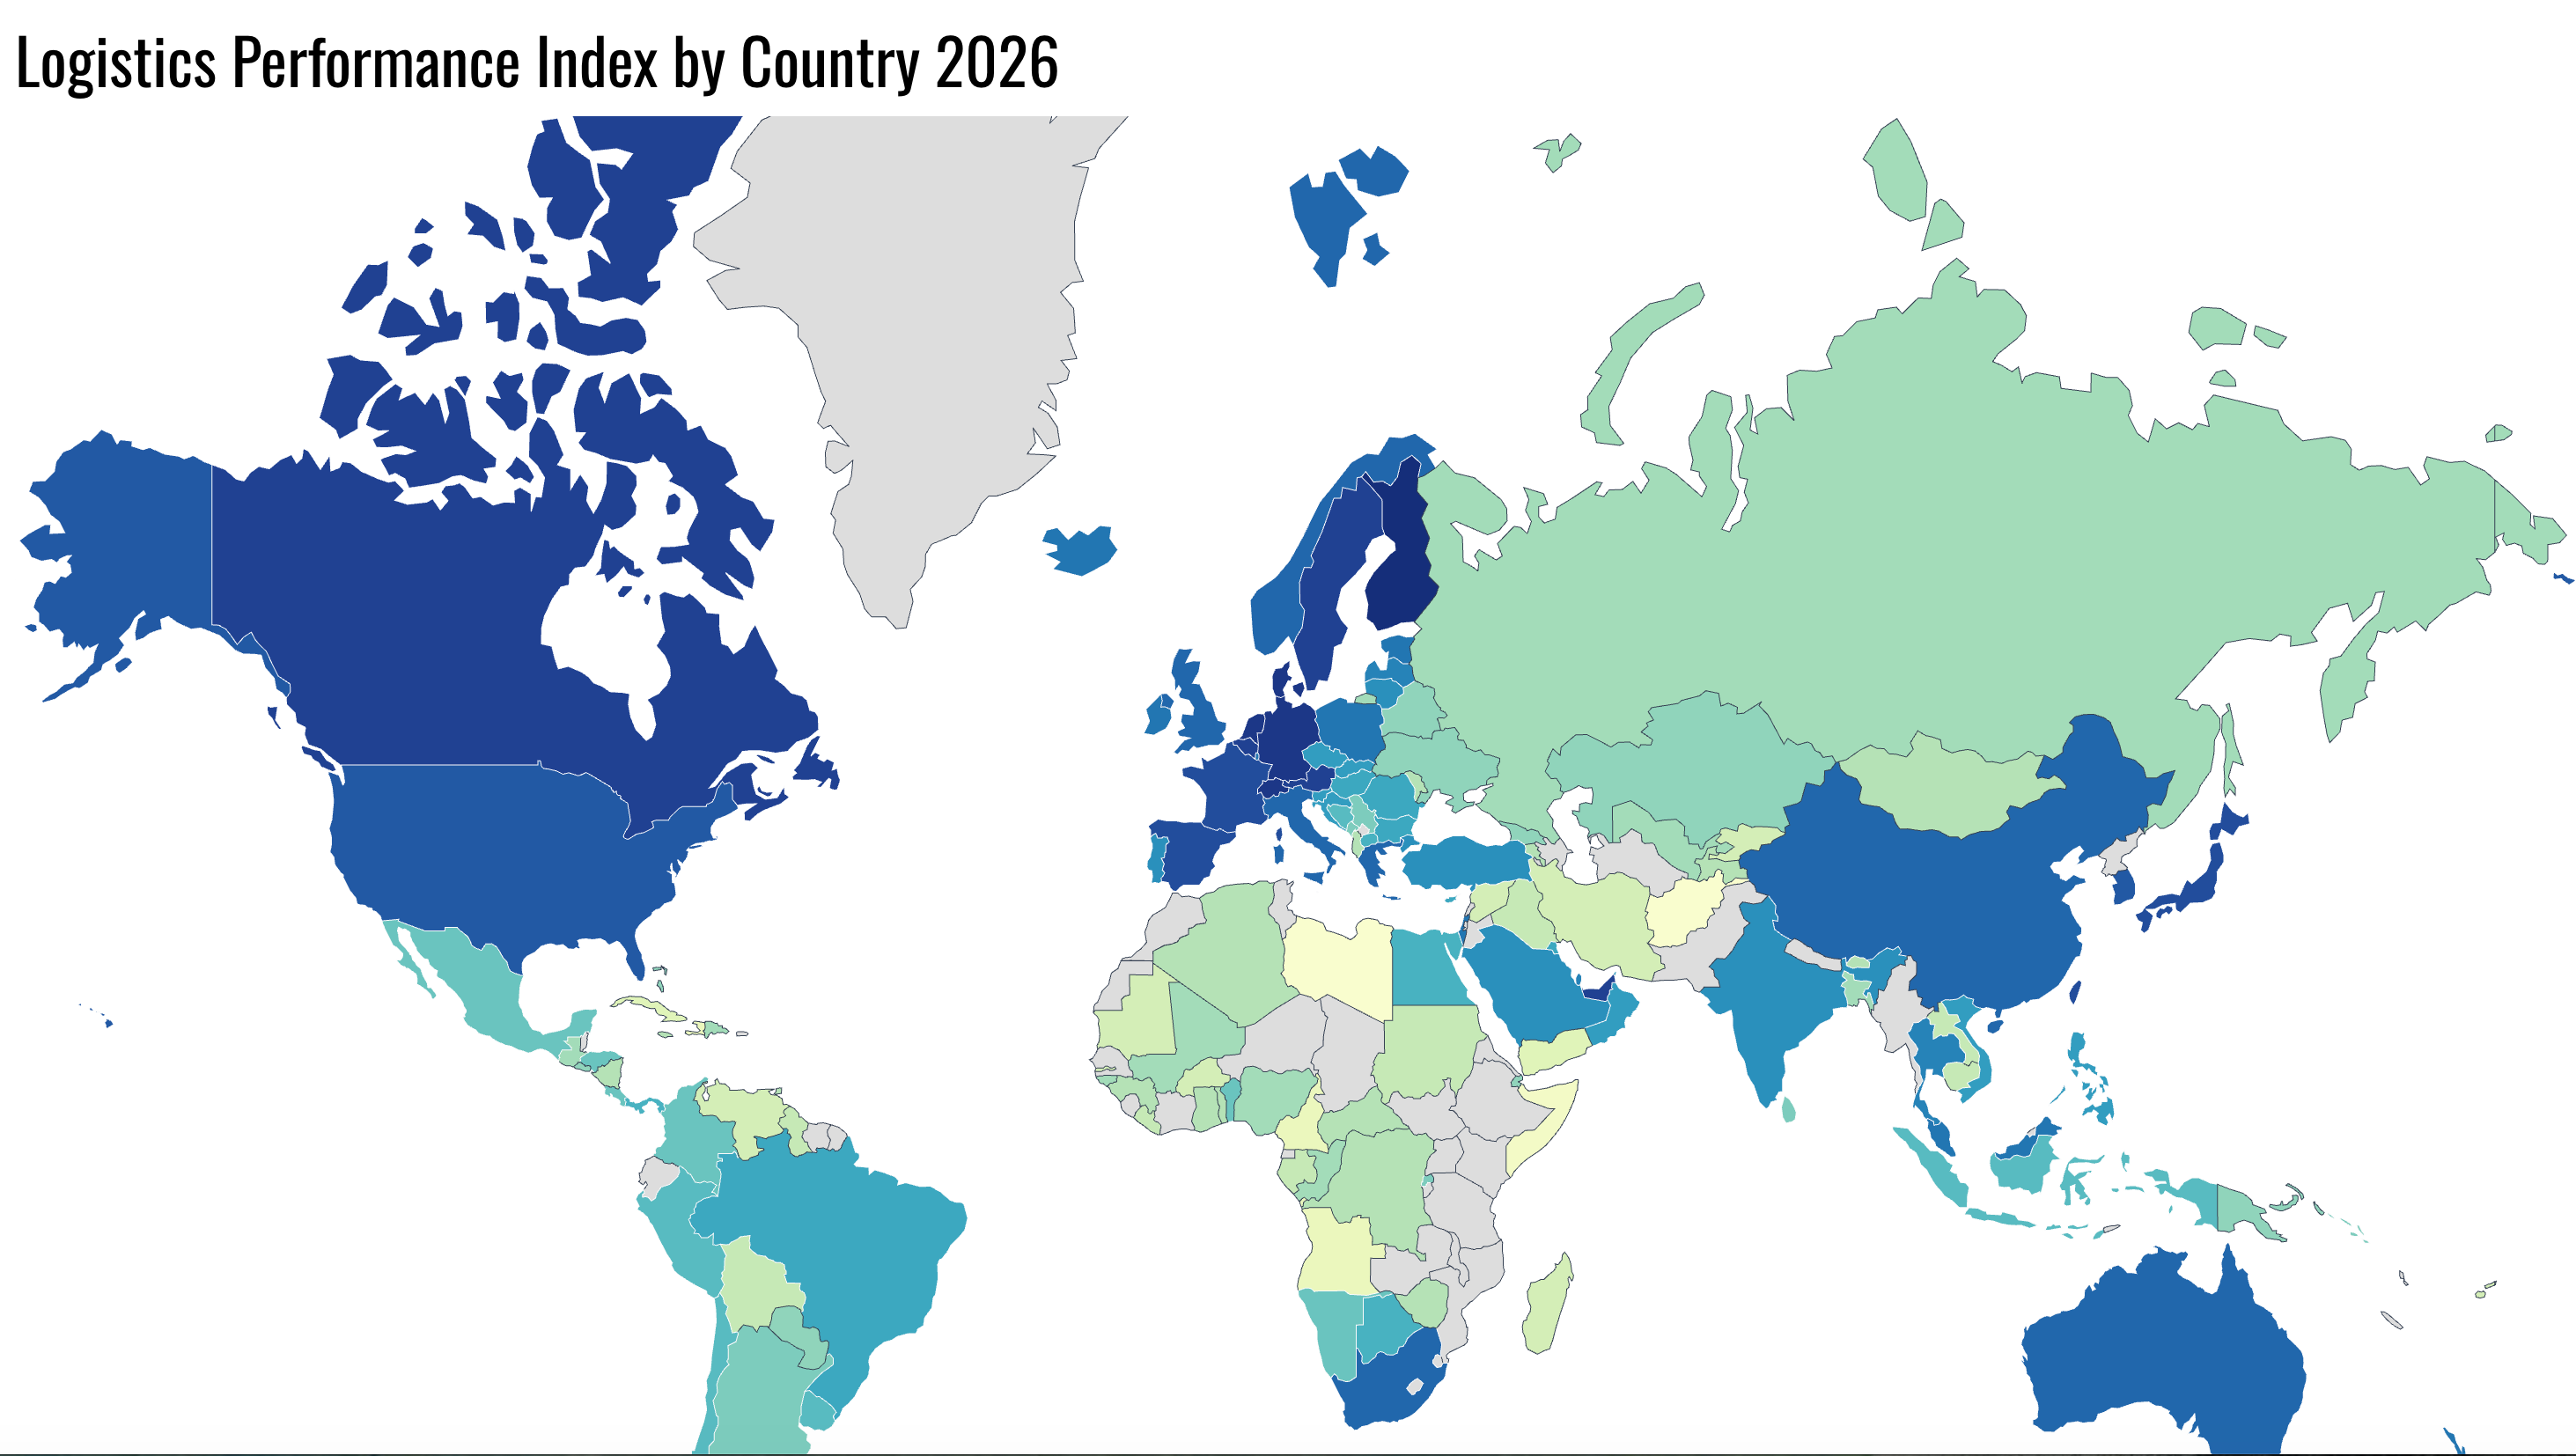
One area where India is competitive with China is in logistics performance. The World Bank compiles such stats regularly.
And logistics is an area that has seen improvement in recent years with hard, visible infrastructure being built. That has been the Modi government’s trademark.
A word of caution here: China moves huge chunks of the world’s trade through its logistics networks. Will India’s system withstand the high volume that China’s trade puts on its network? I’m optimistic, but the fact is that it hasn’t been tested yet.
A few months ago, I did a Twitter thread on the geography of science. Where is research happening the most?
There were interesting comparisons between China and India, but I’ve attached the most relevant graph here. That one shows the share of researchers publishing in the top-5 journals for their fields.
India entered the top-10 rankings in 2020 while China entered it in 2005. That puts China 15 years ahead of India. But it isn’t so simple. Of these top researchers, 25% of them are affiliated to China and only about 2% are affiliated to India. That’s a gap that needs to be closed.
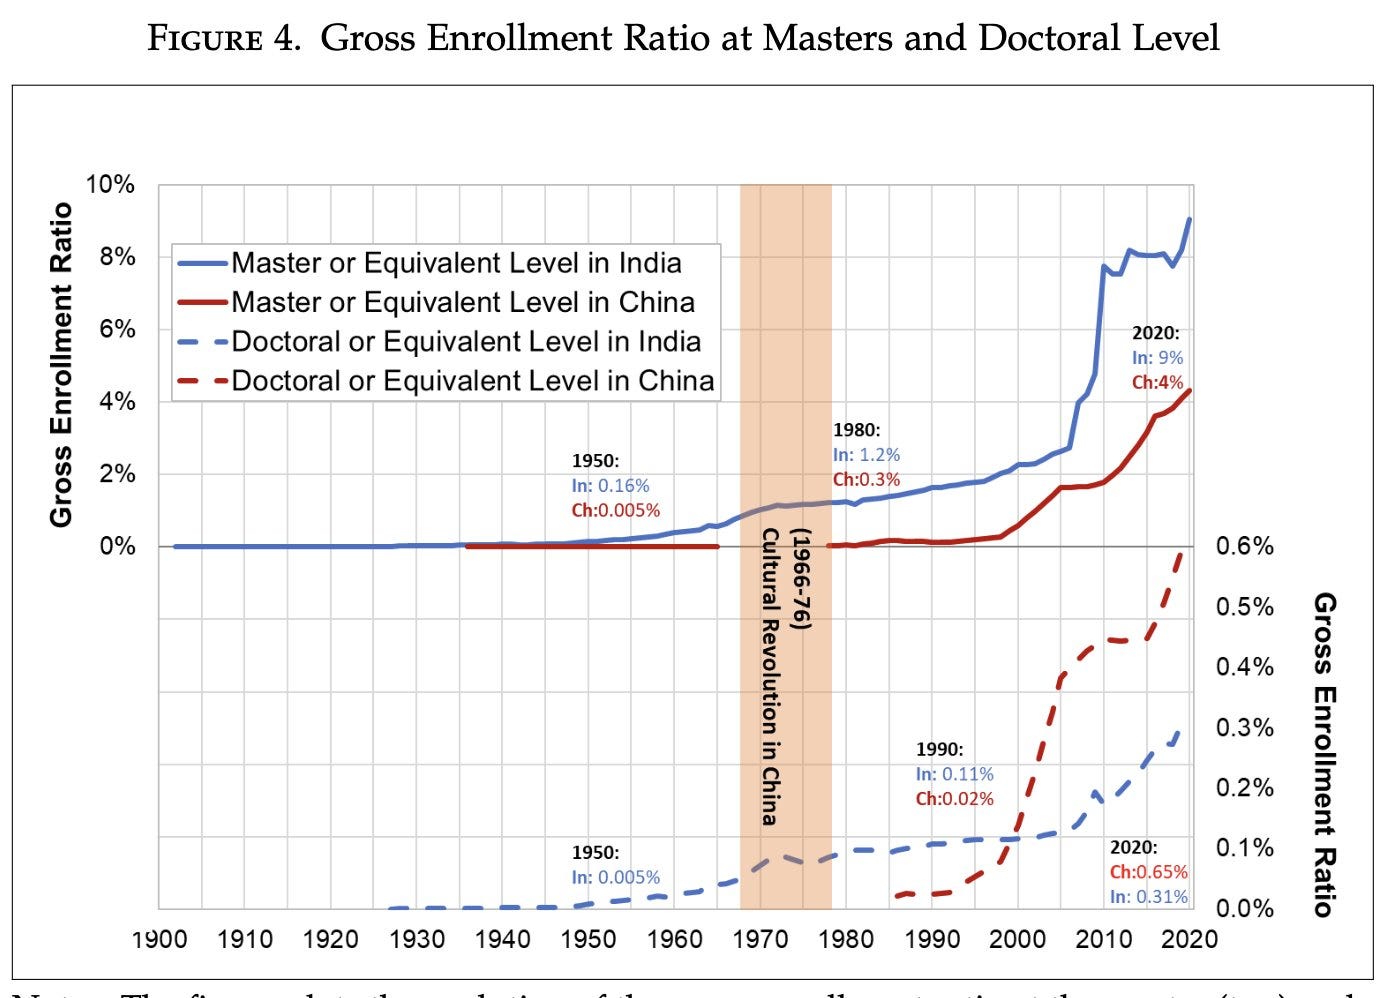
The PISA scores are only an indicator of a much deeper malaise: the human capital gap between India and China. There are many ways in which India lags behind China in human capital. One of them is simply gross enrollment ratio (GER) at the primary and secondary levels of schooling. As many have observed before, India’s tertiary institutions, like the IITs and AIIMS, are globally competitive. But its primary and secondary schools and GERs leaves much to be desired.
Another Twitter/X thread of mine goes into much more detail about this:

Rohit Shinde@rohitshinde121
Sometimes differences between China and India are cast as differences in human capital. So how much human capital does China have and is India behind? And if behind, by how much? Let's examine that through some graphs I stumbled across. 🧵 (1/n)

3:00 AM · Dec 27, 2025 · 62K Views
11 Replies · 118 Reposts · 359 Likes
Suffice to say, that India’s primary and secondary education system has been a big failure and here it is another 12-15 years (depending on how you compute) behind China.
Ultimately, the only rival to China is India. At present, it is scoffed at to even put India and China in the same sentence. But I don’t believe it would be the case in another 20 years.
For one, China’s growth is slowing. It has structural deficiencies that are hard to paper over. India has to maintain a 7% growth rate for slightly more than a decade and it would come close to eclipsing China.
While China did execute competently, it got the tailwinds of globalization. India faces major global headwinds.
Nevertheless, I think India can do it.
Thanks for reading The Indic Prism! This post is public so feel free to share it.
Lant Pritchett goes into more depth in his paper: “Economic growth is enough and only economic growth is enough”. Infant mortality rate, maternal mortality rate, life expectancy, literacy, road quality and any other metric you can think have a correlation coefficient of 0.9 with GDP.
Comments
Nothing yet. Say the first thing.
Sign in to join the conversation.