
The CFTC published Tuesday’s positioning yesterday afternoon as you know.
I ran it against three years of history for all 49 markets I track.
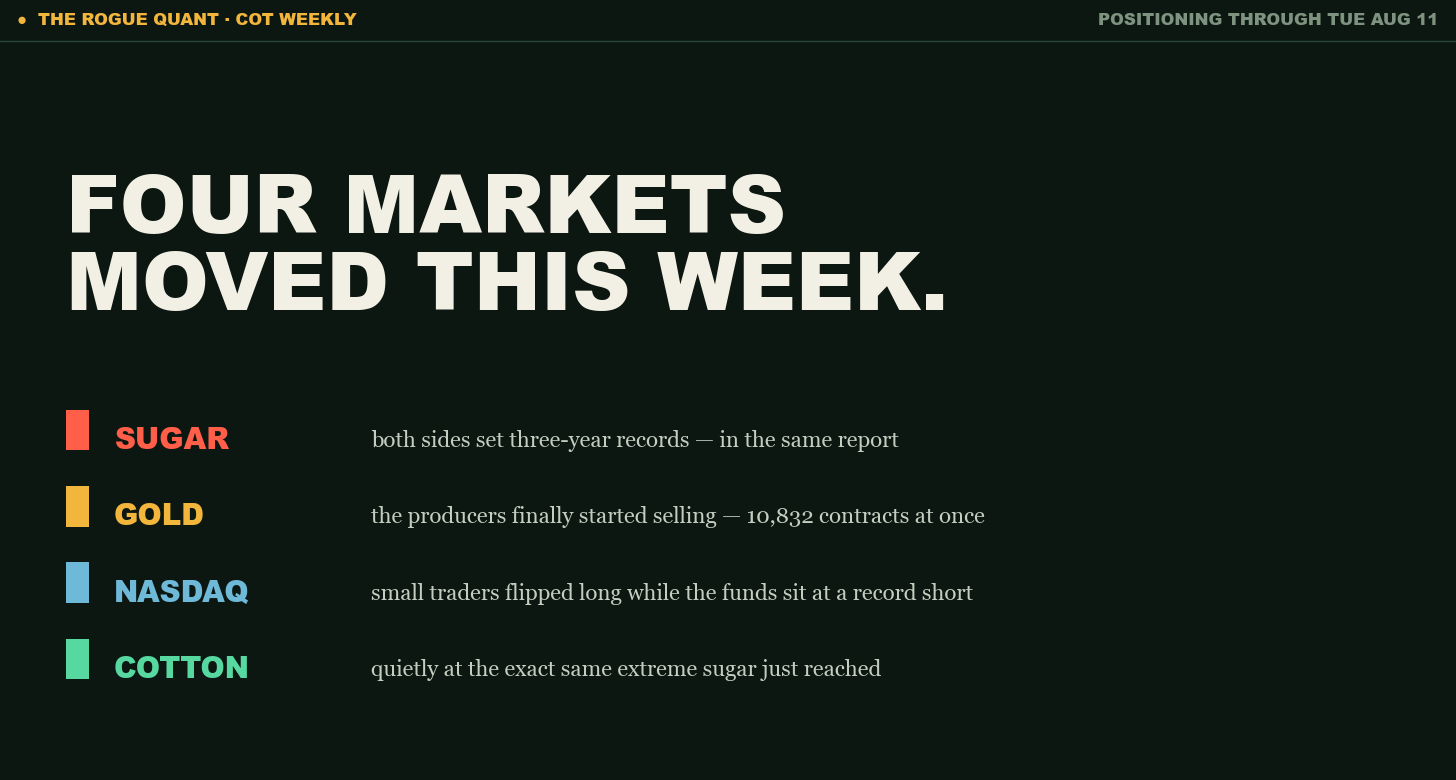
Four headlines made the cut this week…
Let’s dive in…
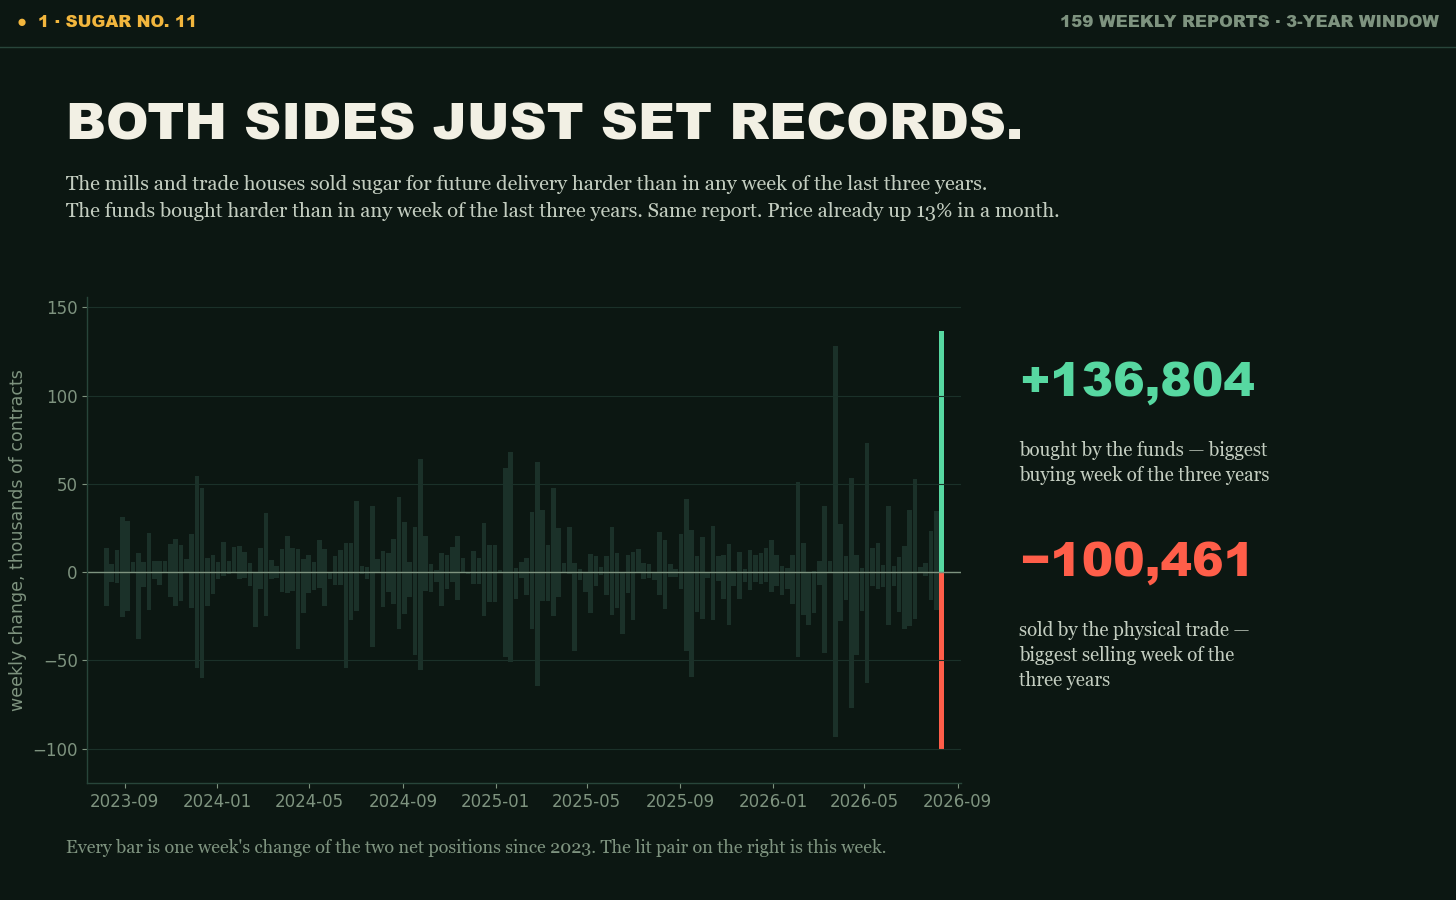
The mills and trade houses sold 100,461 contracts of sugar for future delivery in one week which is their biggest selling week of the past three years.
The funds bought 136,804 also their biggest buying week of the same three years.
Both records landed in the same report, with price already up 13% in a month (it’s a shame that I’m not running any algos on Sugar…)
Here’s the thing to keep in mind when both sides dig in like this: they’re not under the same pressure.
The physical trade is selling sugar it will produce anyway, that position can sit still for months without anyone asking questions.
The funds’ brand-new long gets marked to market every day.
One side is locking in a price; the other side needs the price to keep moving.
Usually (if my math is correct) only one of them has to be right on a schedule.
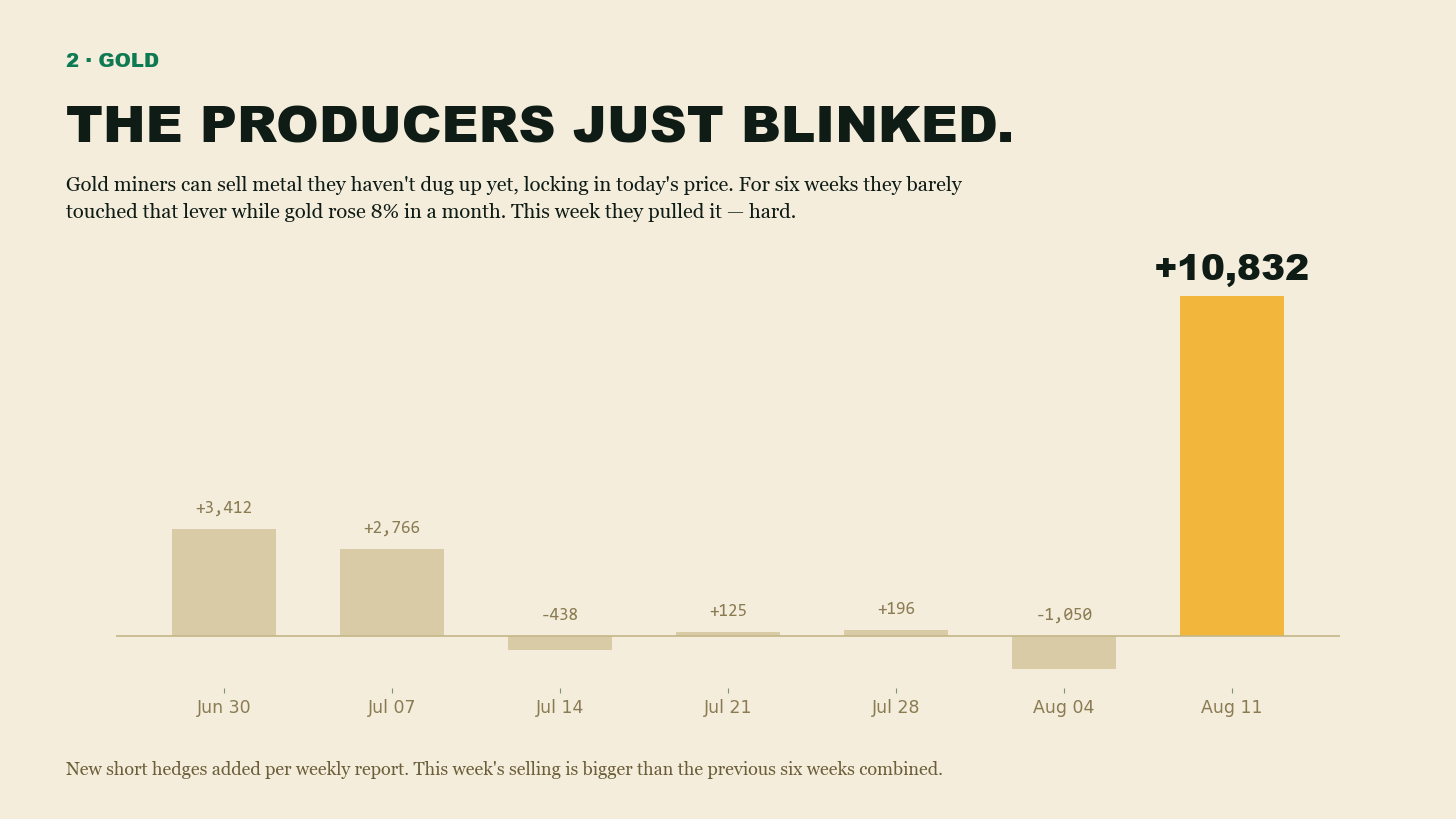
Last week I wrote that the gold producers had spent six weeks refusing to sell into a rising price, and that watching whether they started was the whole game.
They started.
10,832 contracts of new selling in a single report which is more than the previous six weeks combined.
Miners locking in today’s price on metal they haven’t dug up yet, after a month of sitting on their hands while gold rose 8%.
Whatever was keeping them out it’s not anymore…
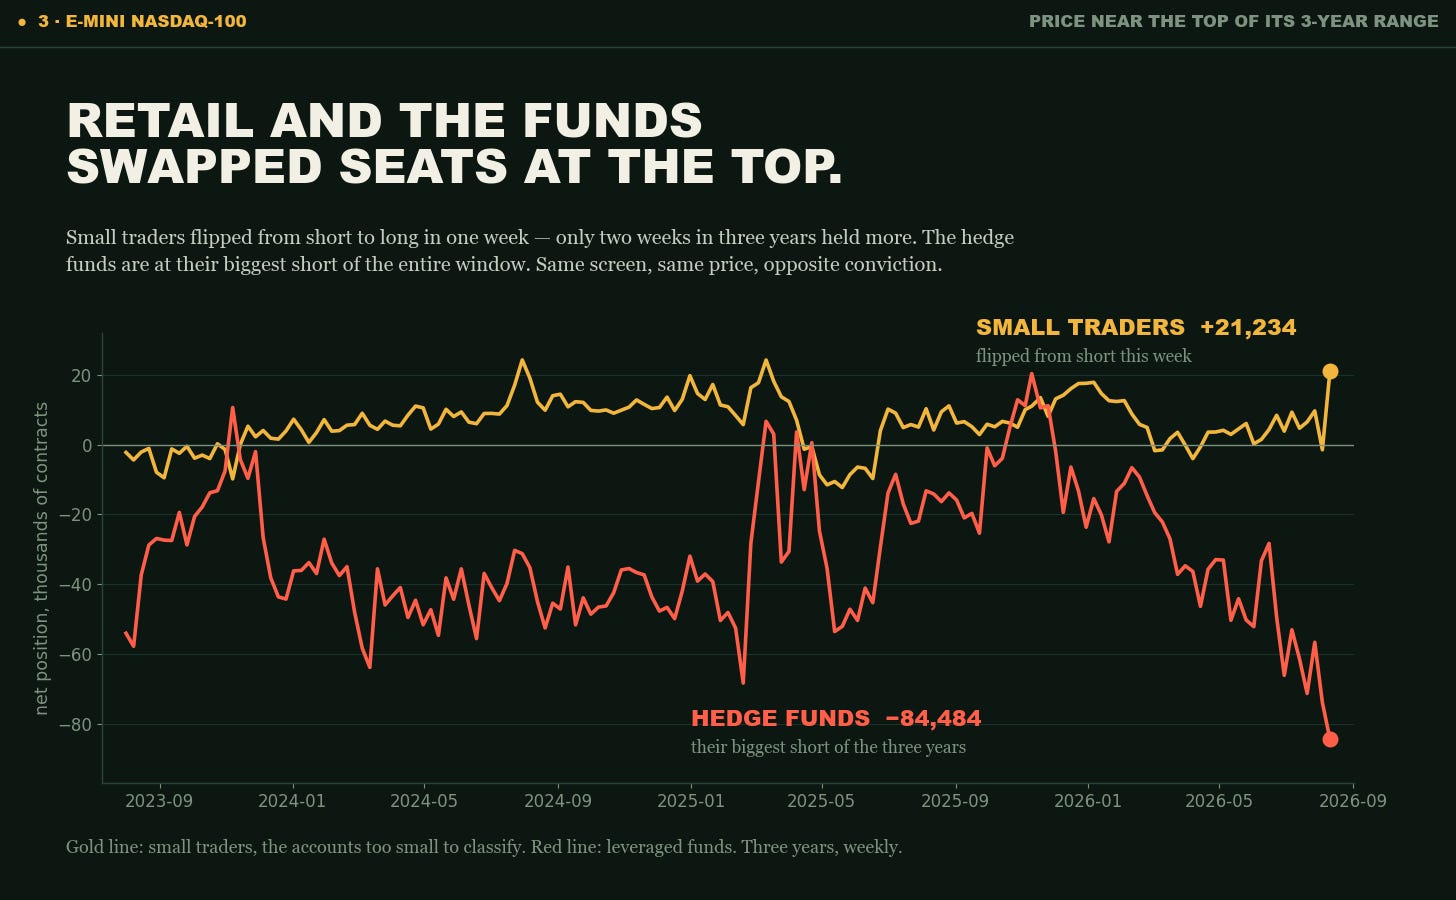
With the index near the top of its three-year price range, the small traders (those accounts too small for the CFTC to classify) flipped from net short to net long in one week.
Only two weeks in the entire three-year window held a bigger long.
Meanwhile the hedge funds pushed their short to 84,484 contracts, the largest of the window. Full stop, the record.
Retail buying the top of the range while the fast money sells it, both sides of that argument, on one screen, in the same report.
One of these two groups is about to be very wrong…
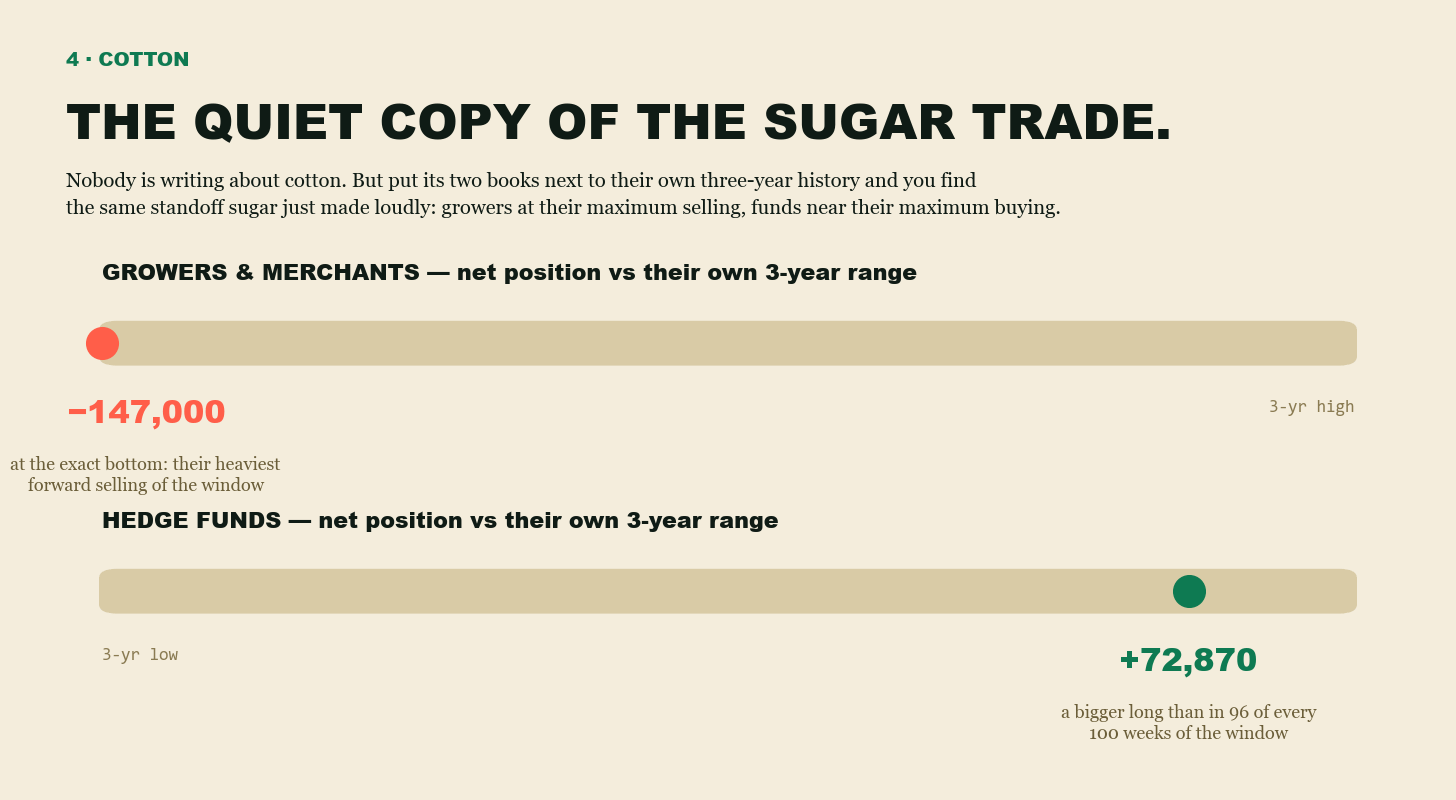
Nobody is writing about cotton.
But the growers and merchants just hit the exact bottom of their three-year range, their heaviest forward selling of the window while the funds hold a bigger long than in 96 of every 100 weeks of that same window.
That’s the sugar standoff, replayed one field over, without the headlines.
The quiet ones are usually the ones worth a second look.
Each of these four is one row on the members portal, the positioning by trader group, the three-year history behind it, the price panel next to it, and the week-over-week change that put it on this list.
The same view exists for the other 45 markets, updated within an hour of every Friday release.
To access it on the portal, go to ‘Research’ and then ‘CoT Edge’.

Talk soon,
— Leo
The Rogue Quant
Data: CFTC Commitments of Traders (Disaggregated Combined and TFF Combined — futures plus options converted to futures equivalents), positioning through Tuesday 2026-08-11, released 2026-08-14. Price action through Friday close, August 14. Positioning compared against a rolling three-year window.
DISCLAIMER: This information is provided for educational and informational purposes only. It is not financial advice, nor a recommendation to buy or sell any securities or financial instruments. Trading involves substantial risk and is not suitable for every investor. You are solely responsible for your own investment decisions and should seek advice from a licensed financial advisor before acting on any information provided in this article. The author(s) and publisher disclaim all liability for any loss or damage arising directly or indirectly from the use of this information. Research commentary, not investment advice. CoT data describes aggregated positioning, not trader intent or predictions. Use this information at your own risk.
Comments
Nothing yet. Say the first thing.
Sign in to join the conversation.