

Here is something that few people are aware of — per capita carbon dioxide emissions (pcCO2) from fossil fuels peaked globally in 2013 and have remained below that level ever since. The trend in pcCO2 is best characterized as a plateau, as shown in the figure below. In fact, in 2025 global pcCO2 was only 2.3% above 1979, even as world population increased by ~88% and total energy consumption doubled.
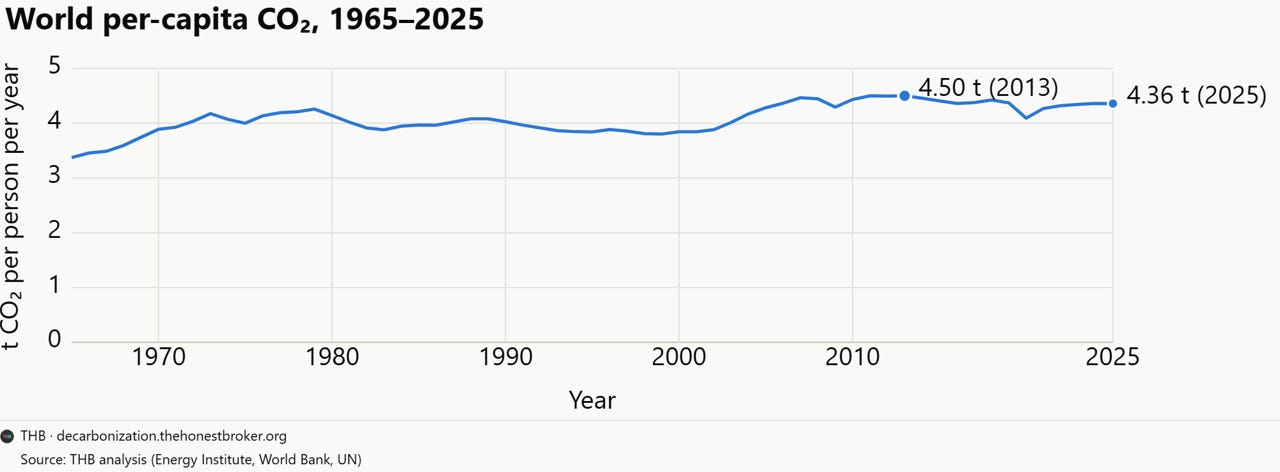
Today I am starting a new series on what we can learn about decarbonization and how it might progress into the future by looking closely at pc carbon dioxide emissions around the world, taking advantage of forthcoming data and tools at the new THB Decarbonization dashboard.
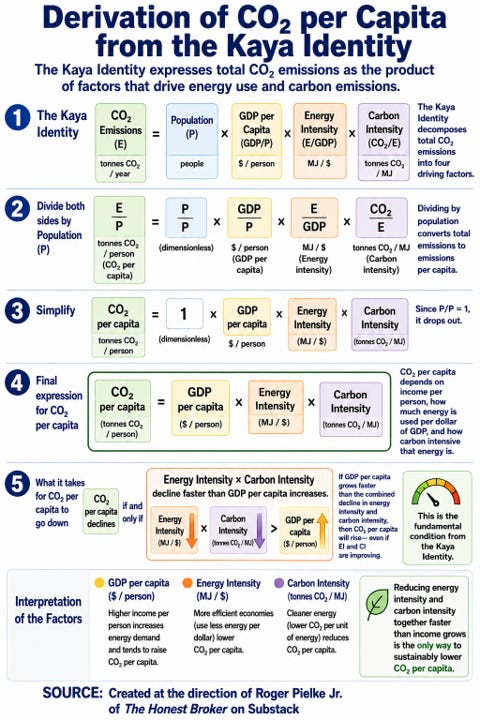
The first thing to understand is why pc carbon dioxide is a useful metric. The figure below summarizes its derivation from the Kaya Identity. Whether pcCO2 rises or falls is the outcome of a competition between increasing per capita GDP and decreases in energy intensity of GDP and carbon intensity of energy.
That means pcCO2 is an integrated metric that reflects the sum total of all factors that combine to result in decarbonization. That makes it a very simple yet very powerful tool for understanding what factors lead to decarbonization and how they might play out into the future.
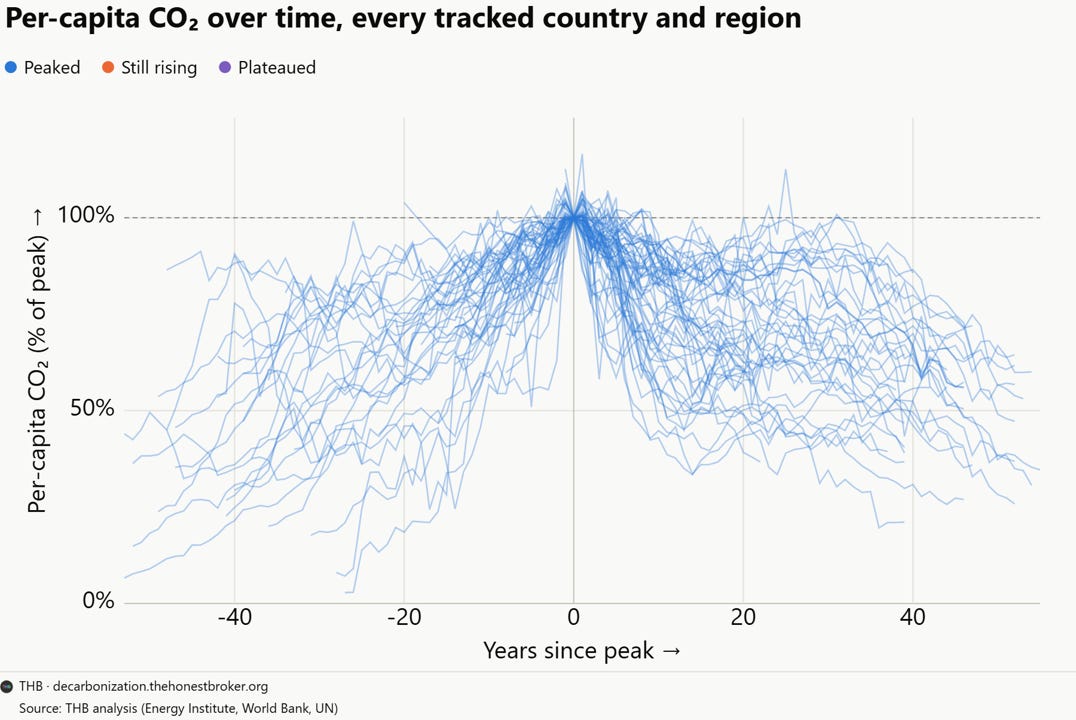
Of the 78 countries tracked in the Energy Institute Statistical Review of World Energy (2026), covering ~6.5 billion people, about 80% of the world population:
57 have already seen pcCO2 peak and decline (representing ~28% of world population and ~52% of global GDP),
9 have plateaued (~4% of population, 3.7% of GDP),
and 12 are still rising (~47% of population, ~37% of GDP).
Today’s post takes an initial look at what sets apart countries that are past peak pcCO2 (peakers) from those that have yet to peak (non-peakers). Those that have peaked and declined are shown in the figure below with the peak of each set to 100.
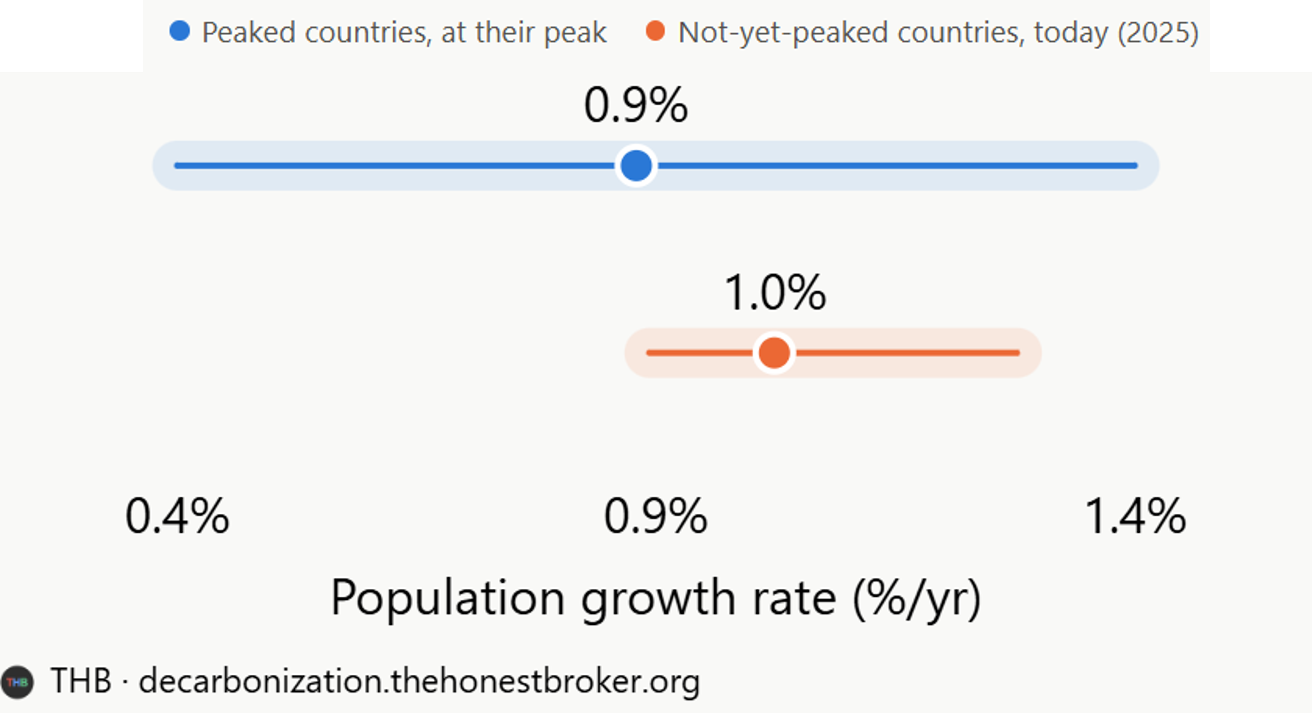
Upon hitting their peak, the peakers are richer than the non-peakers — on average with more than twice the per capita GDP and on average consuming about 4 times the per capita energy of the non-peakers. Interestingly, population growth rates differ little between the two groups.
So what does distinguish the two groups?
Coal: The economies of large, populous, still-industrializing economies — China, India, Vietnam, Indonesia, the Philippines, with a combined population of ~3.4 billion, 41% of 2025 world population — depend on coal for 45% to 65% of their energy consumption.
Wealth: The peakers are much wealthier with per capita GDP at the peak much higher than the non-peakers today. Non-peakers however are growing GDP faster with an average annual rate of 2.5% and peakers at 1.3% per year.
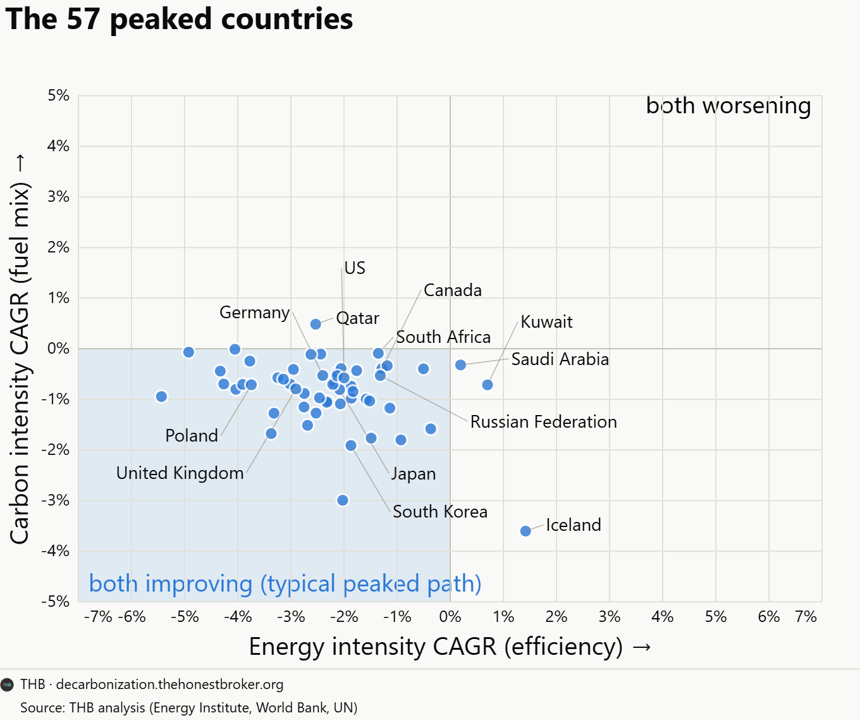
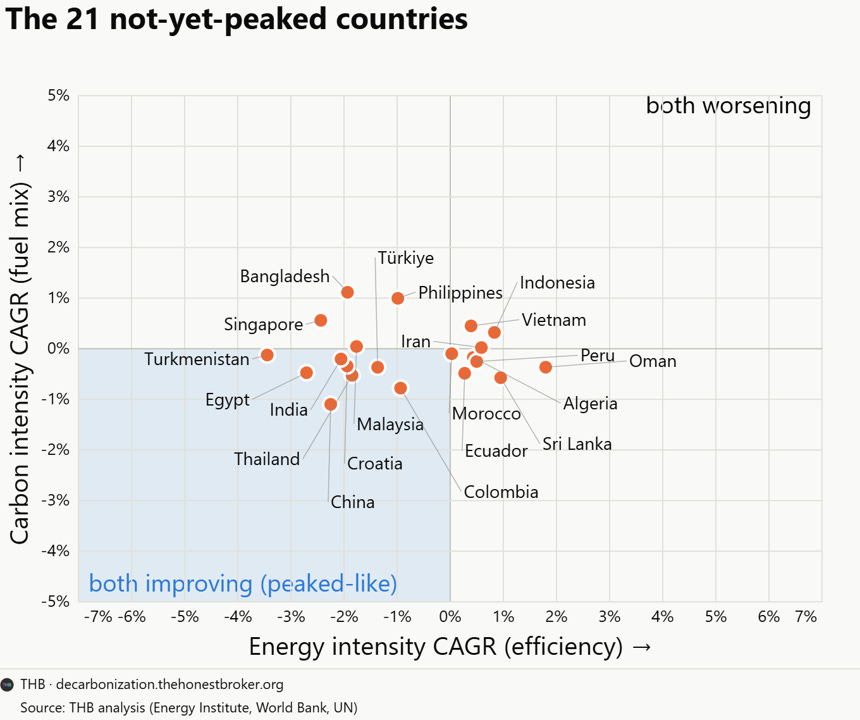
Energy intensity and carbon intensity: Among the peakers, 51 of 55 (with available data among the 57) have seen average annual declines on both EI (energy intensity) and CI (carbon intensity) since peaking. Among the 21 non-peakers, 10 have seen declines in CI or EI, but not both, 8 have seen declines in both CI and EI, including China and India, suggesting that a peak may be in their near-future, and 3 are moving the wrong way on both CI and EI — Vietnam, Indonesia, and Iran.
The figure below shows a scatterplot of CI and EI growth rates for the 57 countries with decreasing pcCO2. Almost all sit in the quadrant where both CI and EI are decreasing. This figure shows that CI and EI are complementary, however, as we will se later in this series, simple math means that CI must carry the load to achieve deep decarbonization.
The figure below shows a scatterplot of CI and EI growth rates from 2000 to 2025 for the 21 countries that have yet to hit peak pcCO2. Importantly there are some countries — notably China and India — that are in the quadrant where both CI and EI are improving, but not enough to have caught up to the growth rate in per capita GDP and lead to falling pcCO2, but they are moving in the right direction.
This initial look at pcCO2 tells us several interesting things about conditions that are favorable for emissions reductions, which are required to hit targets for deep decarbonization:
Wealth is a prerequisite;
So too is a high level of energy consumption;
Energy intensity and carbon intensity reductions combined must exceed growth in per capita GDP;
Overall population growth is a secondary factor, if even that.
As this series continues look for these future discussions:
Projections of pcCO2 can be used to create simple, understandable, transparent, and plausible scenarios of future emissions;
When we might expect China, India, and other countries to hit their peaks;
Improvements in CI will matter more than improvements in EI, and specifically the future of coal;
A lower-than-projected future population would imply greater pcCO2, but lower cumulative CO2 over the century.
Why I think that the world has likely passed peak pcCO2. However, whether or not the world has already seen that peak depends significantly on what happens across Africa this century.
As I get towards the end of this series I’ll release a new data dashboard, from which all of the images above were taken. You will then be able to explore the data, assumptions, and create projections yourself.
Meantime, you can explore per capita carbon dioxide emissions at THB Decarbonization Around the World.
Don’t go just yet — Please click that “❤️ Like” button.
Appreciated!
Comments
Nothing yet. Say the first thing.
Sign in to join the conversation.