
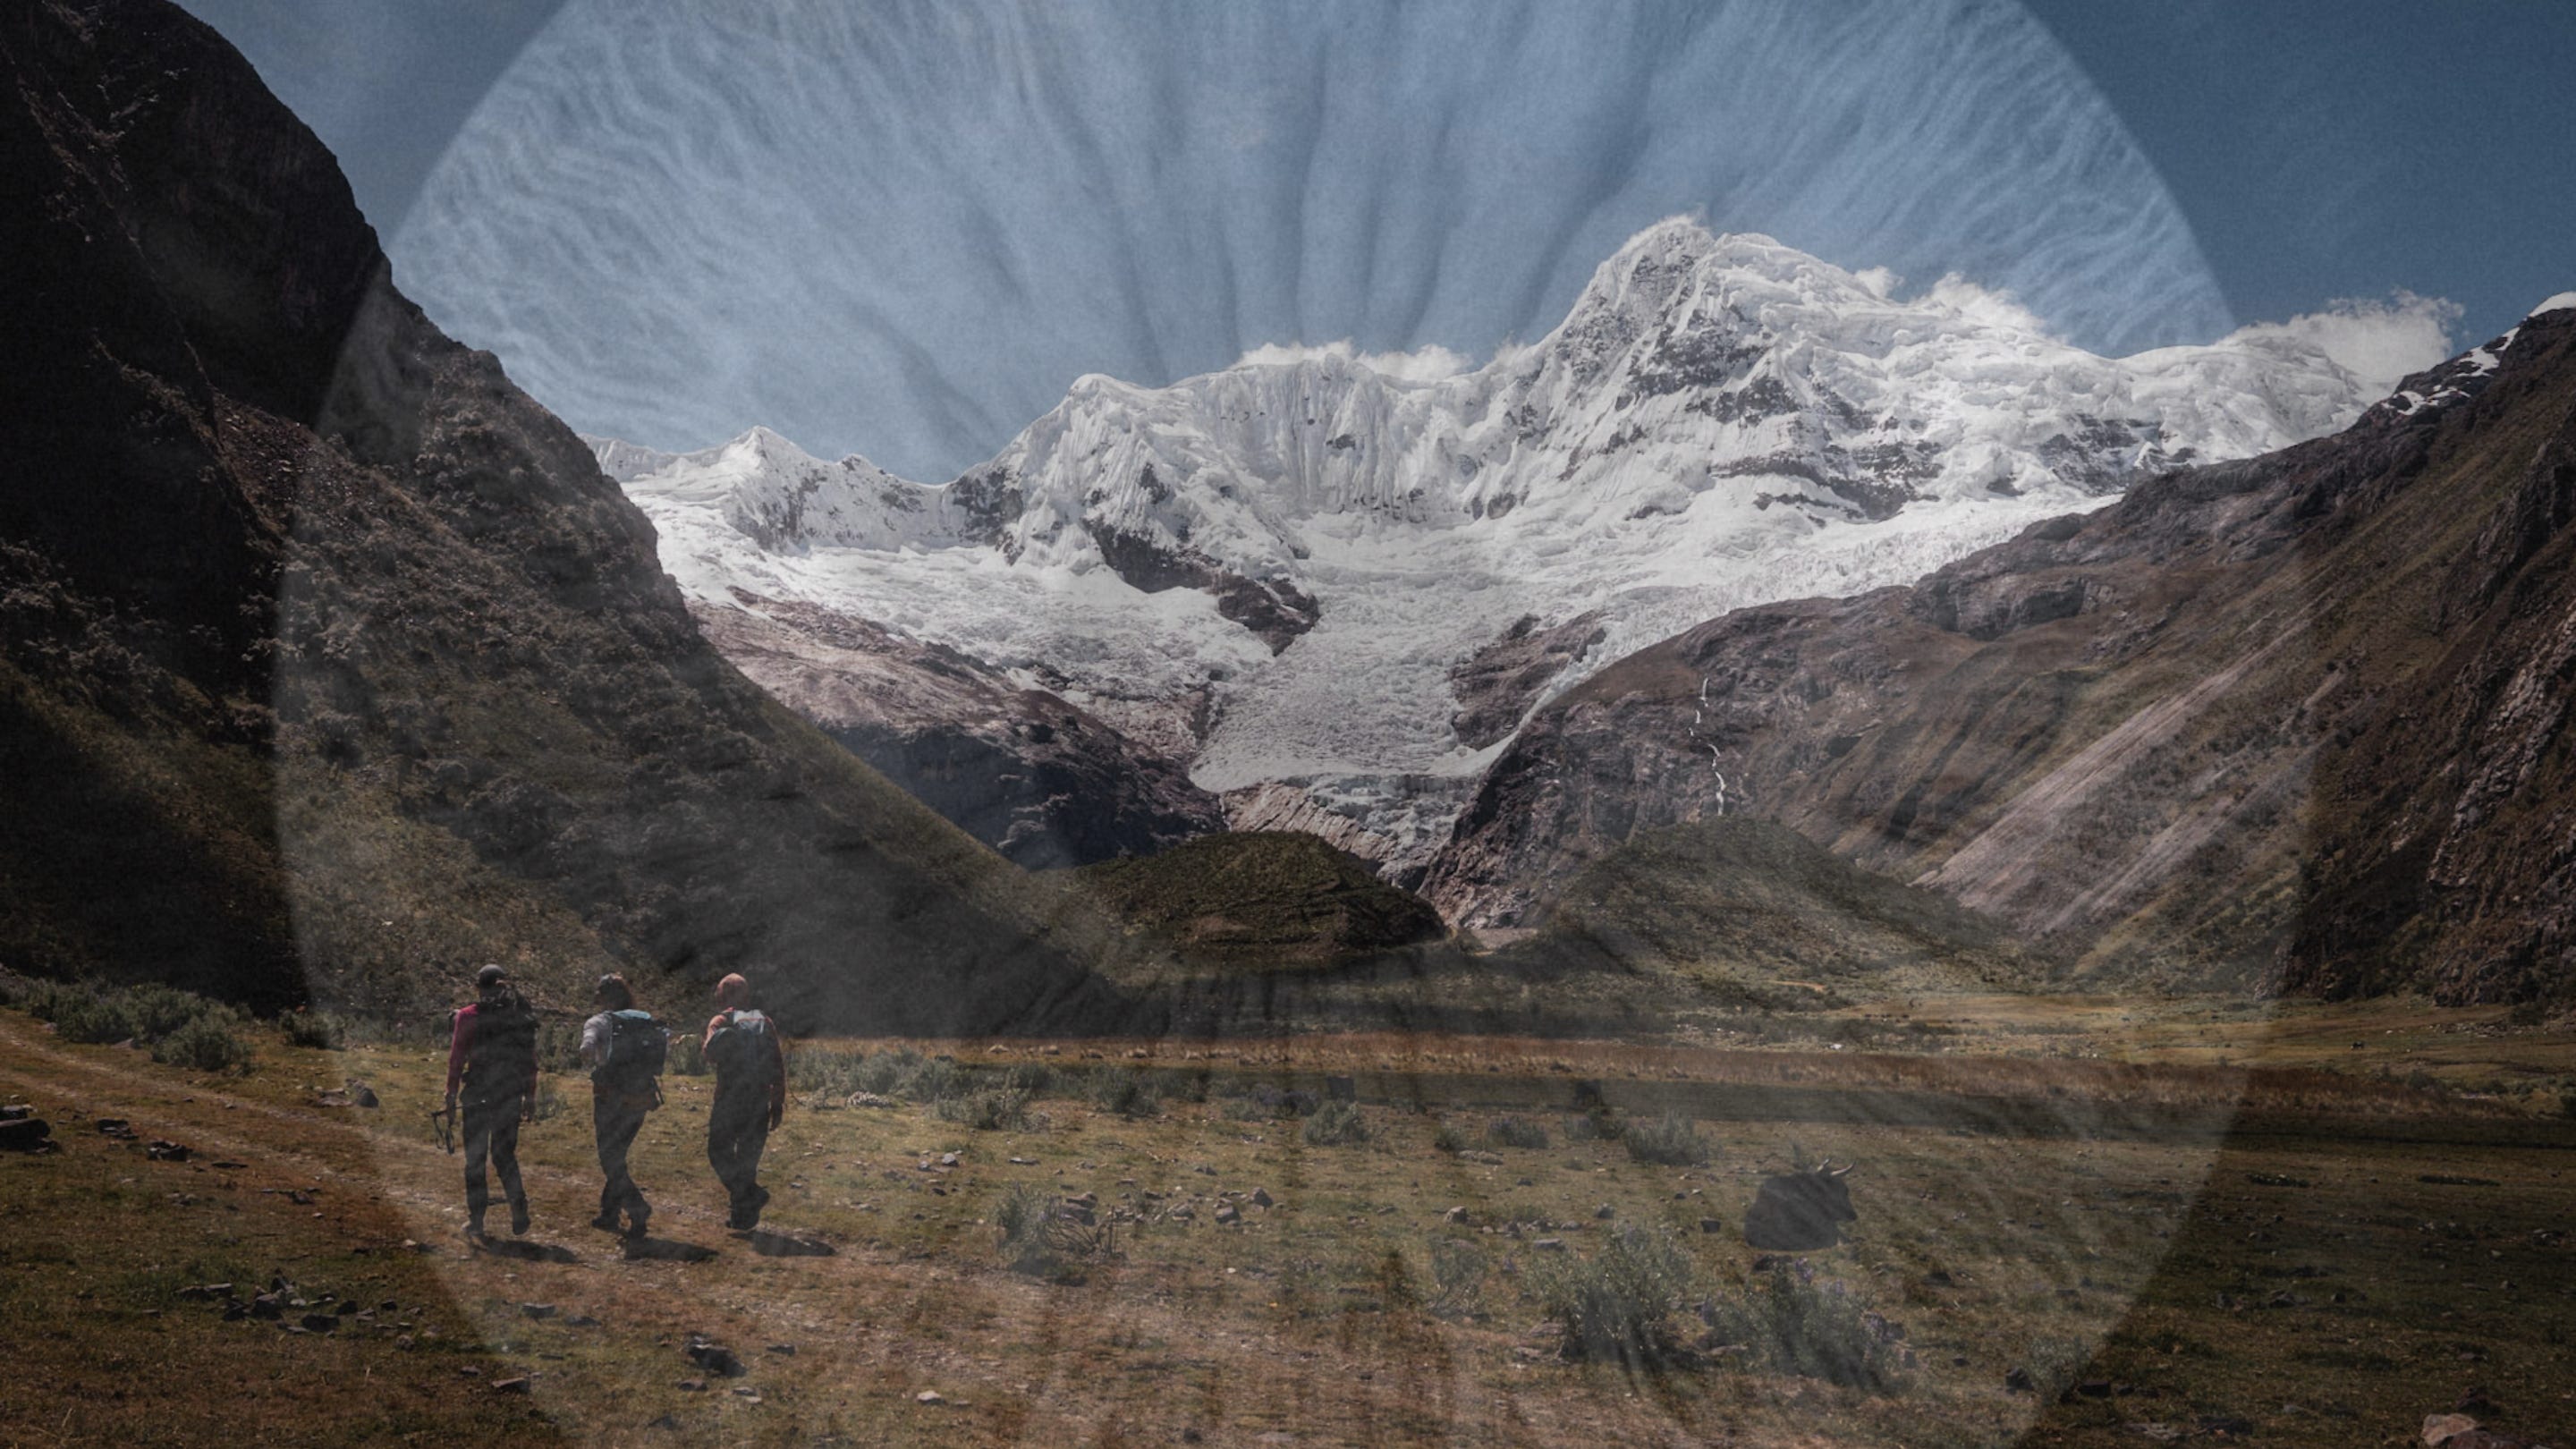
Here in Swedish Lapland, spring used to arrive as a sequence. The light returned. Snow softened along the roads. Rivers darkened, rose and finally broke free. Hydropower companies prepared for the rush. Tourism operators knew when winter would begin packing its bags. Nobody expected nature to arrive, but the order made sense. The year had manners.
That order is slipping.
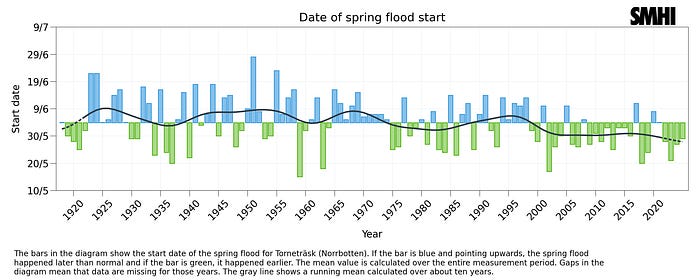
Sweden’s spring flood now begins around five to fifteen days earlier than it did near the start of the twentieth century. In more parts of the country, the flood is losing its clear beginning altogether, replaced by winter rain, interrupted melt and rivers that seem to change their minds halfway through the season. A river moving two weeks on the calendar sounds manageable until you remember how many plans were written around the old river.
We tend to describe civilization through its grand objects: cities, farms, dams, markets, parliaments, power grids. The less glamorous truth is that civilization runs on appointments. Rain comes within a familiar range. Snow melts in roughly the right month. Frost leaves before flowers become fragile. A storm described as rare remains rare long enough for the roof loan to be repaid.
Ancient rulers understood this. For centuries, officials used a stone gauge called a Nilometer to measure the Nile’s annual rise, estimate the coming harvest and calculate taxes. The state budget was a weather forecast carved into a column. Pharaohs had climate derivatives. They simply made theirs out of stone.
We’ve upgraded the instruments since then. That stone gauge turned into satellites, risk software, crop models, and spreadsheets with so many tabs they feel like a coping mechanism. But the bet hasn’t changed: we’re still counting on nature to behave roughly the way it used to: messy — but predictably messy.
And we can all feel that comfort is long gone.
Suppose you earn €3,000 one month and nothing the next. Your average monthly income is €1,500. The calculation is flawless. Your landlord may remain strangely attached to being paid every month.
Weather works the same way. Two places can share the same average temperature while living through completely different years. One gets a steady growing season. The other gets premature warmth, a killing frost, weeks without rain and then the entire month’s water in an afternoon. The average has blended the crime scene.
Europe received a memorable lesson in 1816. The eruption of Mount Tambora cooled the globe by roughly 1°C (1.8°F). The weather that followed brought cold, relentless rain, failed harvests, famine and surging food prices across Europe and North America. Near Lake Geneva, the same miserable summer trapped Mary Shelley and her companions indoors, where a ghost-story competition helped produce Frankenstein. Europe got a monster and a subsistence crisis. Only one became required reading.
Tambora doesn’t offer a one-degree-equals-famine formula. It was a volcanic shock with its own geography and timing. Its larger lesson sits in the sequence: the average arrived through mismatches and badly timed rain.
Modern infrastructure spent most of the twentieth century pretending those sequences came from a dependable deck of cards. Engineers called the assumption stationarity: rivers, rainfall and storms could bounce around, but the statistical envelope holding them would stay put. Study the past long enough and you could estimate the future. A flood expected once in a century became a pipe diameter, a bridge height and a line in an insurance contract.
In 2008, a group of water scientists published a paper saying that “stationarity is dead.” But the engineering profession kept pouring concrete.
Consider the humble storm drain, one of civilization’s least charismatic achievements until brown water starts climbing the stairs. Engineers size drains using curves that estimate how hard rain will fall, how long it will last and how often it should return. A study of nonstationary rainfall found that old methods could understate some intense rainfall estimates by as much as 60 percent. Build a pipe for ten buckets and sixteen arrive. The pipe performs exactly as designed for a climate that has left the building.
Farmers get the same treatment. In spring 2026, parts of Europe moved through persistent rainfall deficits and late frosts that hit rapeseed during flowering. Other regions stayed too cool and wet to sow on time.
So an Europe-wide crop report can still call the outlook “fair” because, on average, things might look okay somewhere on the map. But plants don’t live off the year’s “mean temperature.” They live through the week — through that one warm spell, that one late frost, that one dry stretch that hits at exactly the wrong time.
The modern grain trade was built around a comforting form of diversification. A drought in one breadbasket could be covered by a good harvest elsewhere. Russia struggles, buy from Canada. Brazil dries out, Argentina may pick up part of the gap. Global supply survives because failures usually take turns, one region struggling while another fills part of the gap.
That’s the whole business model.
A 2026 study found that a record-breaking global drought across maize-producing regions can emerge without any single region suffering its own record-breaking event. Several moderately severe droughts arriving together can produce a global shock that shatters the previous record. Under intermediate emissions, the models estimated a roughly even chance of at least one such event before the century ends. The pantry empties because every supermarket runs low in the same week.
And our models may flatter us. Researchers comparing climate and crop simulations with observed meandering jet-stream patterns found that models reproduced the atmospheric pattern reasonably well while understating the damaging weather at the surface and the resulting risk of synchronized low yields. The jet stream waves. The model nods politely. The wheat has another opinion.
This is where the obsession with long-term averages begins to look less scientific and more convenient. Average temperature fits neatly into a graph. Variability arrives by the day and through the sequence of seasons: if heat followed flowering, if rain arrived before planting or after harvest, if drought hit one exporter or four.
A study covering four decades and more than 1,500 regions found that greater day-to-day temperature variability reduced economic growth independently of changes in annual average temperature. That makes sense once GDP steps out of the spreadsheet. A construction crew loses hours. Electricity demand jumps. A factory overheats. Workers sleep badly. Fruit trees wake early and meet frost with their flowers open.
More recent damage projections reached the same broad conclusion from another direction: annual mean temperature leaves out rainfall changes, extremes and swings between years. Add those back and the economic bill grows, especially in poorer regions where a bad season has fewer cushions.
The Bank for International Settlements called it a “green swan” report and warned that climate risk carries radical uncertainty and chain reactions in conditions that backward-looking risk tools can’t capture. The rear-view mirror remains beautifully polished. The road has moved.
Then the timing changes and efficiency reveals its full name: dependence on everything arriving as promised.
“Tipping point” may be the most badly illustrated phrase in climate science. You have seen the diagram. A ball rolls toward a cliff. A neat arrow points downward. On one side, the old climate. On the other, the new one.
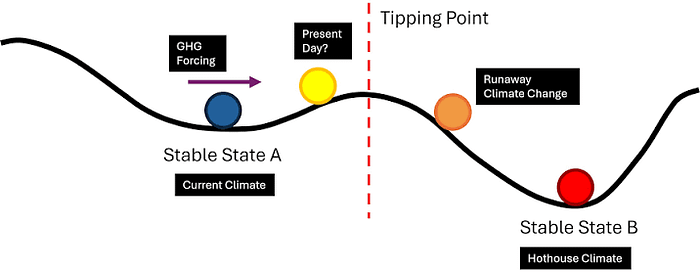
Earth’s large systems have declined the branding.
An ice sheet, forest or ocean circulation can cross a threshold and then spend years, decades or centuries reorganizing. The route there may be the period societies find hardest to survive because the old probabilities can fail before a new pattern becomes legible.
Scientists have long known that complex systems can wobble as they approach a threshold. They recover more slowly after a disturbance. Variability can rise. Some systems begin flickering between states. Researchers have found these warning patterns in models and lakes, along with other living systems, though detecting them in the full climate remains difficult.
Think of a supermarket trolley, like most that have that one wheel, impossible to contain. Early on, you bump it and it straightens. Later, the same bump leaves the trolley shuddering halfway down the aisle, veering toward the wine while you are grabbing something else. The wheel gets the incident report. The wobble ruins the shopping first.
Science has spent years estimating tipping thresholds and eventual outcomes for the Greenland ice sheet, the Amazon and the Atlantic circulation. It has done far less work on the weather produced while those systems reorganize. This transition could bring rising volatility in meltwater, ocean mixing, sea ice and atmospheric circulation, yet climate physics and economics still lack a coherent framework for studying weather inside a tipping transition. They can’t yet tell us that every tipping element will generate the same kind of volatility, or map every regional consequence decade by decade.
The scary part is what we don’t know yet. Our insurance models, engineering standards, and financial forecasts all want neat odds: how likely is a flood, a drought, a storm? But we’re nudging the planet into conditions we haven’t seen before. That means the old odds and the tools we rely on can start giving us false confidence.
Policy still loves endpoints. Net zero by 2050. Warming in 2100. Sea level at the end of the century. Neat, but they suit speeches because most of the people making them won’t be repairing a culvert in 2087.
A farmer needs to know whether the frost returns after the blossom. An engineer needs a rainfall curve that stays useful longer than the debt financing the tunnel. An insurer needs the next thirty years to resemble some dataset in its possession. A pension fund needs the assets under your retirement account to remain valuable while you grow old enough to use it.
So the framework has to change. Risk assessments need to track volatility, sequence and correlation alongside averages. Infrastructure needs margins for probabilities that keep moving. Food security needs reserves and diversity that look inefficient on calm days. Finance needs to admit that uncertainty can’t always be converted into a prettier model.

And it all starts with decarbonization, which has to happen inside this instability.
For thousands of years, we’ve had something like a free public service: a fairly steady climate. It never showed up on any budget or balance sheet, but we depended on it anyway and built everything on top of that reliability: farms and cities, mortgages and insurance, even retirement plans.
When this era ends, the future will get the headline and the name. But the messy in-between period (the shift from “old normal” to “new normal”) is what will cost us most.
On the wall here in Lapland, the calendar still has twelve tidy pages. Outside, the river isn’t following the schedule anymore.
May the northern lights guide you,
M.
Comments
Nothing yet. Say the first thing.
Sign in to join the conversation.