
You’ll close half your position tonight, call it risk management, and buy it back Thursday about 4-5% higher.
I’ve been long Nvidia 44 days. It’s on my public record right now, open, in profit, targeting 1.88R, and it’ll still be open when the numbers land. Go and check the counter before I’ve written a word about why.
Wednesday.
Nvidia reports second-quarter results after the close tonight. It’s on their own investor calendar, 26 August, 2:00 PM Pacific. Not a rumour, not a whisper number, a date they published weeks ago.
Half the market has spent this week deciding what to do about it.
I decided 44 days ago.
The trend gate passed in July.
The momentum gate passed in July.
The risk gate sized it so a bad night couldn’t do real damage.
Nothing announced after the bell tonight changes any of those three answers, so nothing changes about the position.
Nvidia publishes Q2 FY27 numbers at 2:00 PM Pacific, which is 10pm here. The company listed the date on its investor relations events page weeks ago, so anyone claiming an edge on the timing is selling something.
Yesterday it closed at 213.05. That’s about 10% under the May high of 236.54 and roughly 30% above the March low of 164.27. It’s sitting above its 50-day average and just under its 20-day.
That’s the whole setup. A stock in an uptrend, mid-range, with a scheduled event tonight.
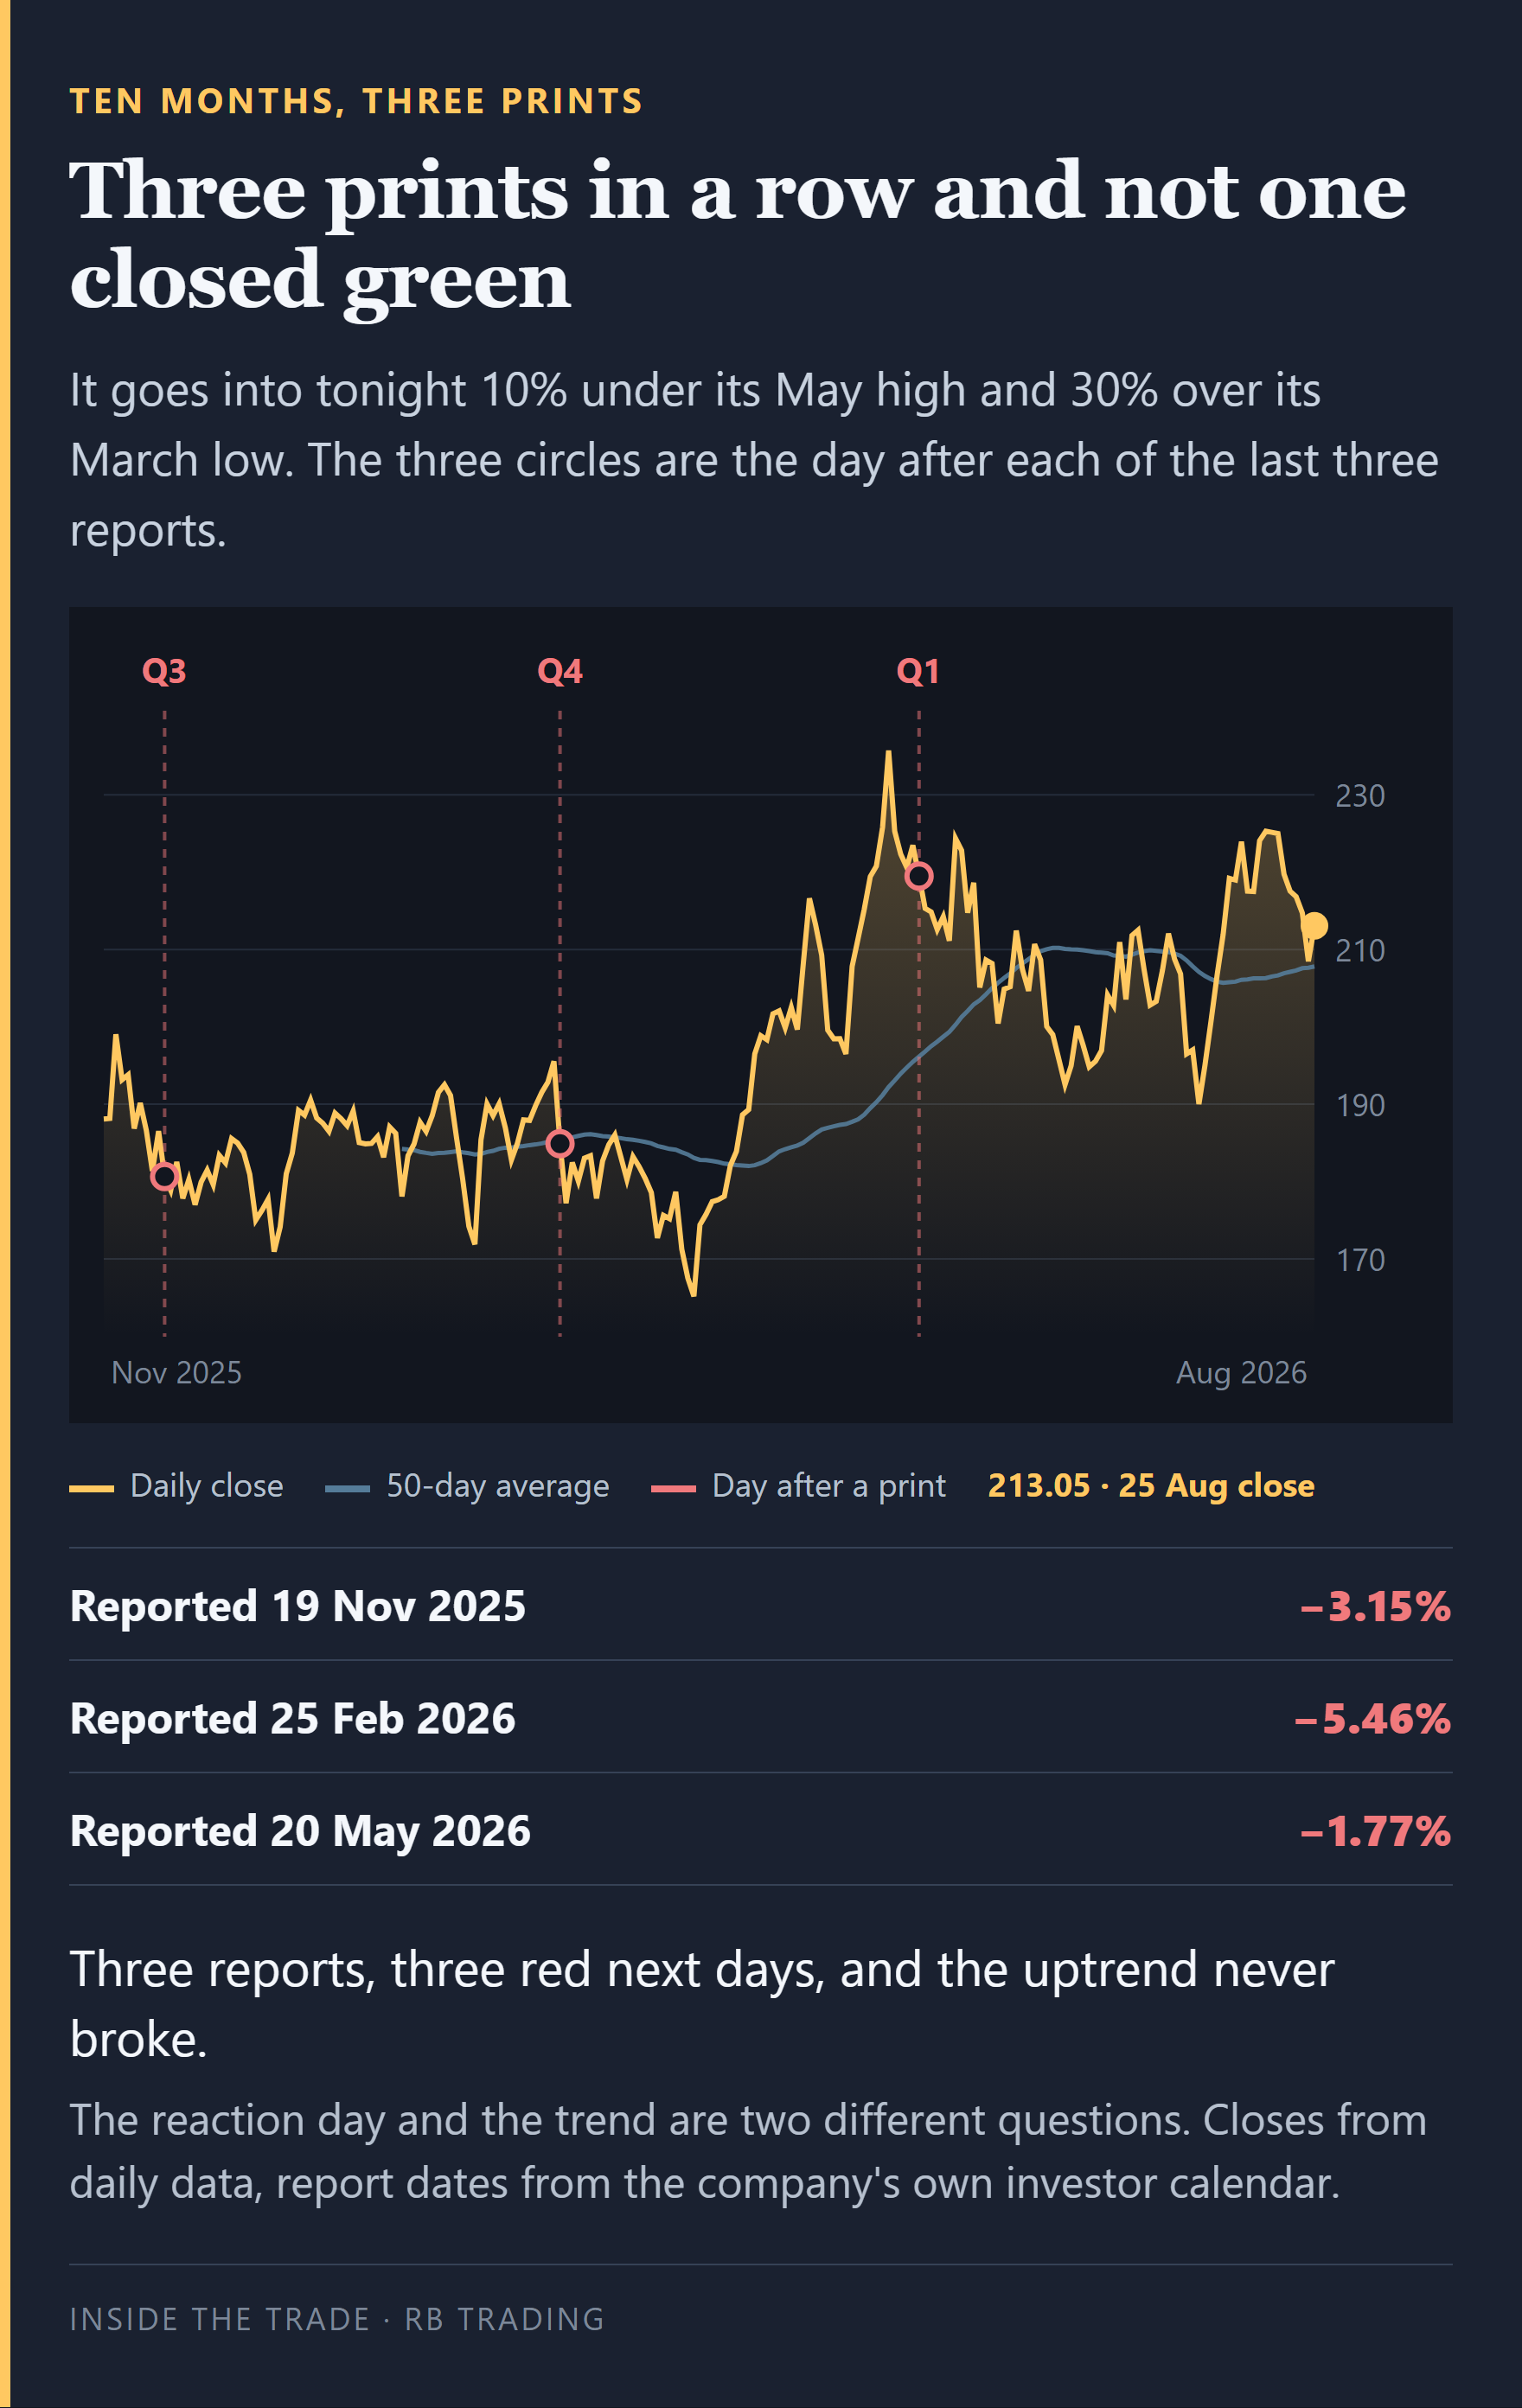
Three reports, three red next days, and the trend never broke.
Now the part that never makes it into the “earnings are a catalyst” posts.
The last three times this company reported, the stock fell the next day. Every time. Down 3.15% after the November report, down 5.46% after February, down 1.77% after May.
Three for three, all red.
And it’s up 30% from the March low anyway.
I get this reply every quarter and it’s fair, so let’s take it seriously.
I’m not predicting tonight. I’ve no idea whether the number beats or misses, and neither does anyone posting a price target about it this afternoon. If holding this position depended on guessing the print right, I wouldn’t hold it.
It doesn’t depend on that.
The reaction day and the trend are two different questions, and people keep answering the first when they’re being asked the second. A print moves the stock for a day or two. What decides whether the position pays is where it sits three months later, and three months later has been settled by the trend every time so far.
So take the same three prints and follow them forward instead of stopping at the reaction.
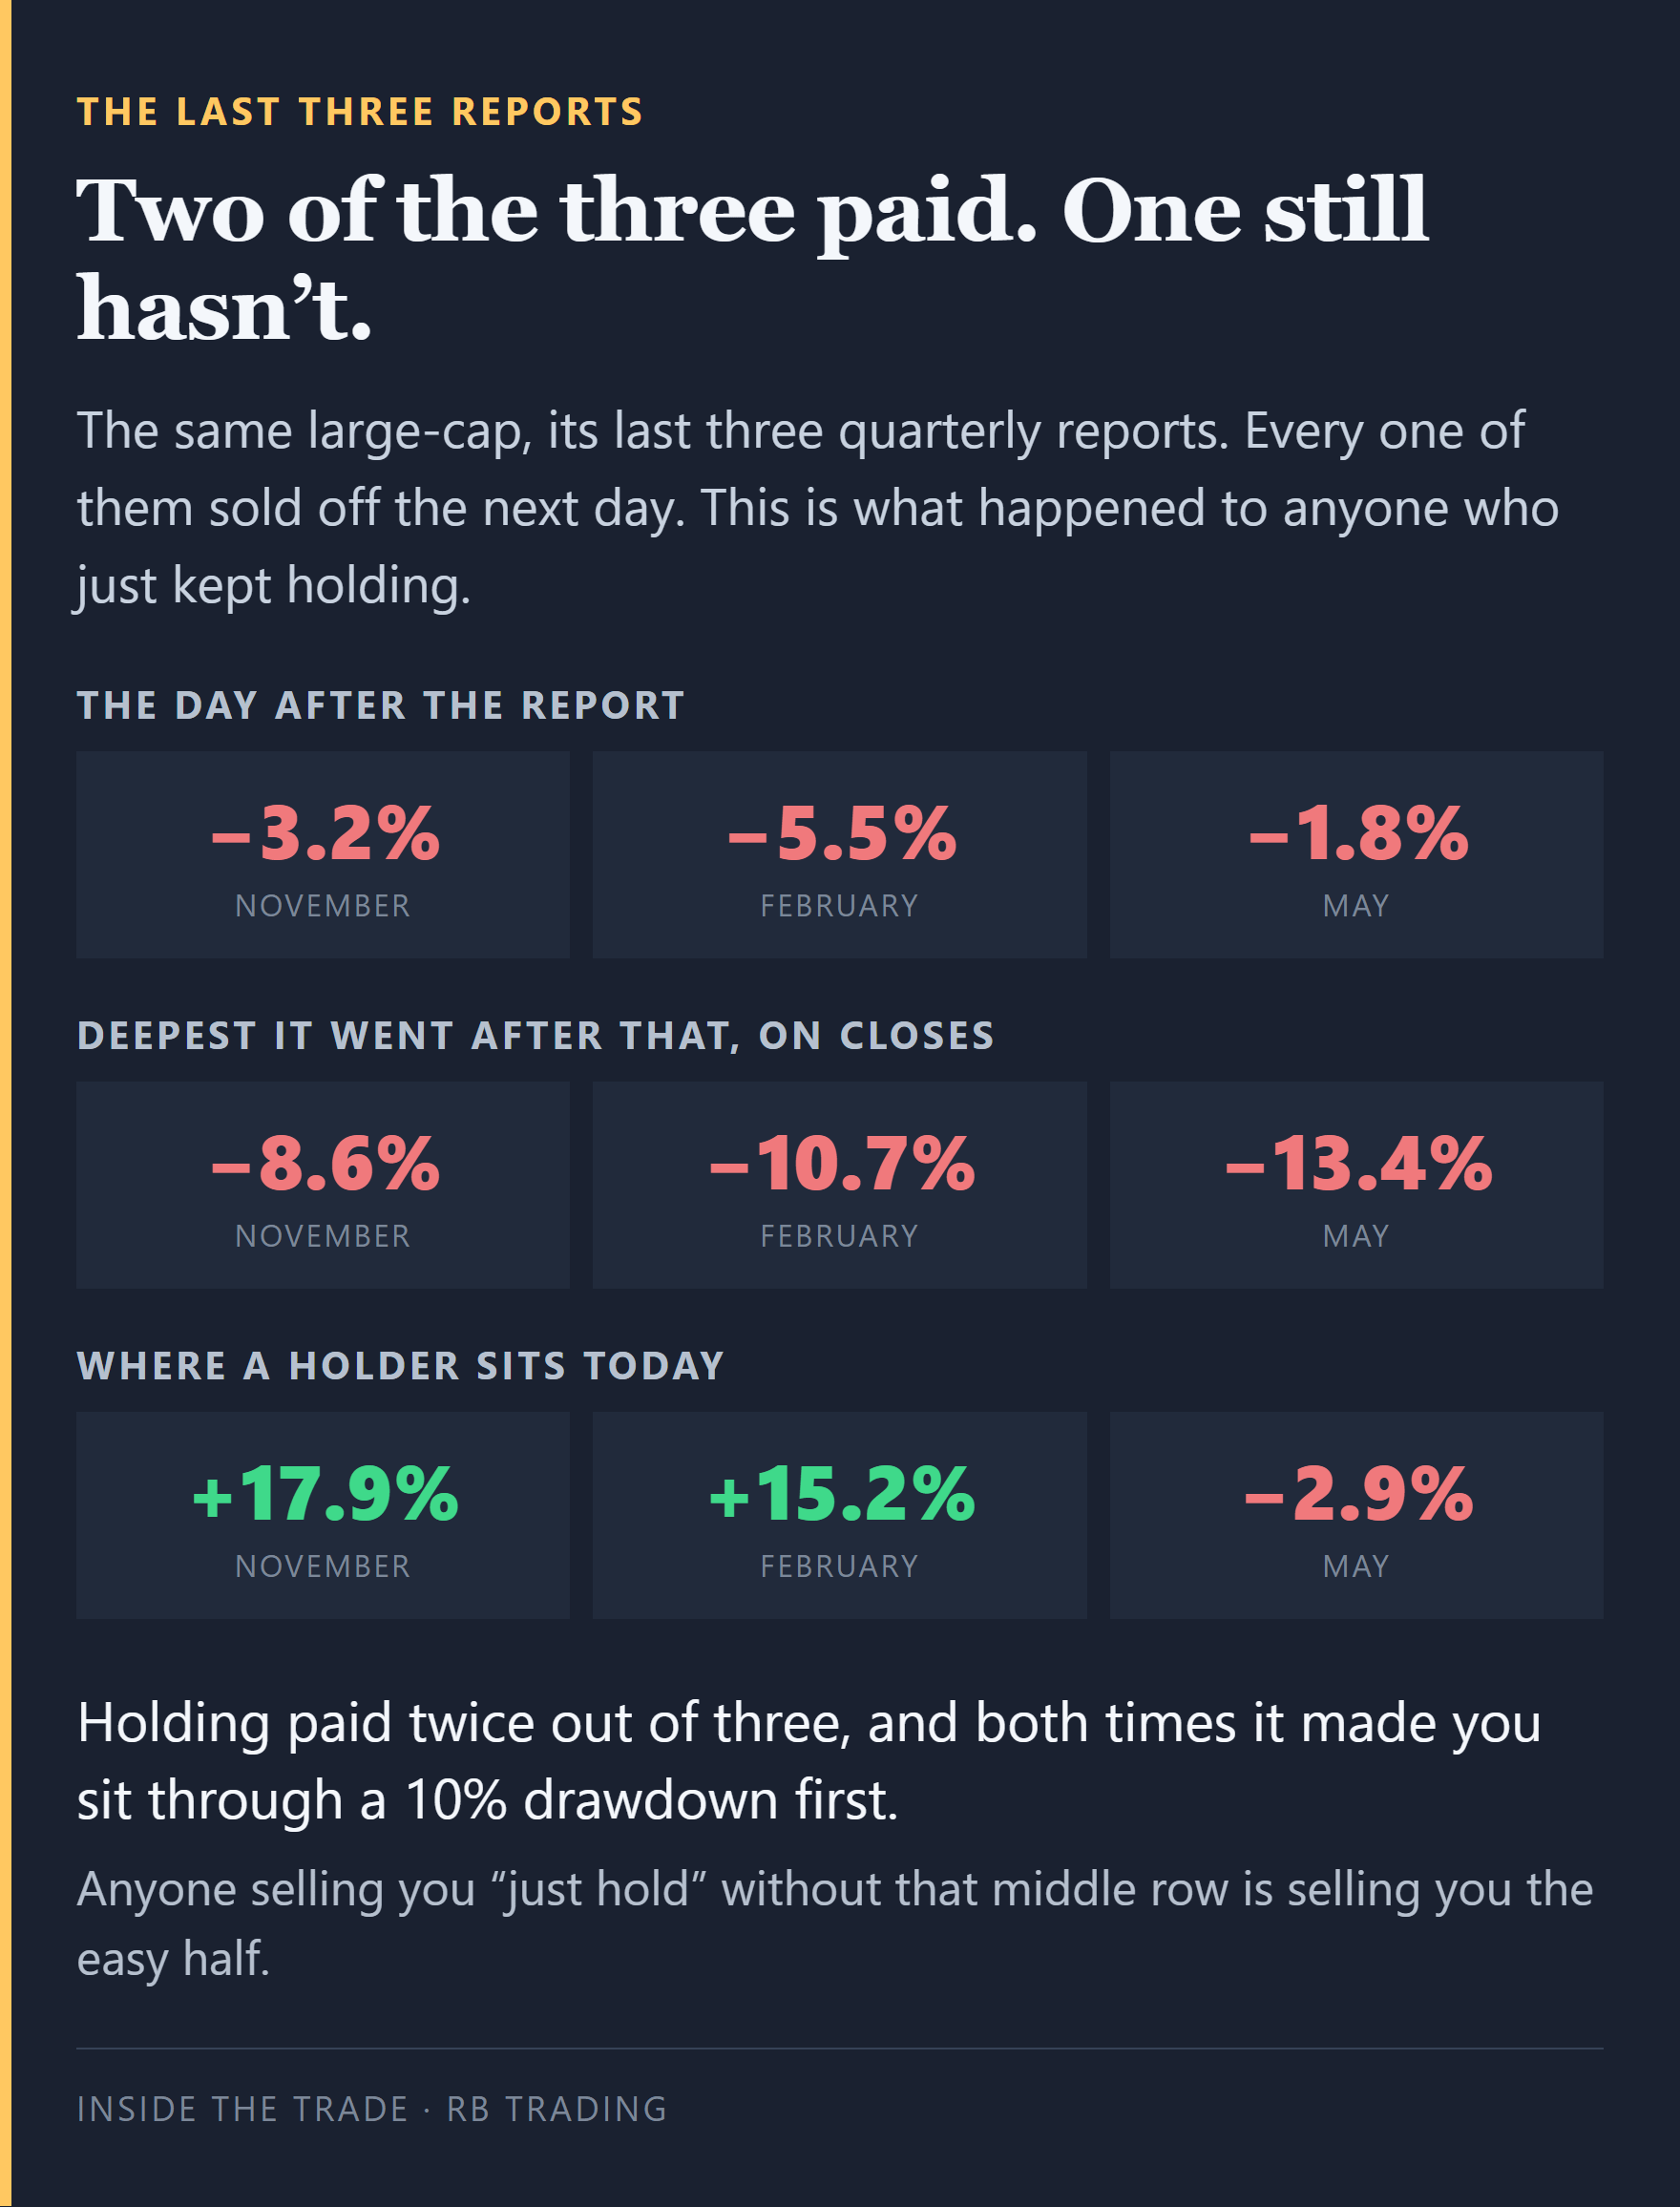
Two of the three paid, and both made you sit through a 10% drawdown first.
Two of those three are up double digits for anyone who held. One is still underwater three months on, and it’s in the letter because a card with three green numbers on it would be a lie.
That May print is the honest one. The stock closed at 219.51 the day after, went to 190.01 by late July, a 13.4% drawdown, and it’s still 2.9% below where it was. Anyone who bought that reaction and called it long-term investing has had a rough summer.
So holding isn’t free. It costs you drawdowns like that, twice in nine months. And if a 13% drawdown would make you sell at the worst possible moment, the position’s too big and the risk gate already failed before the print ever showed up.
“I’ll just buy it after the gap, when it’s clear”
This one costs more than the coin-flip objection and almost nobody counts it.
Take the November report. The stock closed at 186.52 the night before. Next morning it gapped up 5% and opened at 195.95, which felt like confirmation. The news was good. The chart was green. Everything the flincher had been waiting for turned up at once.
By lunchtime it was trading at 179.85, which is 8.2% below that open. It closed the day down 3.15%.
Nine months on, the person who held through the print is up 14.2%. The person who closed the night before and bought the gap-up open is up 8.7%.
That’s 5.5 points of return handed over to feel calmer for one evening.
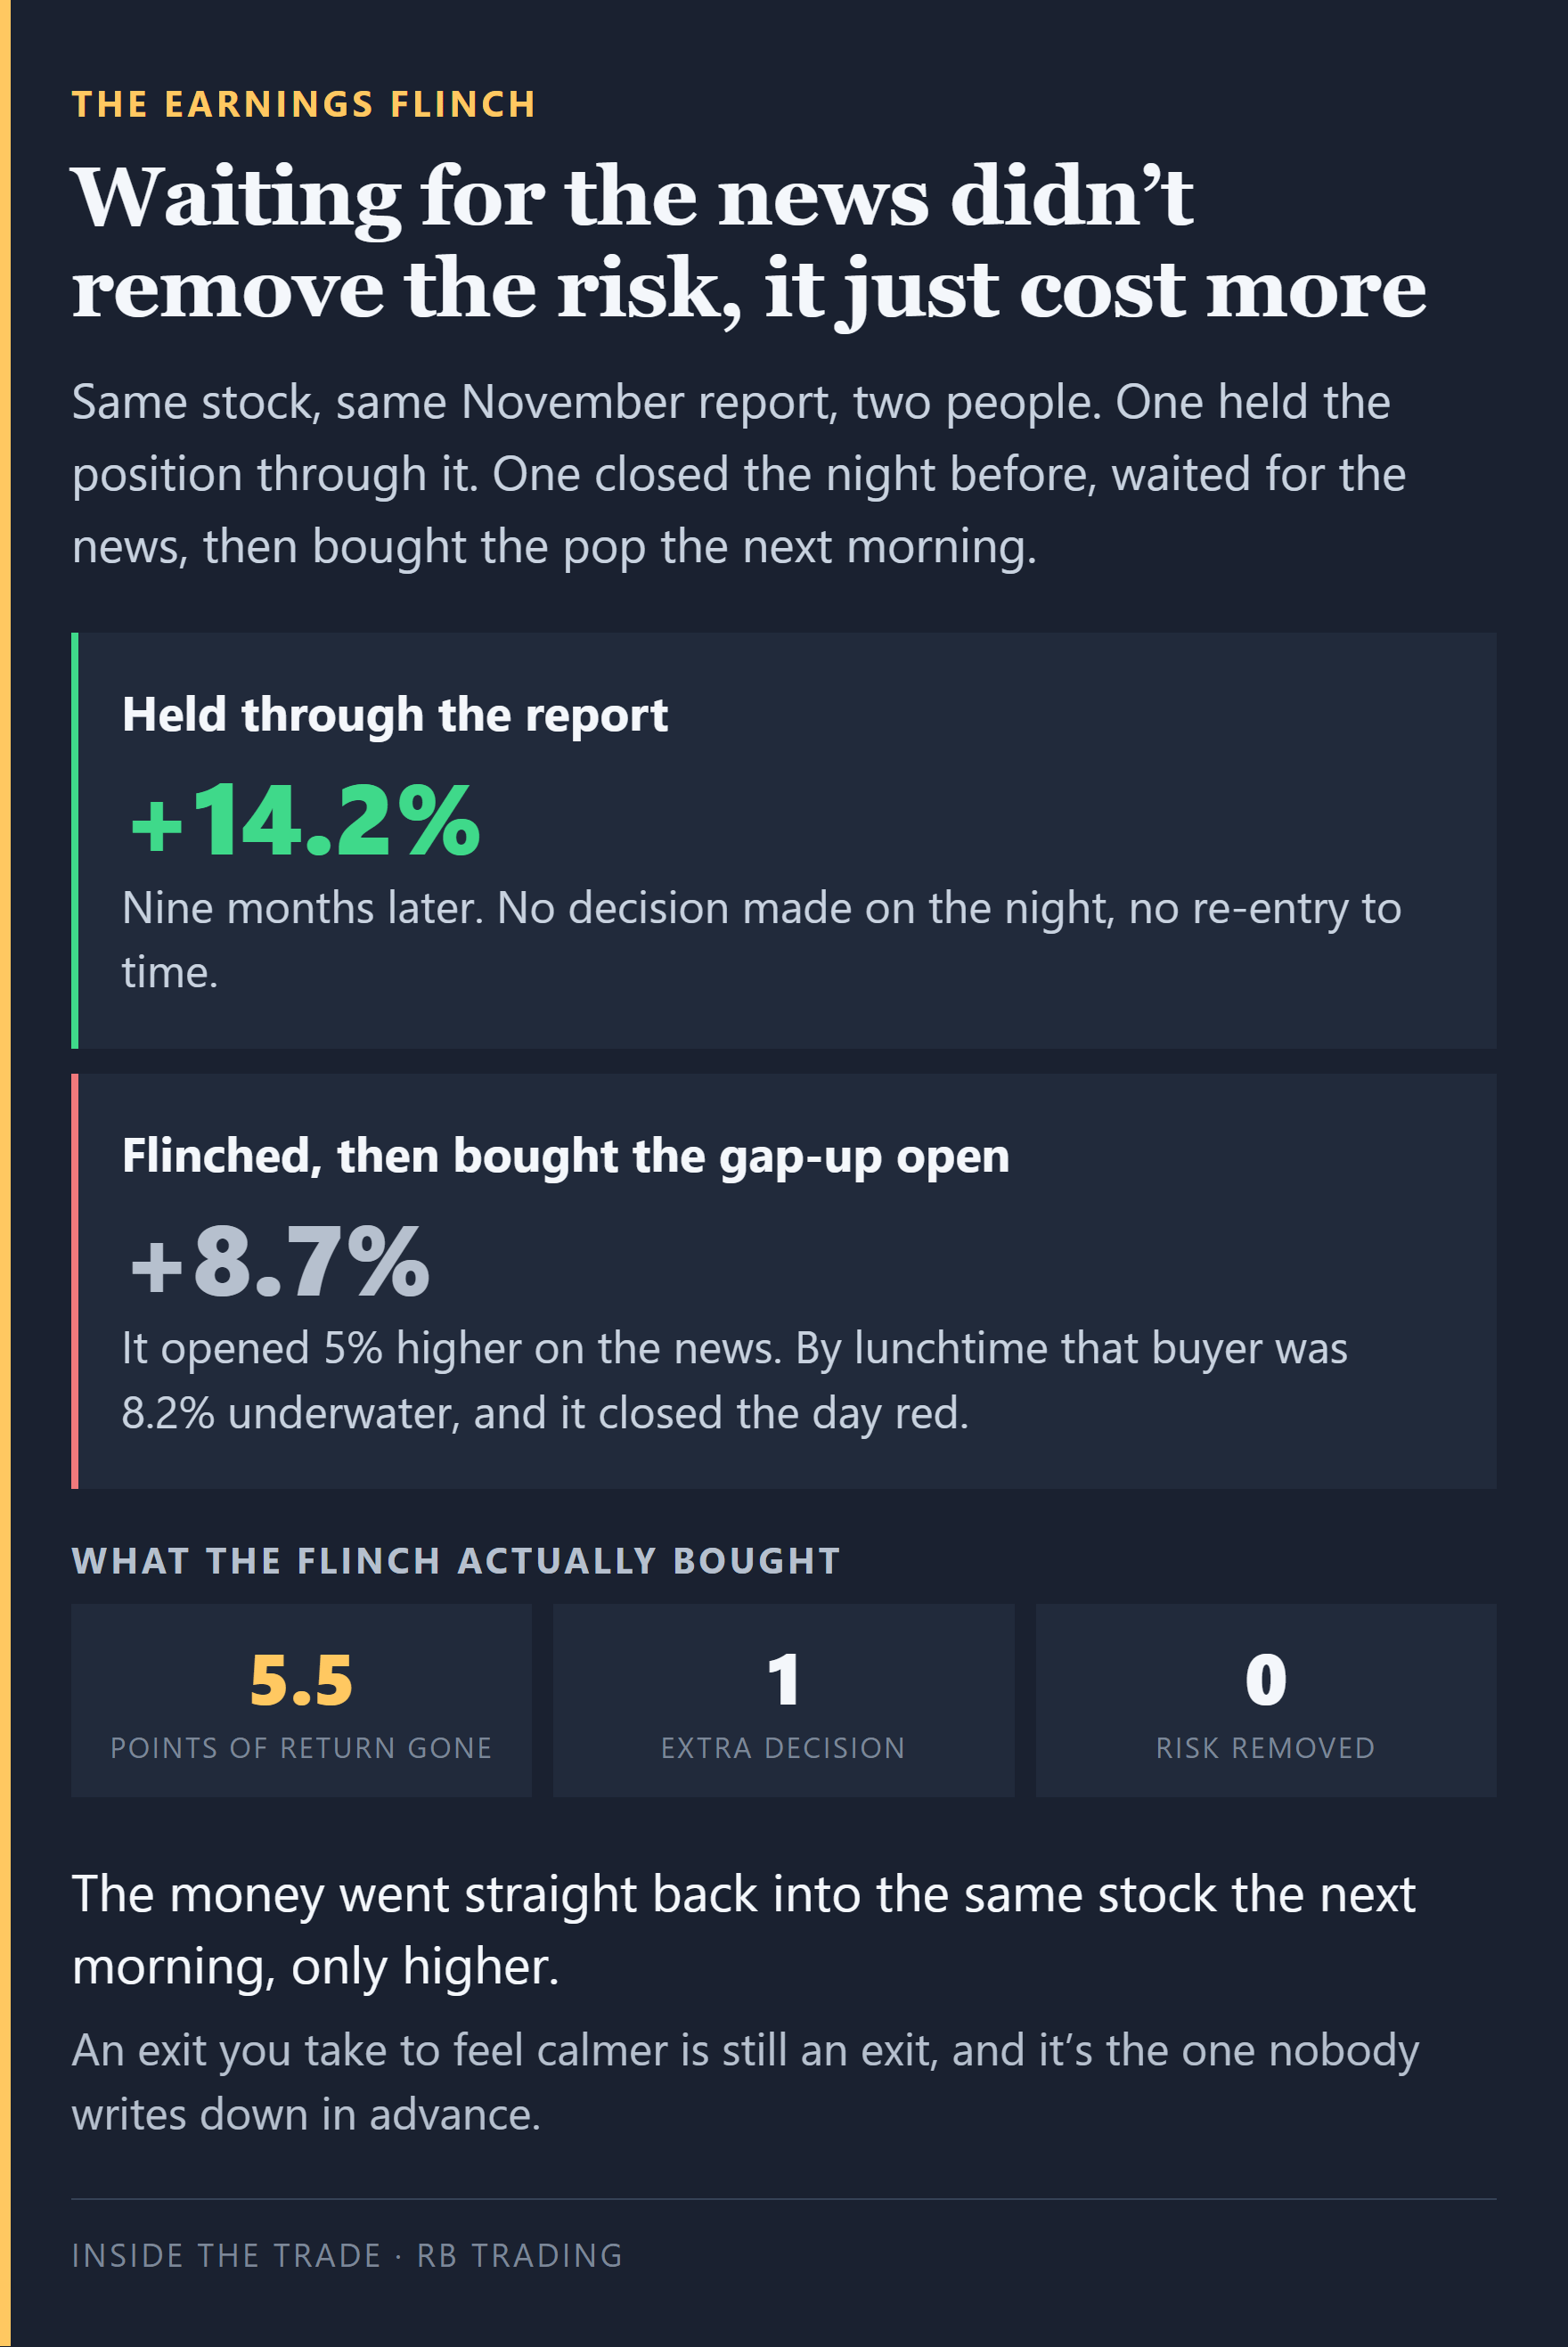
Waiting for the news to clear cost 5.5 points of return and removed no risk at all.
I’m calling this the earnings flinch, because it isn’t a strategy and it doesn’t behave like one. It’s an exit you take to stop feeling something, and it’s the only exit in the whole trade nobody writes down in advance. Your stop is planned. Your target is planned. The flinch gets improvised at 8pm with your thumb over the sell button.
Stepping aside for the event doesn’t remove the risk. It moves it to a worse price and hands you a second decision you now have to get right as well.
“But it stopped you out last month, why are you back in it?”
Fair, and I want to answer this properly, because two of the four setups that crossed this week are re-entries and one of them stopped me out eight days before I called it again.
DLO. Entry 15.00, stop 13.72, target 17.51. Stopped on 18 August for a full minus 1R. That’s on my public record, it isn’t tidied away, you can open the page and find it in the closed-trades table.
Eight days later I put it back on the board with a new trigger. Higher than the entry that just failed, not lower. The number’s below the break in this letter, but the direction is the part that teaches.
That’s the whole answer. Averaging down is buying more of something while it proves you wrong. A second entry at a higher trigger says the first attempt was early, the thesis is intact, and price has to come and prove it before I’ll pay again. If it never reaches that level I never get filled, and being wrong the first time costs me nothing extra.
It crossed on Monday.
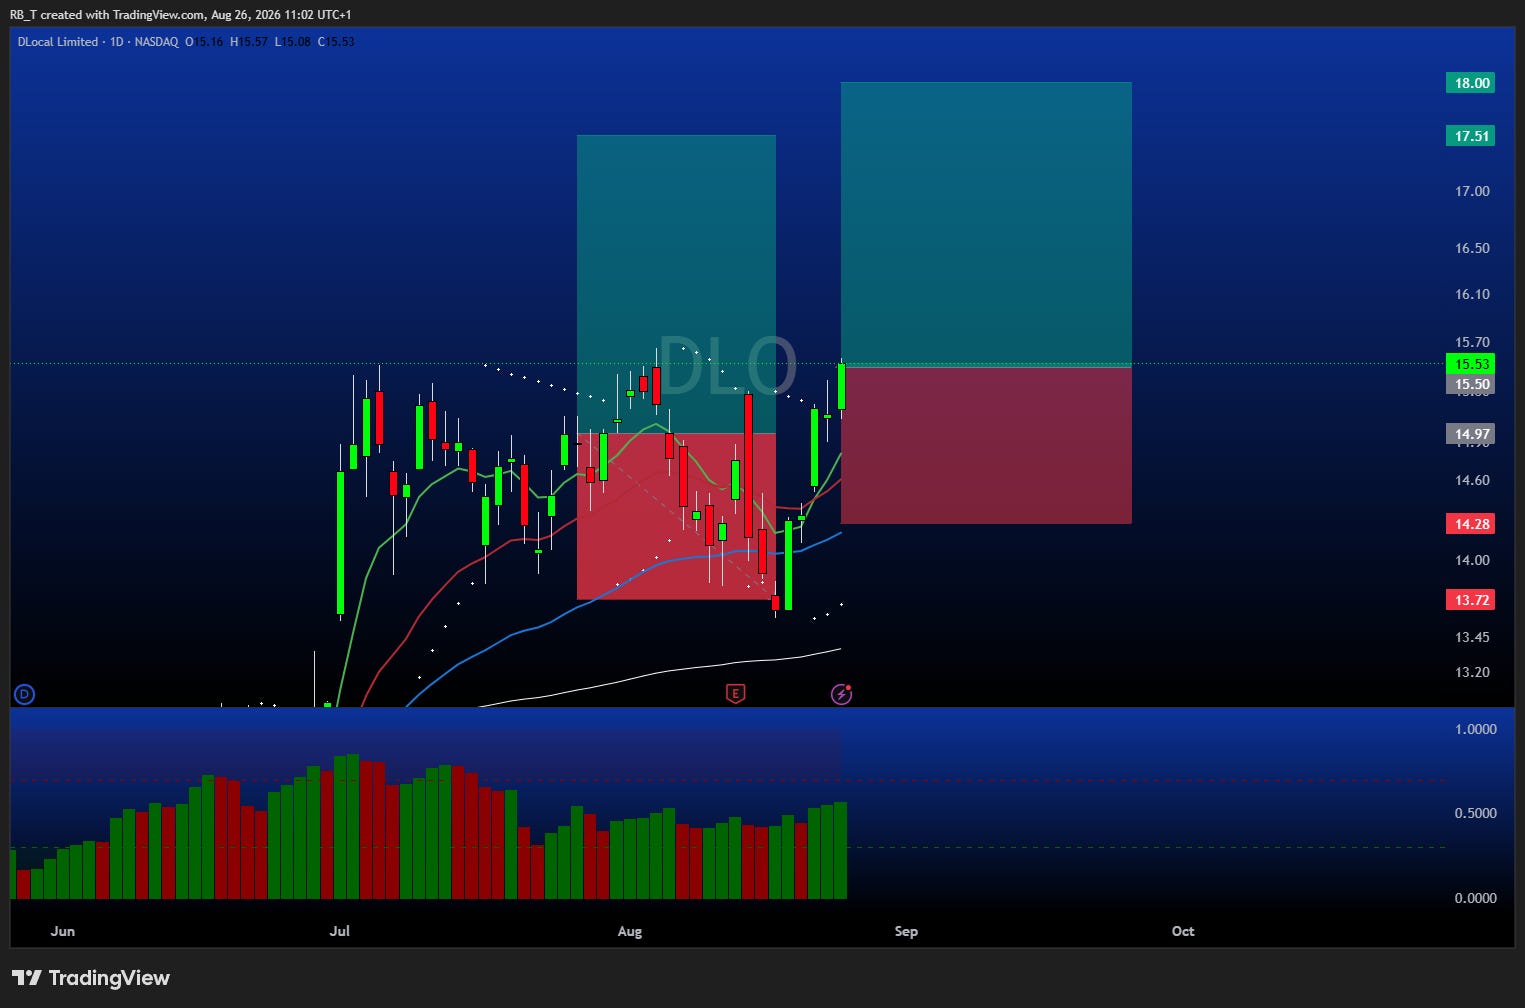
The stop came off and the new trigger went in higher, not lower.
BEAM is the same argument with a longer history and it’s less flattering. I’ve called that name four times. December 2025, target hit, plus 2.02R. February, stopped, minus 1R. July, stopped, minus 1R. It crossed again on Monday and it’s the best performer of the four this week.
One win, two losses, and the fourth is live. That’s what a real book looks like on a name you keep going back to.
If it read win, win, win, you should assume I was editing.
Risk on or off. On, quietly. Four separate setups crossed their triggers this week across two different books, and two of them are small-cap squeeze names rather than megacaps. Money moving down the cap scale while everyone stares at one chip company isn’t a defensive tape.
Where the crowd is. Tonight. Positioning across the whole AI complex has bunched around one scheduled event, which is exactly the trade I’m not adding to. My position was on before the crowd arrived and I’m not increasing it into the thing they’re all watching.
The overlooked corner. The squeeze book. Nobody’s writing threads about small-cap biotech and fintech this week, and that’s usually when those setups get filled at sensible prices instead of chased.
The 3-Gate verdict. Trend gate open, momentum mixed, risk gate tight. Normal size on names that triggered on their own merit, no new size on anything going into a scheduled event. If you take one instruction out of this letter, take the second half of that sentence.
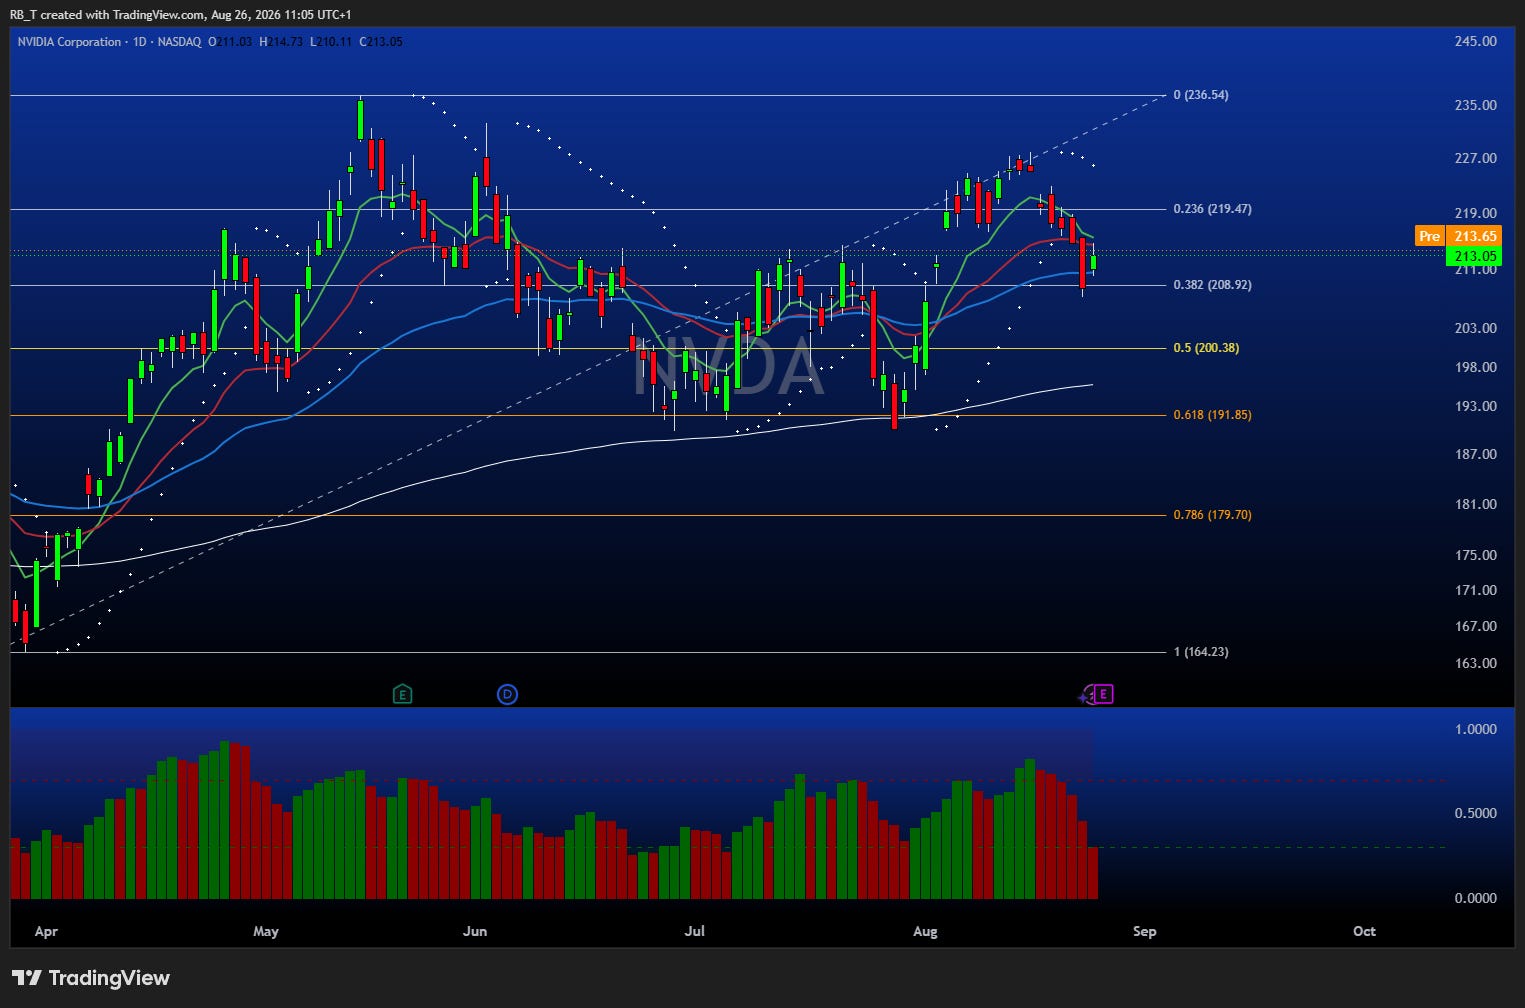
44 days in and the only thing that’s changed is the calendar.
Unusual week. Not a single trade closed since the last letter, so there’s no scoreboard to run and I’m not padding one by re-running wins you already read about.
What happened instead is four setups crossed their triggers.
→ AMZN 0.00%↑ swing setups, triggered, roughly flat since it crossed. Second time on this name. The first ran from 234.95 to 273.85 for plus 2.19R and closed on 4 August.
→ AMD 0.00%↑ swing setups, triggered, up about 1.8% since. First call on this one.
→ DLO 0.00%↑ short squeeze, triggered, barely off the line so far. The re-entry above.
→ BEAM 0.00%↑ short squeeze, triggered, up about 6.1% since it crossed. Fourth call, history above.
Free readers: the journal is 30% off with code RBT30 at
Two of those, DLO and BEAM, went out to members in last Wednesday’s letter with the full trigger, stop and target on them, a week before either moved. That’s the bit I’d point at if you’re working out whether any of this is real. Substack stamps the date, not me, and the post is still sitting there, locked.
For where all of it sits: the closed record is +51.8R across 86 trades at a profit factor of 2.46, average winner +1.90R against an average loser of minus 0.88R, and no single loss worse than minus 1.01R. Nine months, every loser left in. It’s all on the record page: https://tradedesk.rbtrading.site/track-record
Drop your confessions here, plus everything else I’ve got running, it’s all in one place:
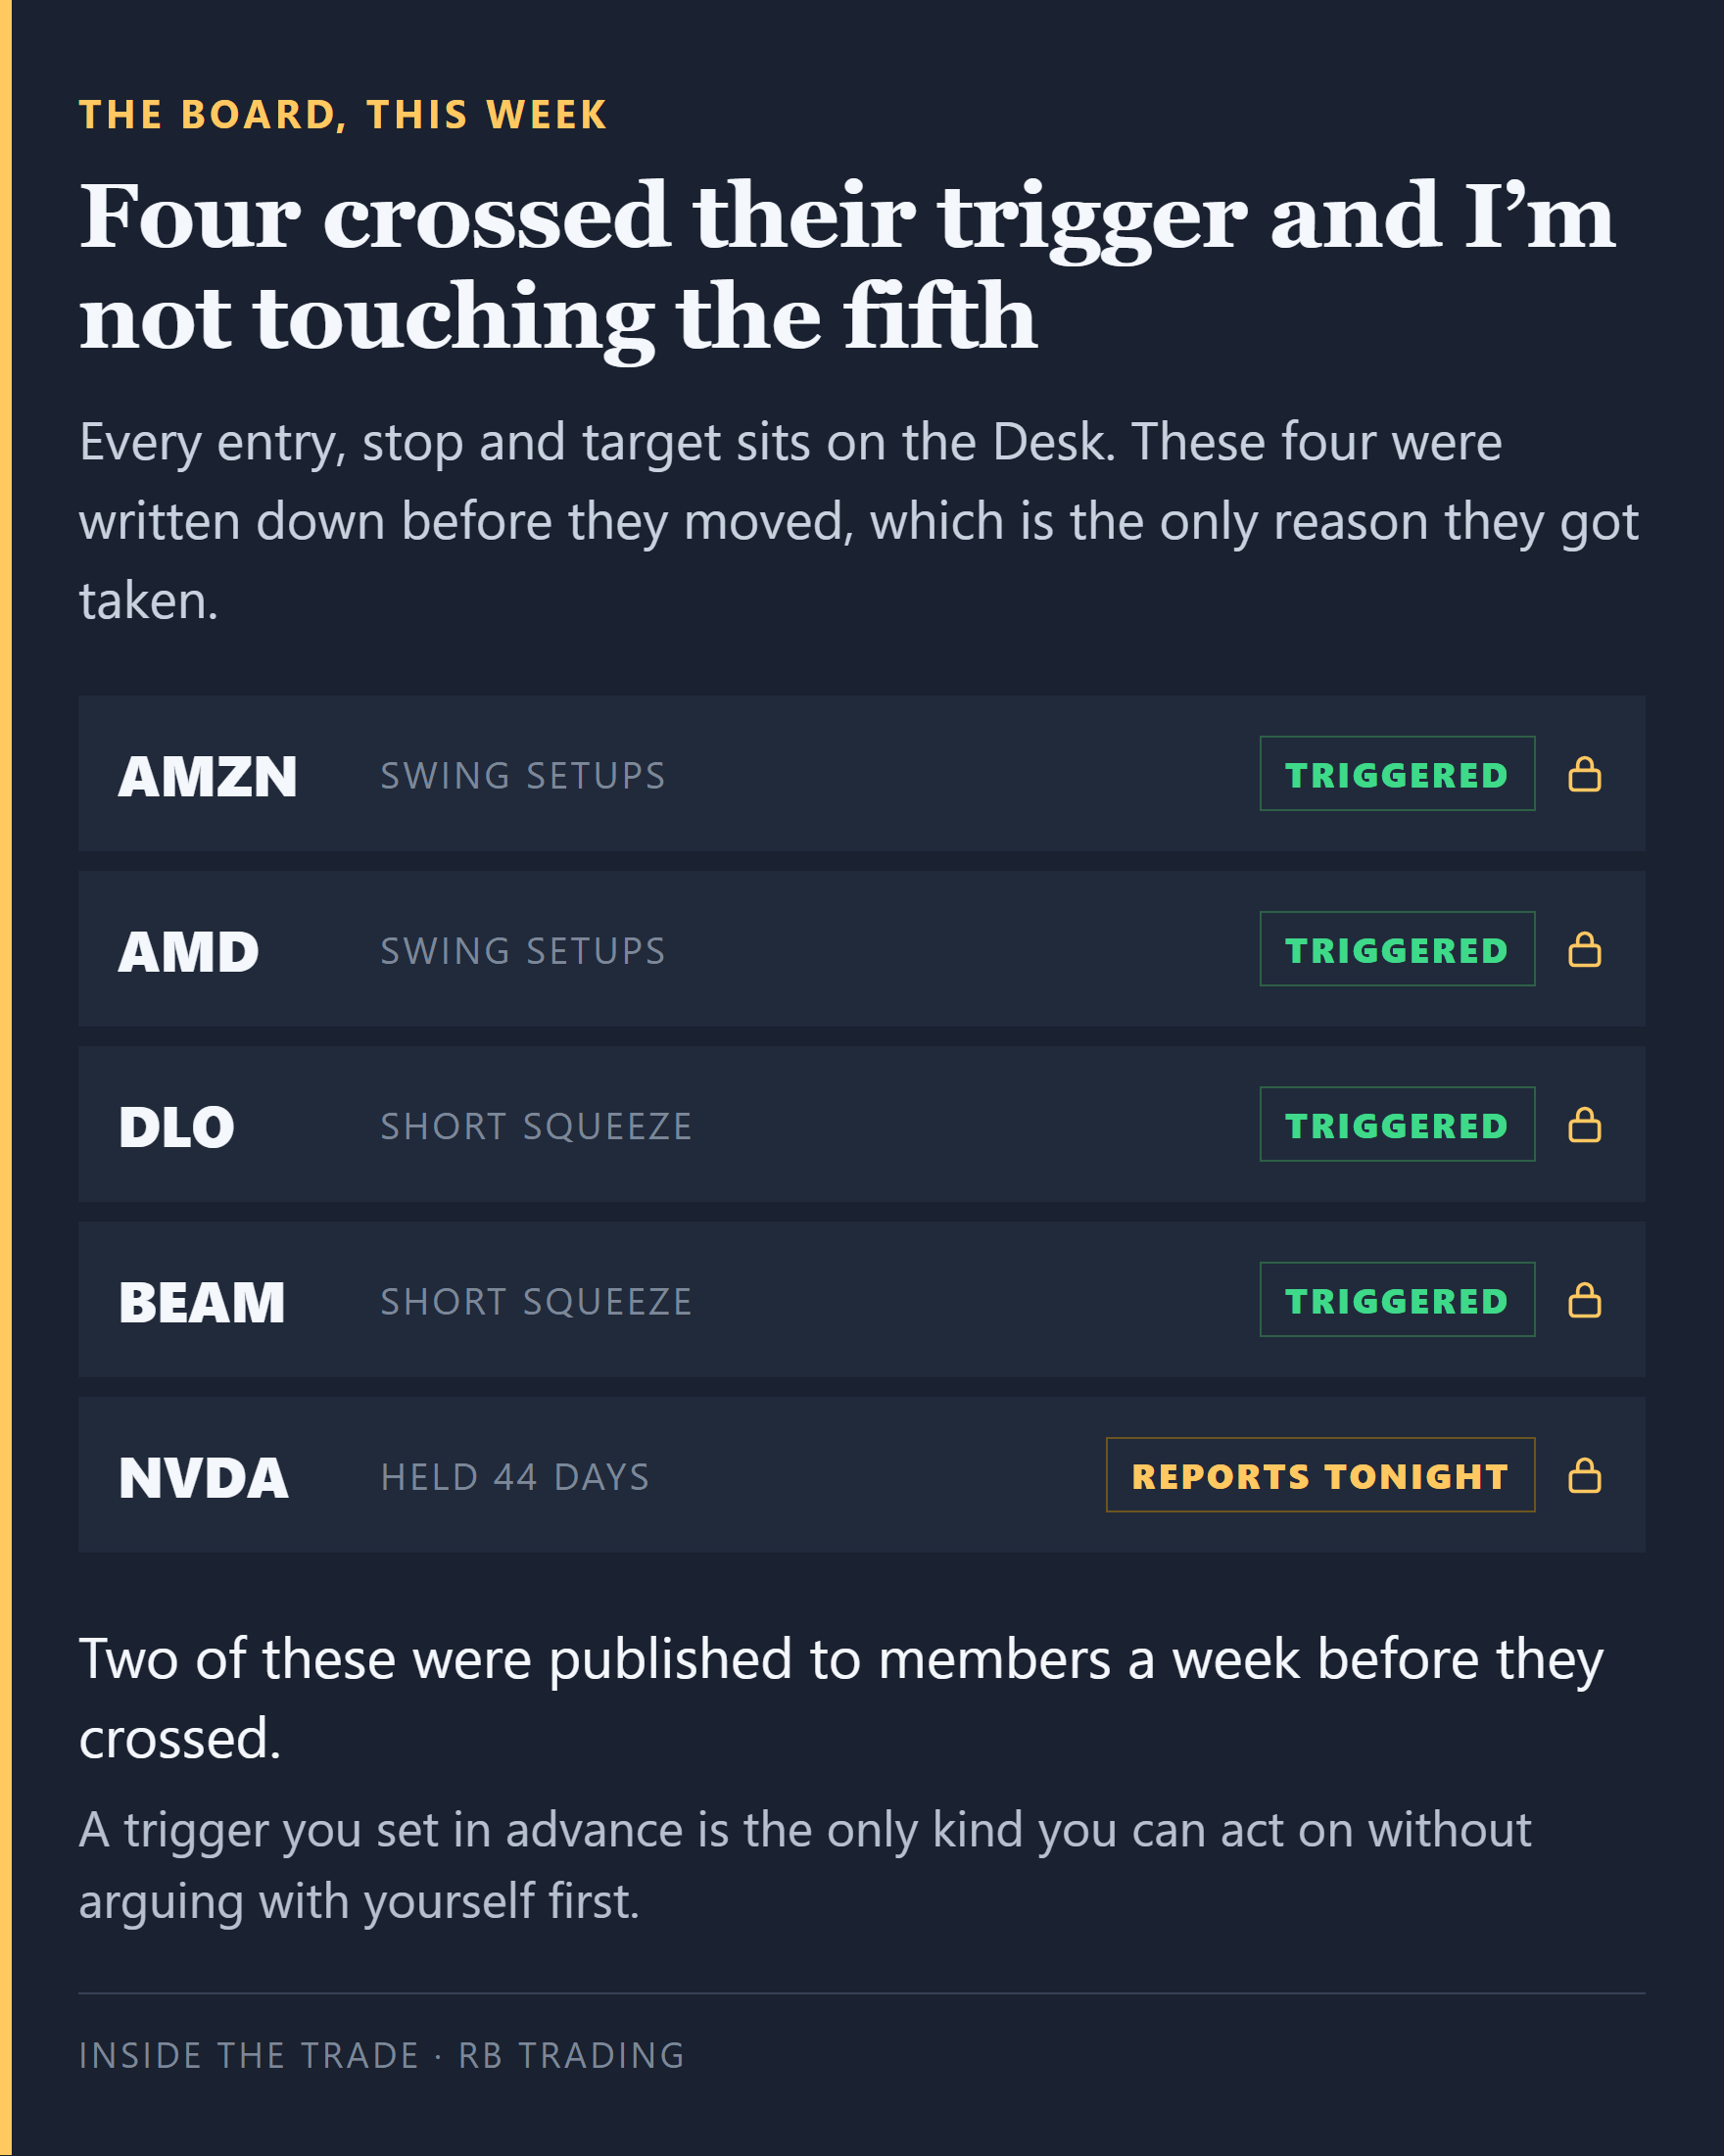
Four crossed their trigger this week. The numbers behind them are on the Desk.
Four triggers crossed and one position going into a scheduled event tonight. The entries, stops and targets behind all of it are on the Desk, live, updating as things move.
Everything above this line is the reasoning. Everything below it is the numbers.
Inside the Trade is $29 a month, which is 95c a day. The annual is $199 on the launch discount, list price $249, and that comes out at 55c a day. Annual saves you $149 against paying monthly.
Cancel anytime. No trial, no money-back on this one, I’d rather just tell you what it is up front.
You get the letter twice a week, the full Trade Desk with every live level on it, four invite-only TradingView indicators and the masterclass library.
Comments
Nothing yet. Say the first thing.
Sign in to join the conversation.