
I’ve been logging every single trade from my short-squeeze account the winners and the ones that got stopped out into this journal I built myself. Looking at the last 32 closed ones, it’s 14 wins and 18 losses. Yeah, I lose more often than I win. The entries and stops all went out in the letters before the trades even happened, and the dates are right there on every post.
I lose more trades than I win.
I’ve lost more trades than I’ve won for as long as I’ve been keeping proper records.
I’ll lose more trades than I win next year as well.
The account went up anyway, and that isn’t a paradox or a humblebrag, it’s arithmetic nobody bothers to do.
Most people check the win rate first. It’s the number in the biggest font on every screenshot you’ve ever seen posted, it’s the first thing anyone asks in a DM, and it’s the one metric on my own score card I’d take off if I thought people would still use the thing.
I built that card. I’m telling you its headline number is close to useless on its own.
I opened the journal on Tuesday morning to check something unrelated, and screenshotted the score card because the shape of it makes the point better than I can.
Overall 73 out of 100. Win rate 43.8%, which scores 44 and is the shortest bar on the card. Profit factor 1.61. Average winner 2.32R. Worst drawdown the account has been through, 4.7%. Consistency and recovery both maxed.
Thirty-two closed trades. Fourteen green, eighteen red.
So the weakest-looking number on the card belongs to a book that’s comfortably profitable, and the card is quietly telling me to go and fix the one thing I’d be mad to touch.
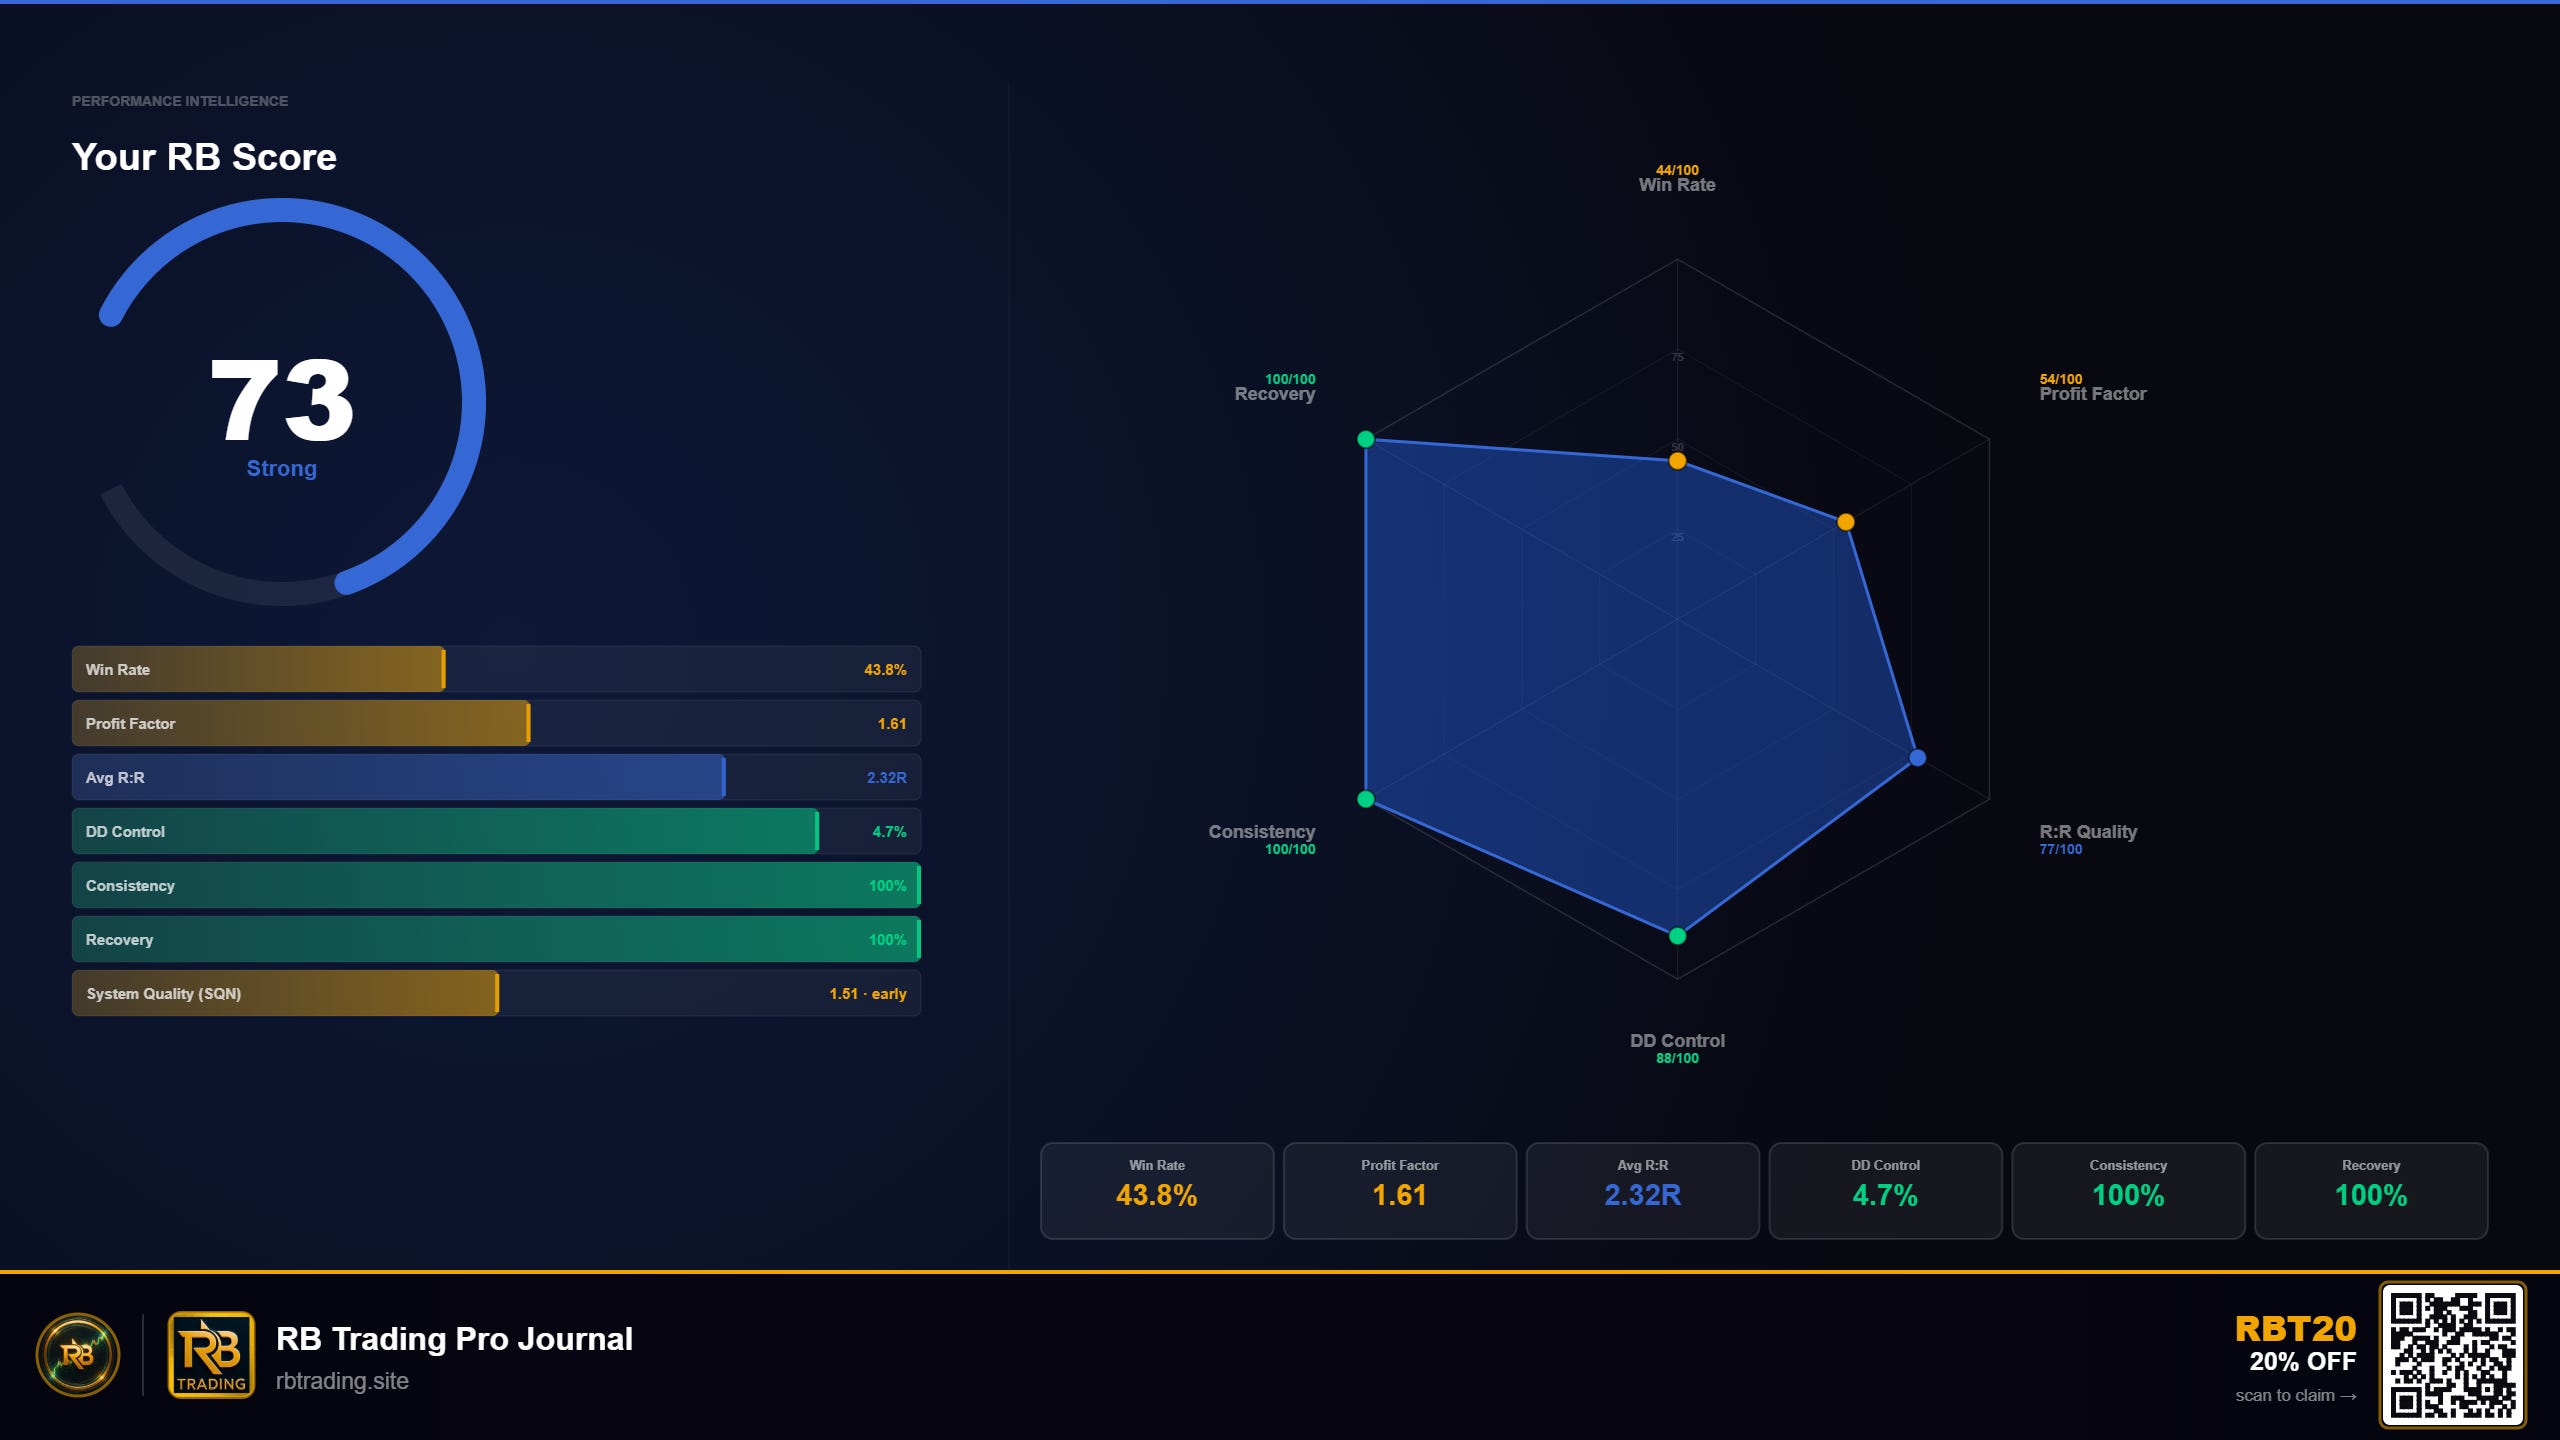
Seventy-three out of a hundred, and the lowest bar on the card is the one everybody leads with.
It means the entries are ordinary. That’s genuinely all it means.
Here’s the bit almost nobody sits down and works out. The win rate you need just to break even isn’t a fixed thing. It moves with how far your winners run. One divided by one plus the reward. That’s the whole formula and it takes ten seconds.
At even money, where a winner pays what a loser costs, you need better than 50% or you’re going backwards. At 2R you need 33.3%. At 2.32R, which is where mine actually land, you need 30.1%.
I’m doing 43.8%.
That’s nearly fourteen points of cushion above the line where the book stops making money, and not one point of it came from being a better forecaster. It came from where the exit was written.
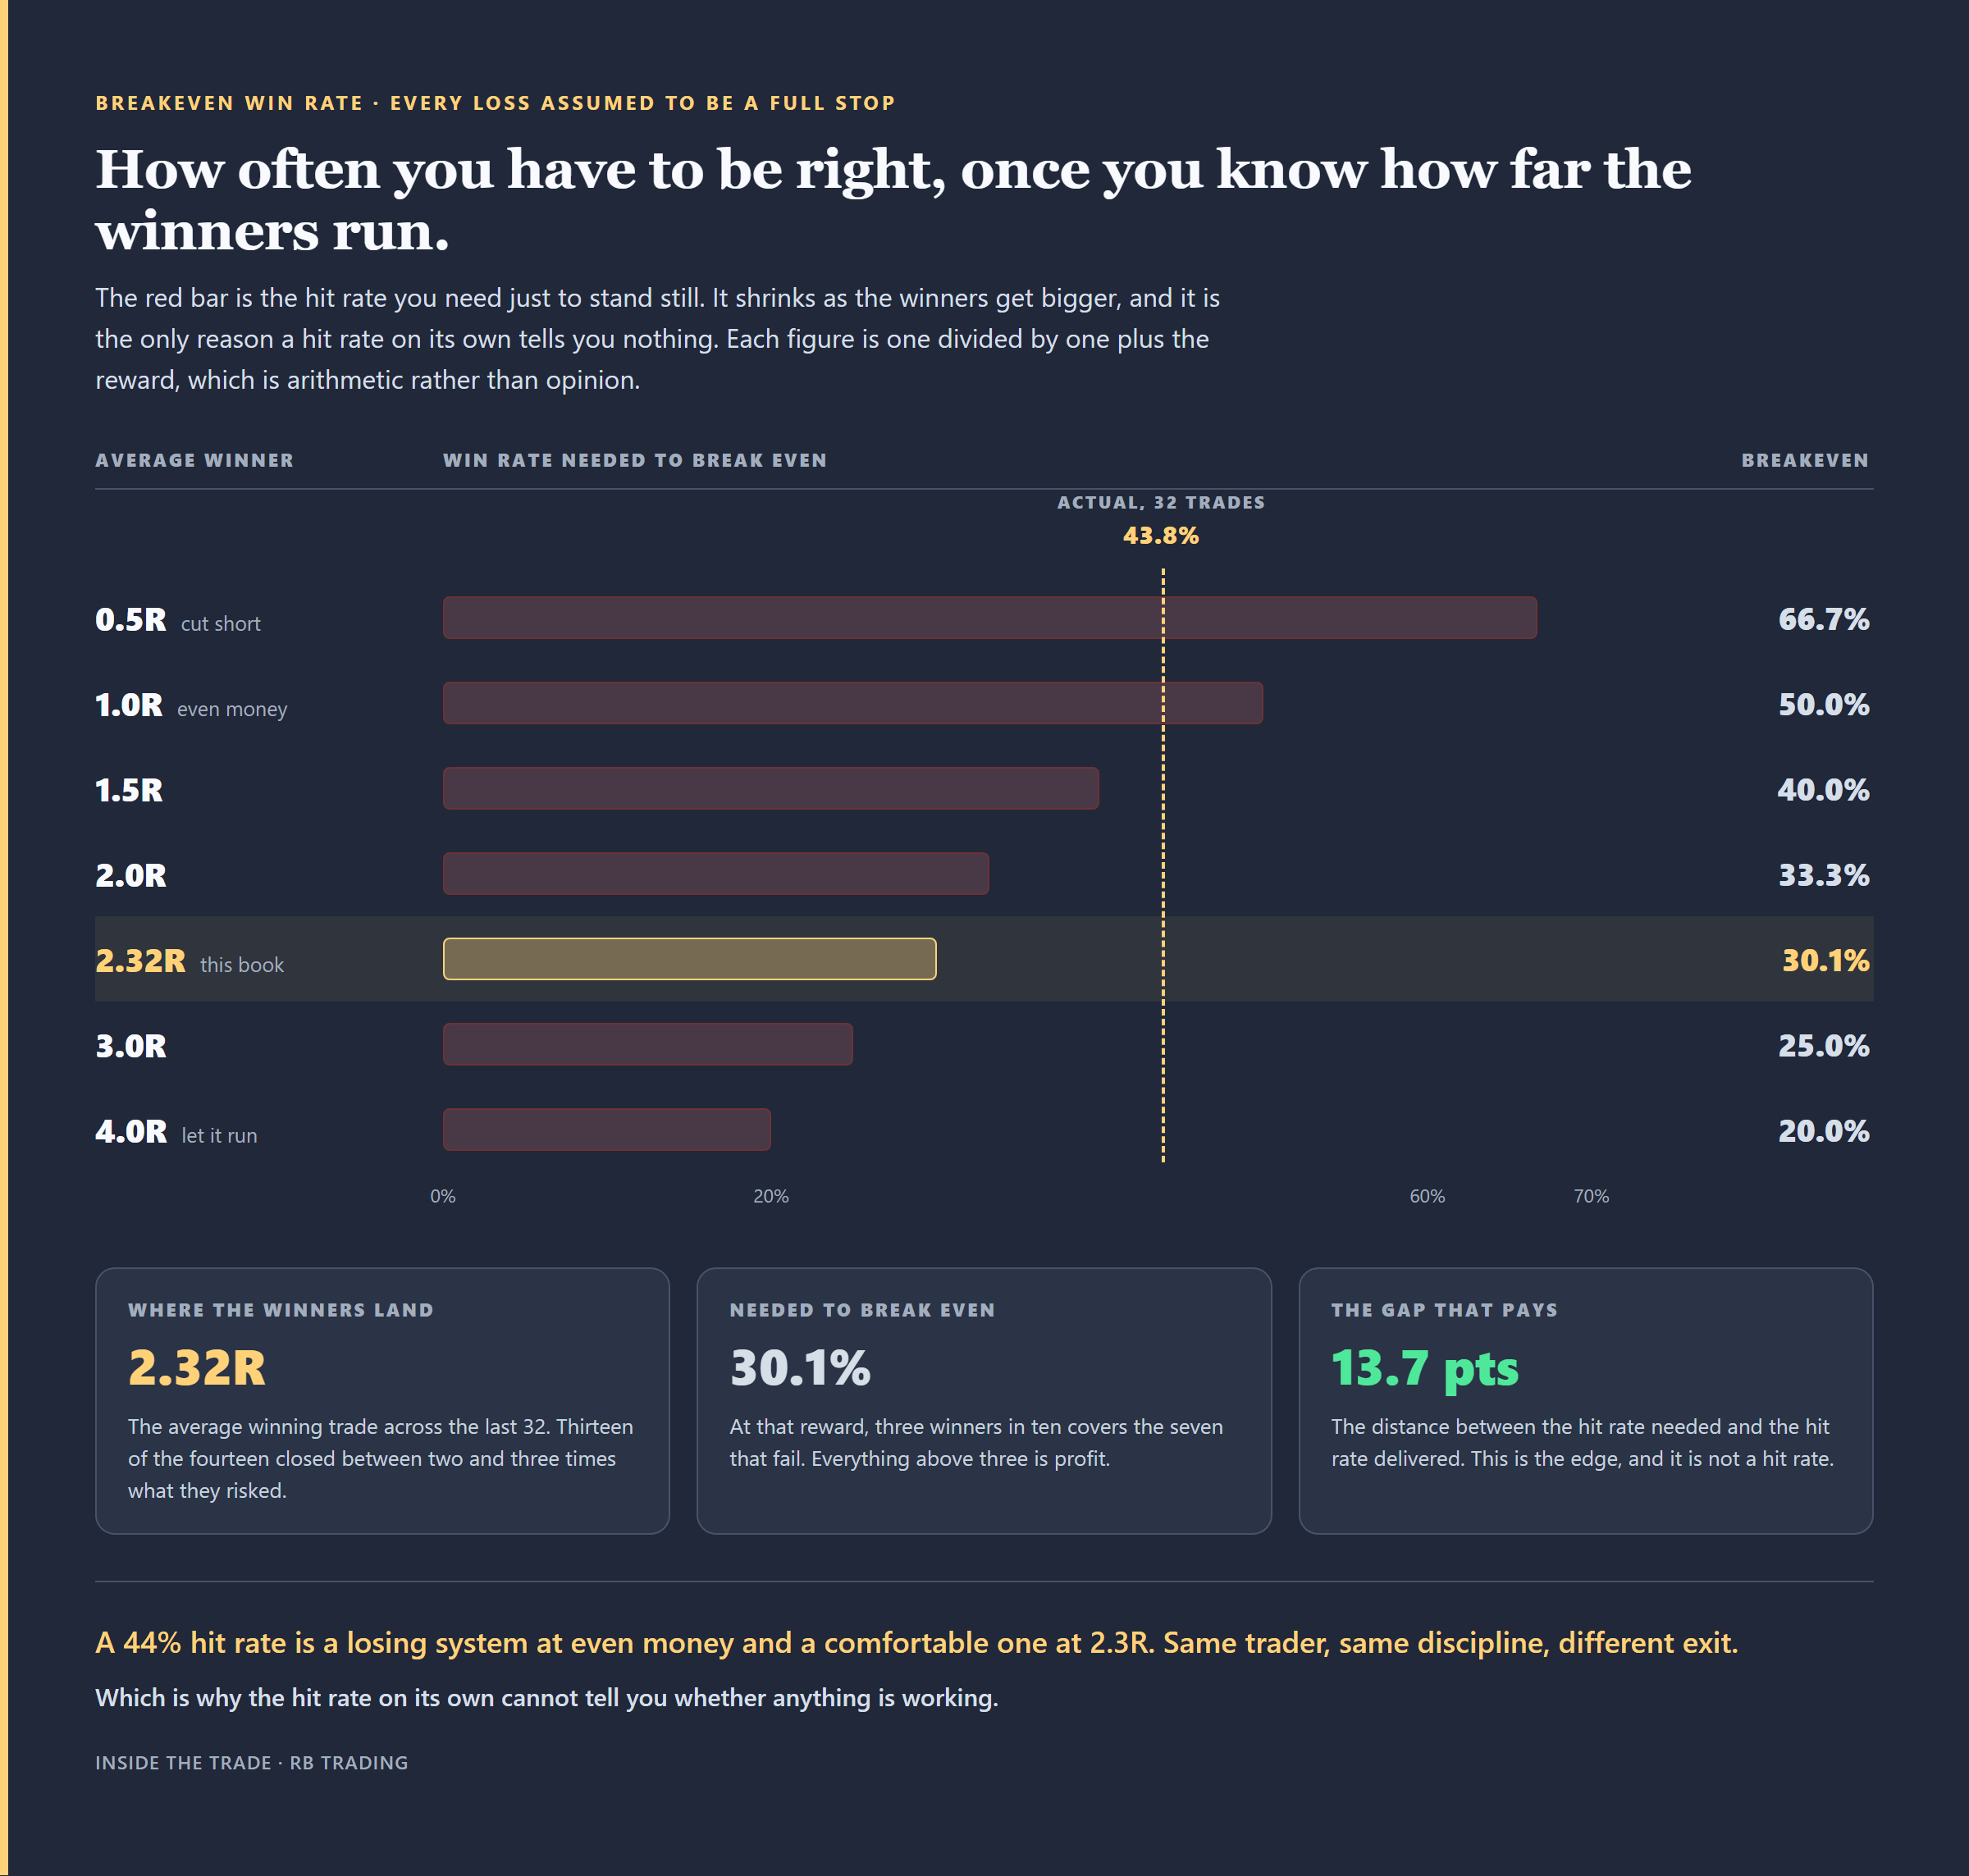
Three winners in ten covers the seven that fail, once a winner is worth 2.3 losers.
This is the part I’d actually want you to look at, and it’s the part nobody screenshots.
Pull up the R-multiple distribution on the second card. Eighteen red trades, and every one of them sits in the bucket between minus one and zero. Not a single loss got past its stop. No gapping through, no “I’ll give it a bit more room”, no widening anything at four o’clock because the thesis is still valid.
Thirteen of the fourteen winners landed between 2R and 3R. One went past 3R.
That distribution is the system. The entries decide which bucket a trade lands in. The exits decide how big the buckets are, and only one of those two is under my control on a given Tuesday.
The card also prints the longest run of consecutive losses. Eight.
Eight in a row, and the worst peak-to-trough this account has been through across the entire record is 4.7%.
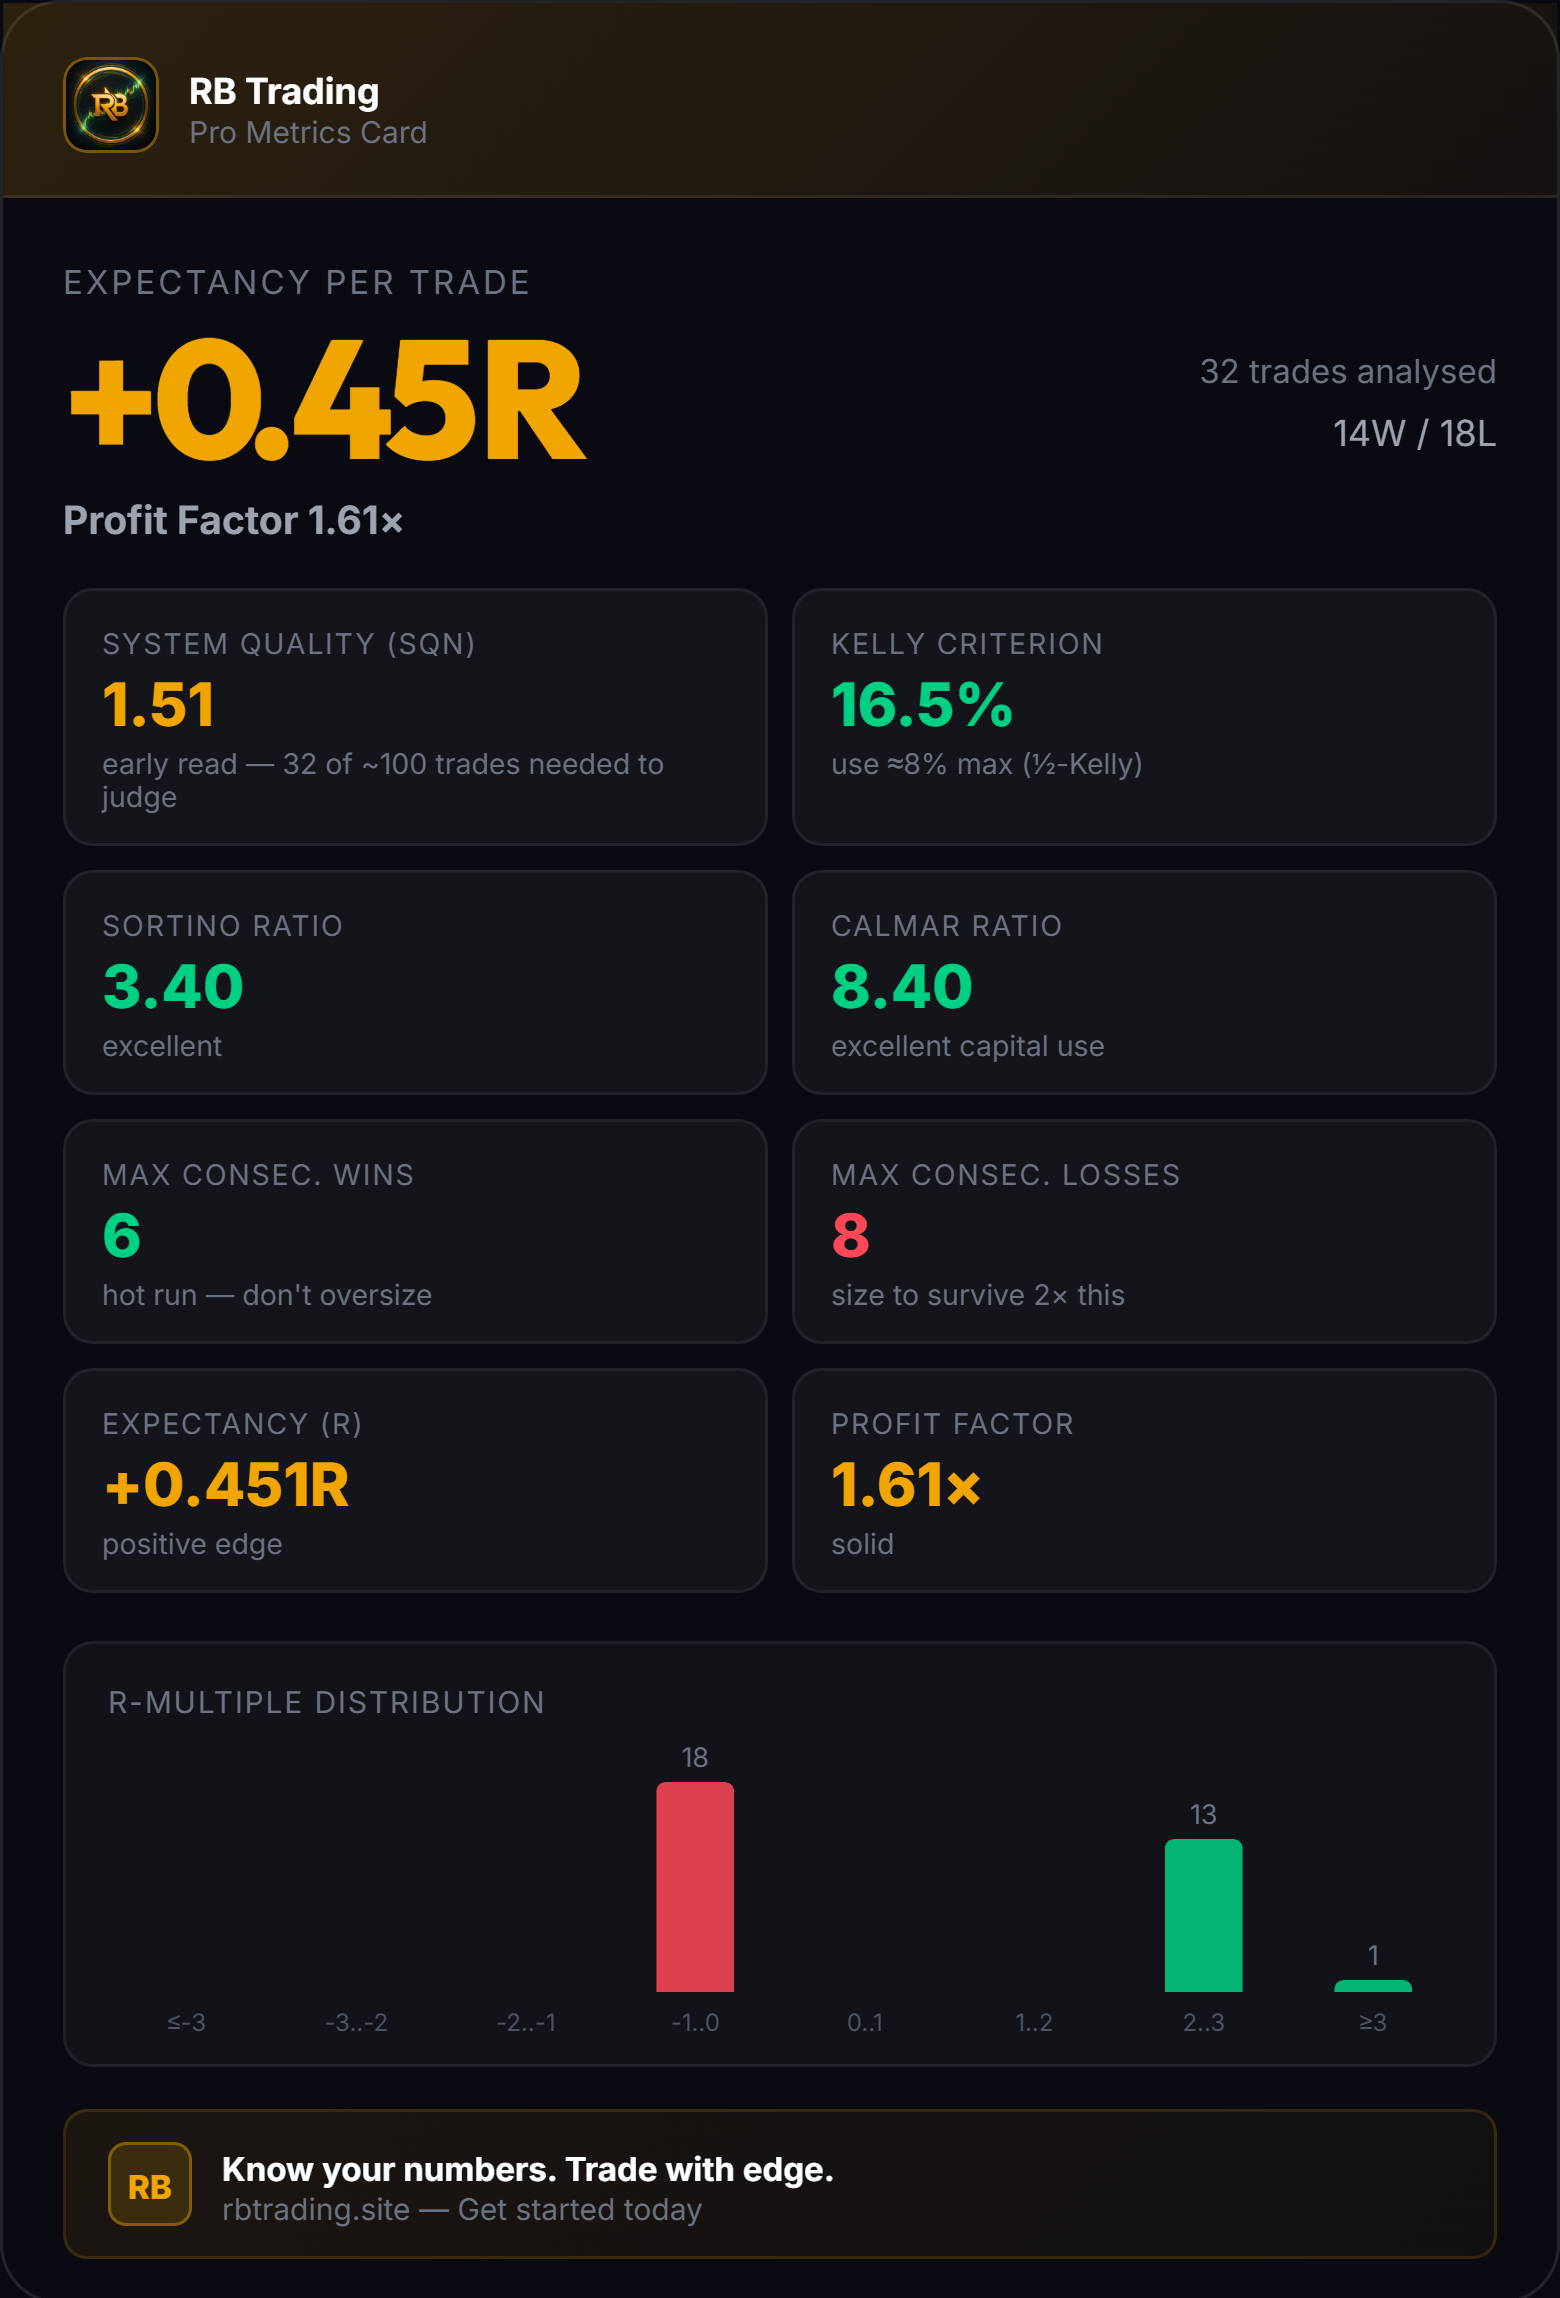
Every red trade sits between minus one and zero. That column is the risk management, not the entries.
Two of these. Both free to check, neither of them my word.
One. The system quality number on that card, 1.51, isn’t mine. It’s Van Tharp’s SQN, published decades ago, and it weighs the average R against how much the R varies across the sample. The card grades it as an early read and says so on its own face: 32 trades of the roughly 100 you’d want before calling it anything. I’m quoting a number that is openly telling you my sample is too small, because that’s what an honest metric does, and it’s why I put it on the card.
Two, and this one is worth thirty seconds of your time. Open the rules page of any prop firm you’ve ever considered. Any of them. Read the evaluation criteria properly.
Profit target. Maximum daily loss. Maximum overall drawdown. Minimum trading days, sometimes.
Nowhere on that page is there a win rate.
Not one firm in the industry gates a payout on how often you’re right. They gate on what a bad run costs, which is precisely the thing a win rate cannot see. These are companies whose entire business model is working out which traders survive, and they don’t ask the question everyone else asks first.
Both, and this is the whole trap in miniature.
The board’s closed record over the last month reads 8-3. That’s a 73% hit rate, and it’s a long way north of the 43.8% on the card. If I were trying to sell you something I’d screenshot the month and never mention the record.
Eleven trades isn’t a sample. It’s a month.
Run a book like this long enough and stretches like that fall out of it regularly. The same 32-trade record contains a run of six straight winners and a run of eight straight losers. Neither of those told me anything at the time about whether I was any good, and the one that felt most like information was the good one.
The month is a nice month. The record is the thing that pays.
I get this one a lot, and it’s the whole letter in a sentence.
Say you’re right seven times in ten. Genuinely right, no fiddling. But you close winners as soon as they’re comfortably green, so a winner pays about half of what a loser costs. Seventy winners at half a unit is thirty-five. Thirty losers at a full unit is thirty.
A hundred trades, right seven times in ten, and you’re up five units.
The 43.8% book puts up forty-five over the same hundred, off a measured expectancy of +0.451R a trade. Nine times the money, from the trader who’s wrong more often than he’s right.
And the 70% book is fragile in a way that doesn’t show up until it matters. Its profit factor is 1.17. One widened stop, one position held through a gap, and the entire year’s edge is gone. The 43.8% book has an eight-trade losing streak in its record and the drawdown never got past 4.7%.
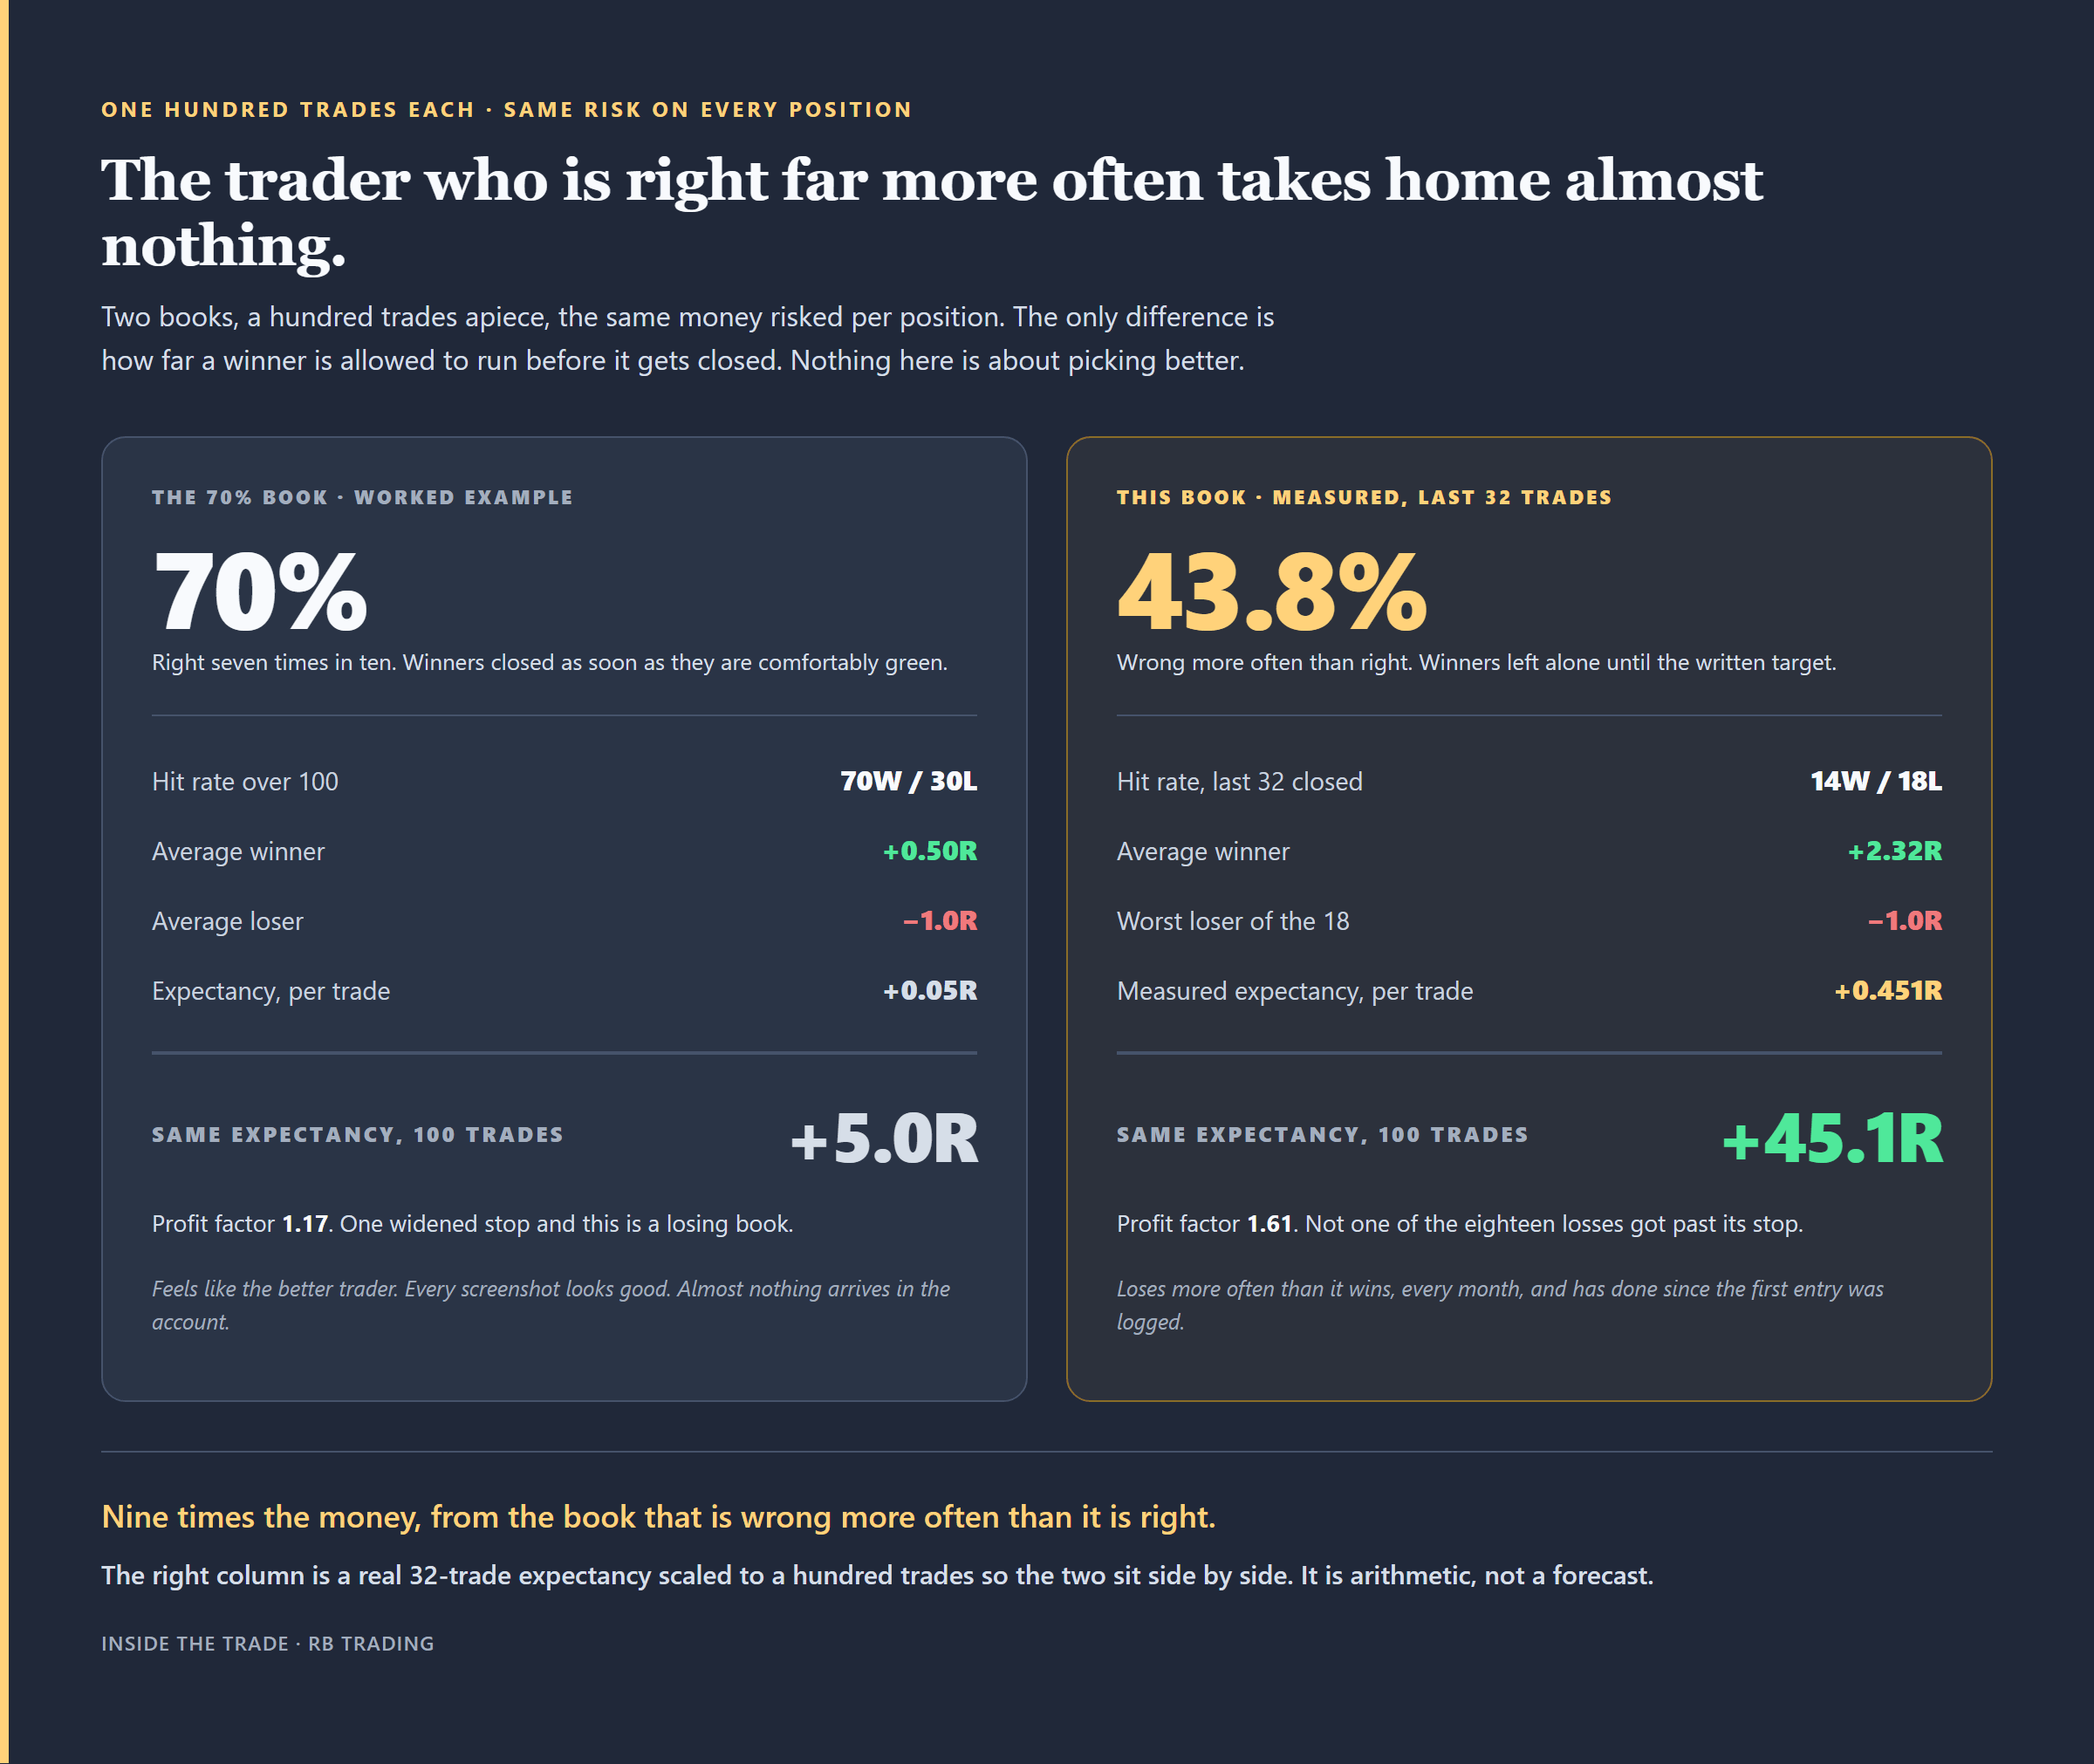
The book that is right seven times in ten takes home a ninth of what the wrong one does.
Here’s how the win rate actually does damage, and it isn’t by being a bad statistic. It’s a bad statistic that makes you do things.
You’re in a position. It’s up a bit. Not at target, nowhere near it, but it’s green and it’s been green since the open, and there’s a version of this where it comes back and stops you out and you feel like an idiot. So you close it. Small win. Green tile in the journal. Win rate ticks up.
I’d call that the green-tick exit, and I’ve done it more times than I’d like to write down.
Nothing about it feels like a mistake at the time. It feels like discipline. Taking profits, managing risk, not being greedy, all the phrases that sound like the right thing to be doing.
Run it across ten trades and it stops being a feeling.
Ten entries, same stops, same targets. Four of them eventually reach that target. Three more trade into profit first and then come back and stop out. Three never go anywhere at all.
Take the tick every time and you finish at 70% and up 1.2R. Leave them alone and you finish at 40% and up 3.2R.
Same ten trades. Same entries, same stops, same everything. Thirty points of win rate, bought for two thirds of the profit.
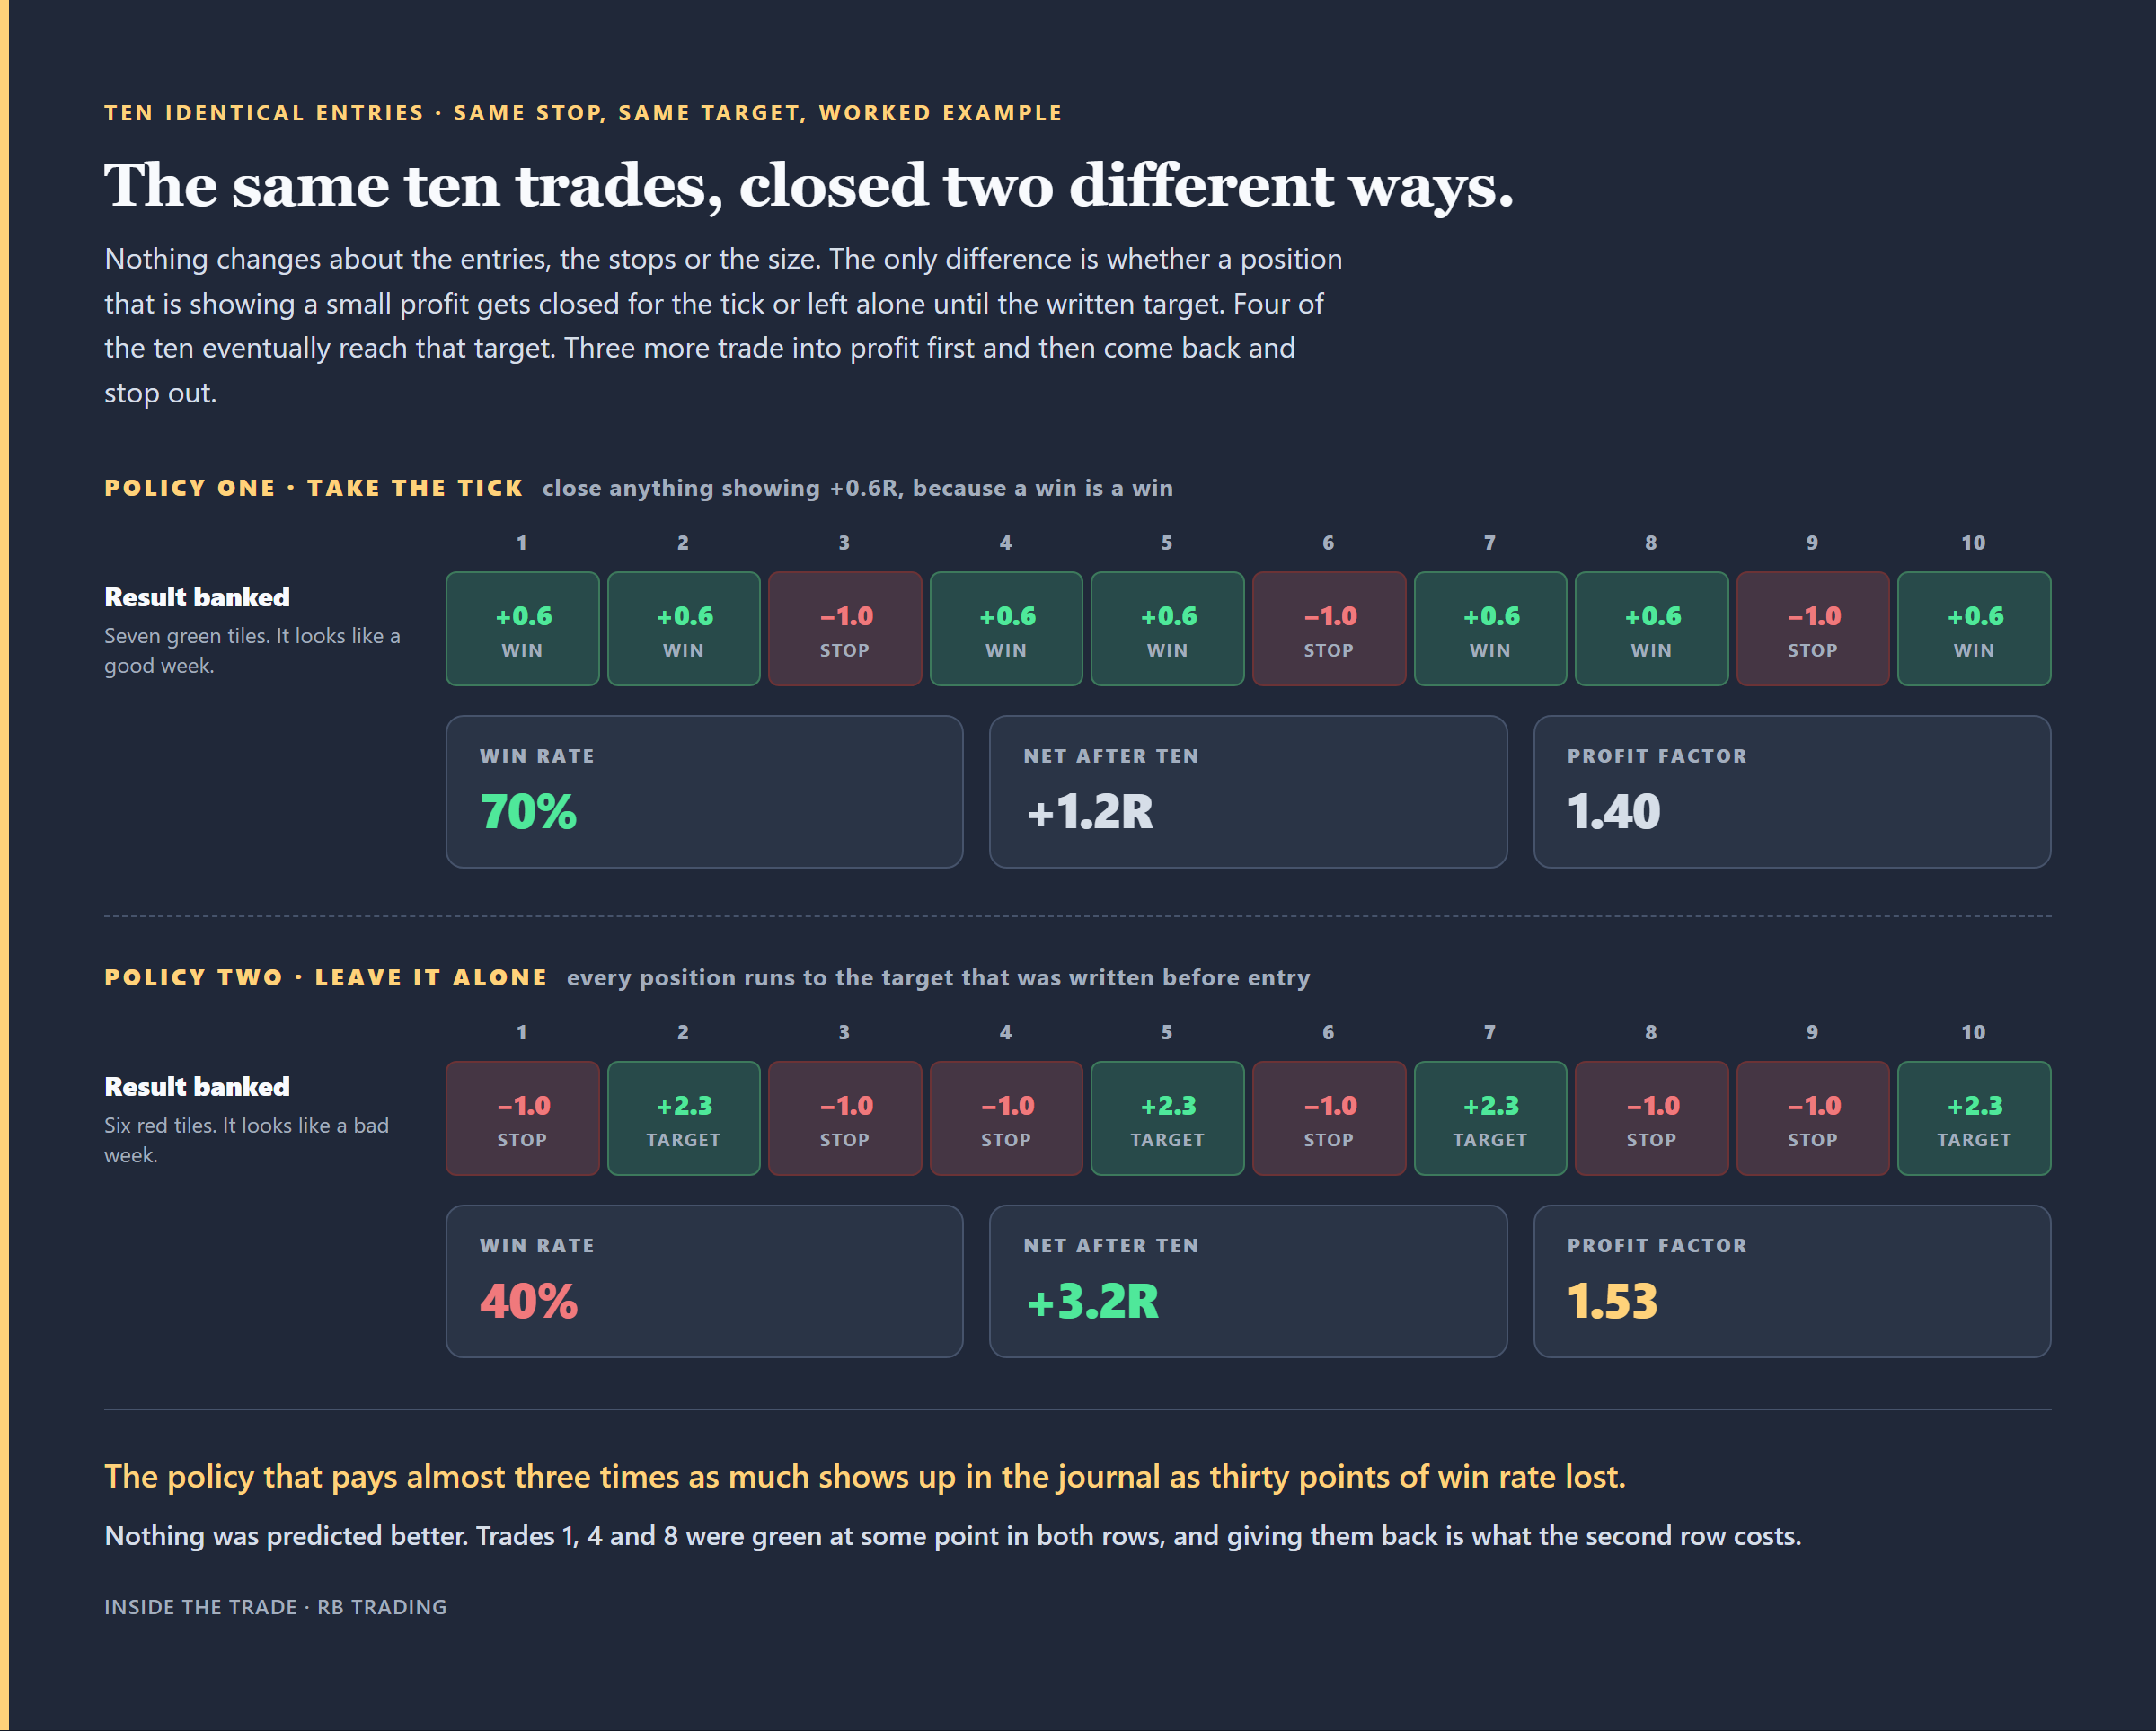
Same ten entries. Thirty points of win rate bought for two thirds of the profit.
No, and this is the version of the idea that costs people money.
Hold everything to a target you picked because it sounded good and you’ll find out quickly that a 5R target with a 44% hit rate isn’t a system, it’s a lottery ticket with extra steps.
The target has to sit somewhere price can actually get to, and on this book that means it comes off structure — the level the move was heading for anyway — rather than off some reward multiple I fancied on the day. 2.32R is the average of where those targets happened to land. It’s an output, not an input. I’ve never once opened a position and decided it needed to make 2.3.
The rule is narrower than “let your winners run”, and it’s this: the exit gets written before the entry exists, and then it doesn’t get renegotiated by a bloke watching a green number move.
That part is the hard part, and it’s got nothing to do with charts.
If you take one thing off this letter, take this. There are six numbers on that score card, and only one of them gets better when you trade worse.
Close your winners early and the win rate goes up. Today. No skill required.
Try that with profit factor and it falls. Try it with average winner and it falls. Drawdown control, consistency, recovery — none of them budge for you, because each one measures something you can only move by actually improving.
The most quoted number in retail trading is the only one on the card a worse trader can raise on purpose. Which is roughly why it gets quoted.
Watch expectancy instead. Mine is +0.451R a trade, and it answers the only question that matters: across a big enough sample, what does the average trade pay. Then watch what a bad run costs, because that’s the number deciding whether you’re still in the seat to collect the expectancy.
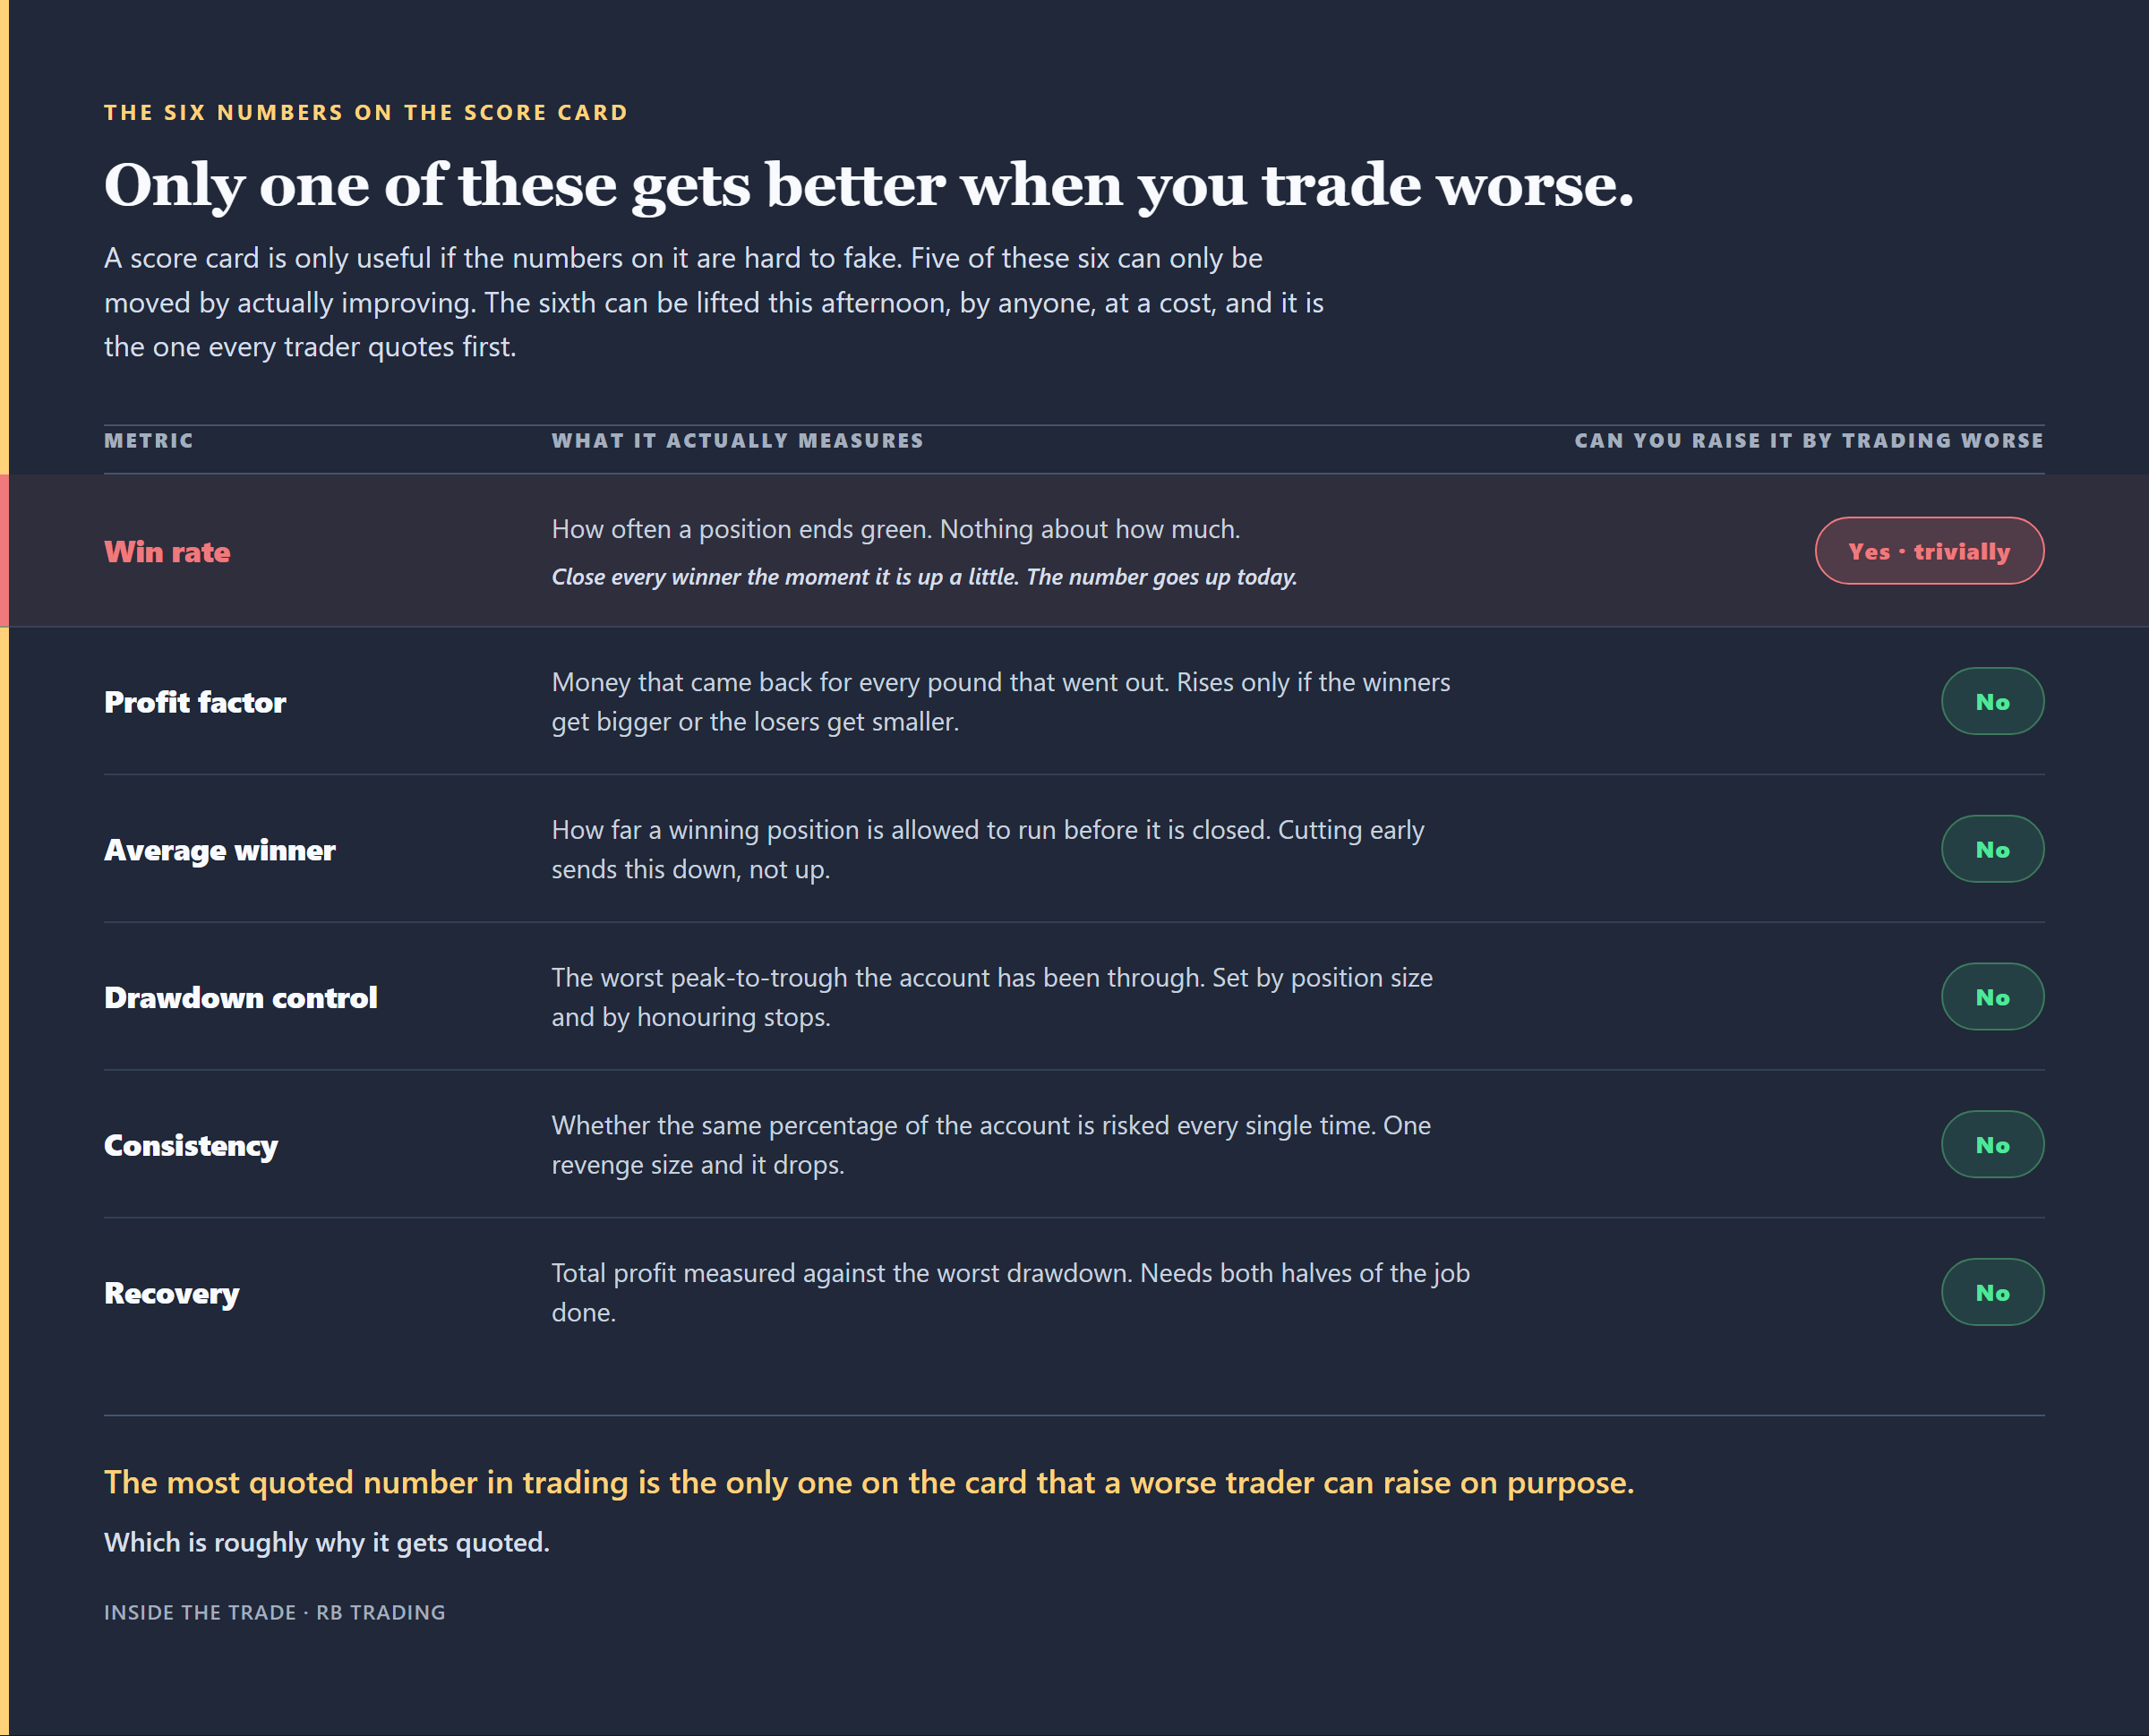
Five of the six can only be moved by improving. The famous one can be moved this afternoon.
Almost nobody can tell you their expectancy, their average winner, or what their worst run actually cost. Those three live in the head as a feeling instead of a figure, which is why the feeling is always worse than the reality, and why people change the wrong thing after a bad fortnight.
That’s the whole reason I built a journal rather than recommending somebody else’s. It computes all of this off your own trades, and the score card in this letter is just my numbers sitting in it.
→ Readers of this letter get 30% off the RB Trading Journal with the code RBT30 at checkout: rbtrading.site
(Paying members, don’t use that code. Your rate is better and it’s already applied. Details below the break.)
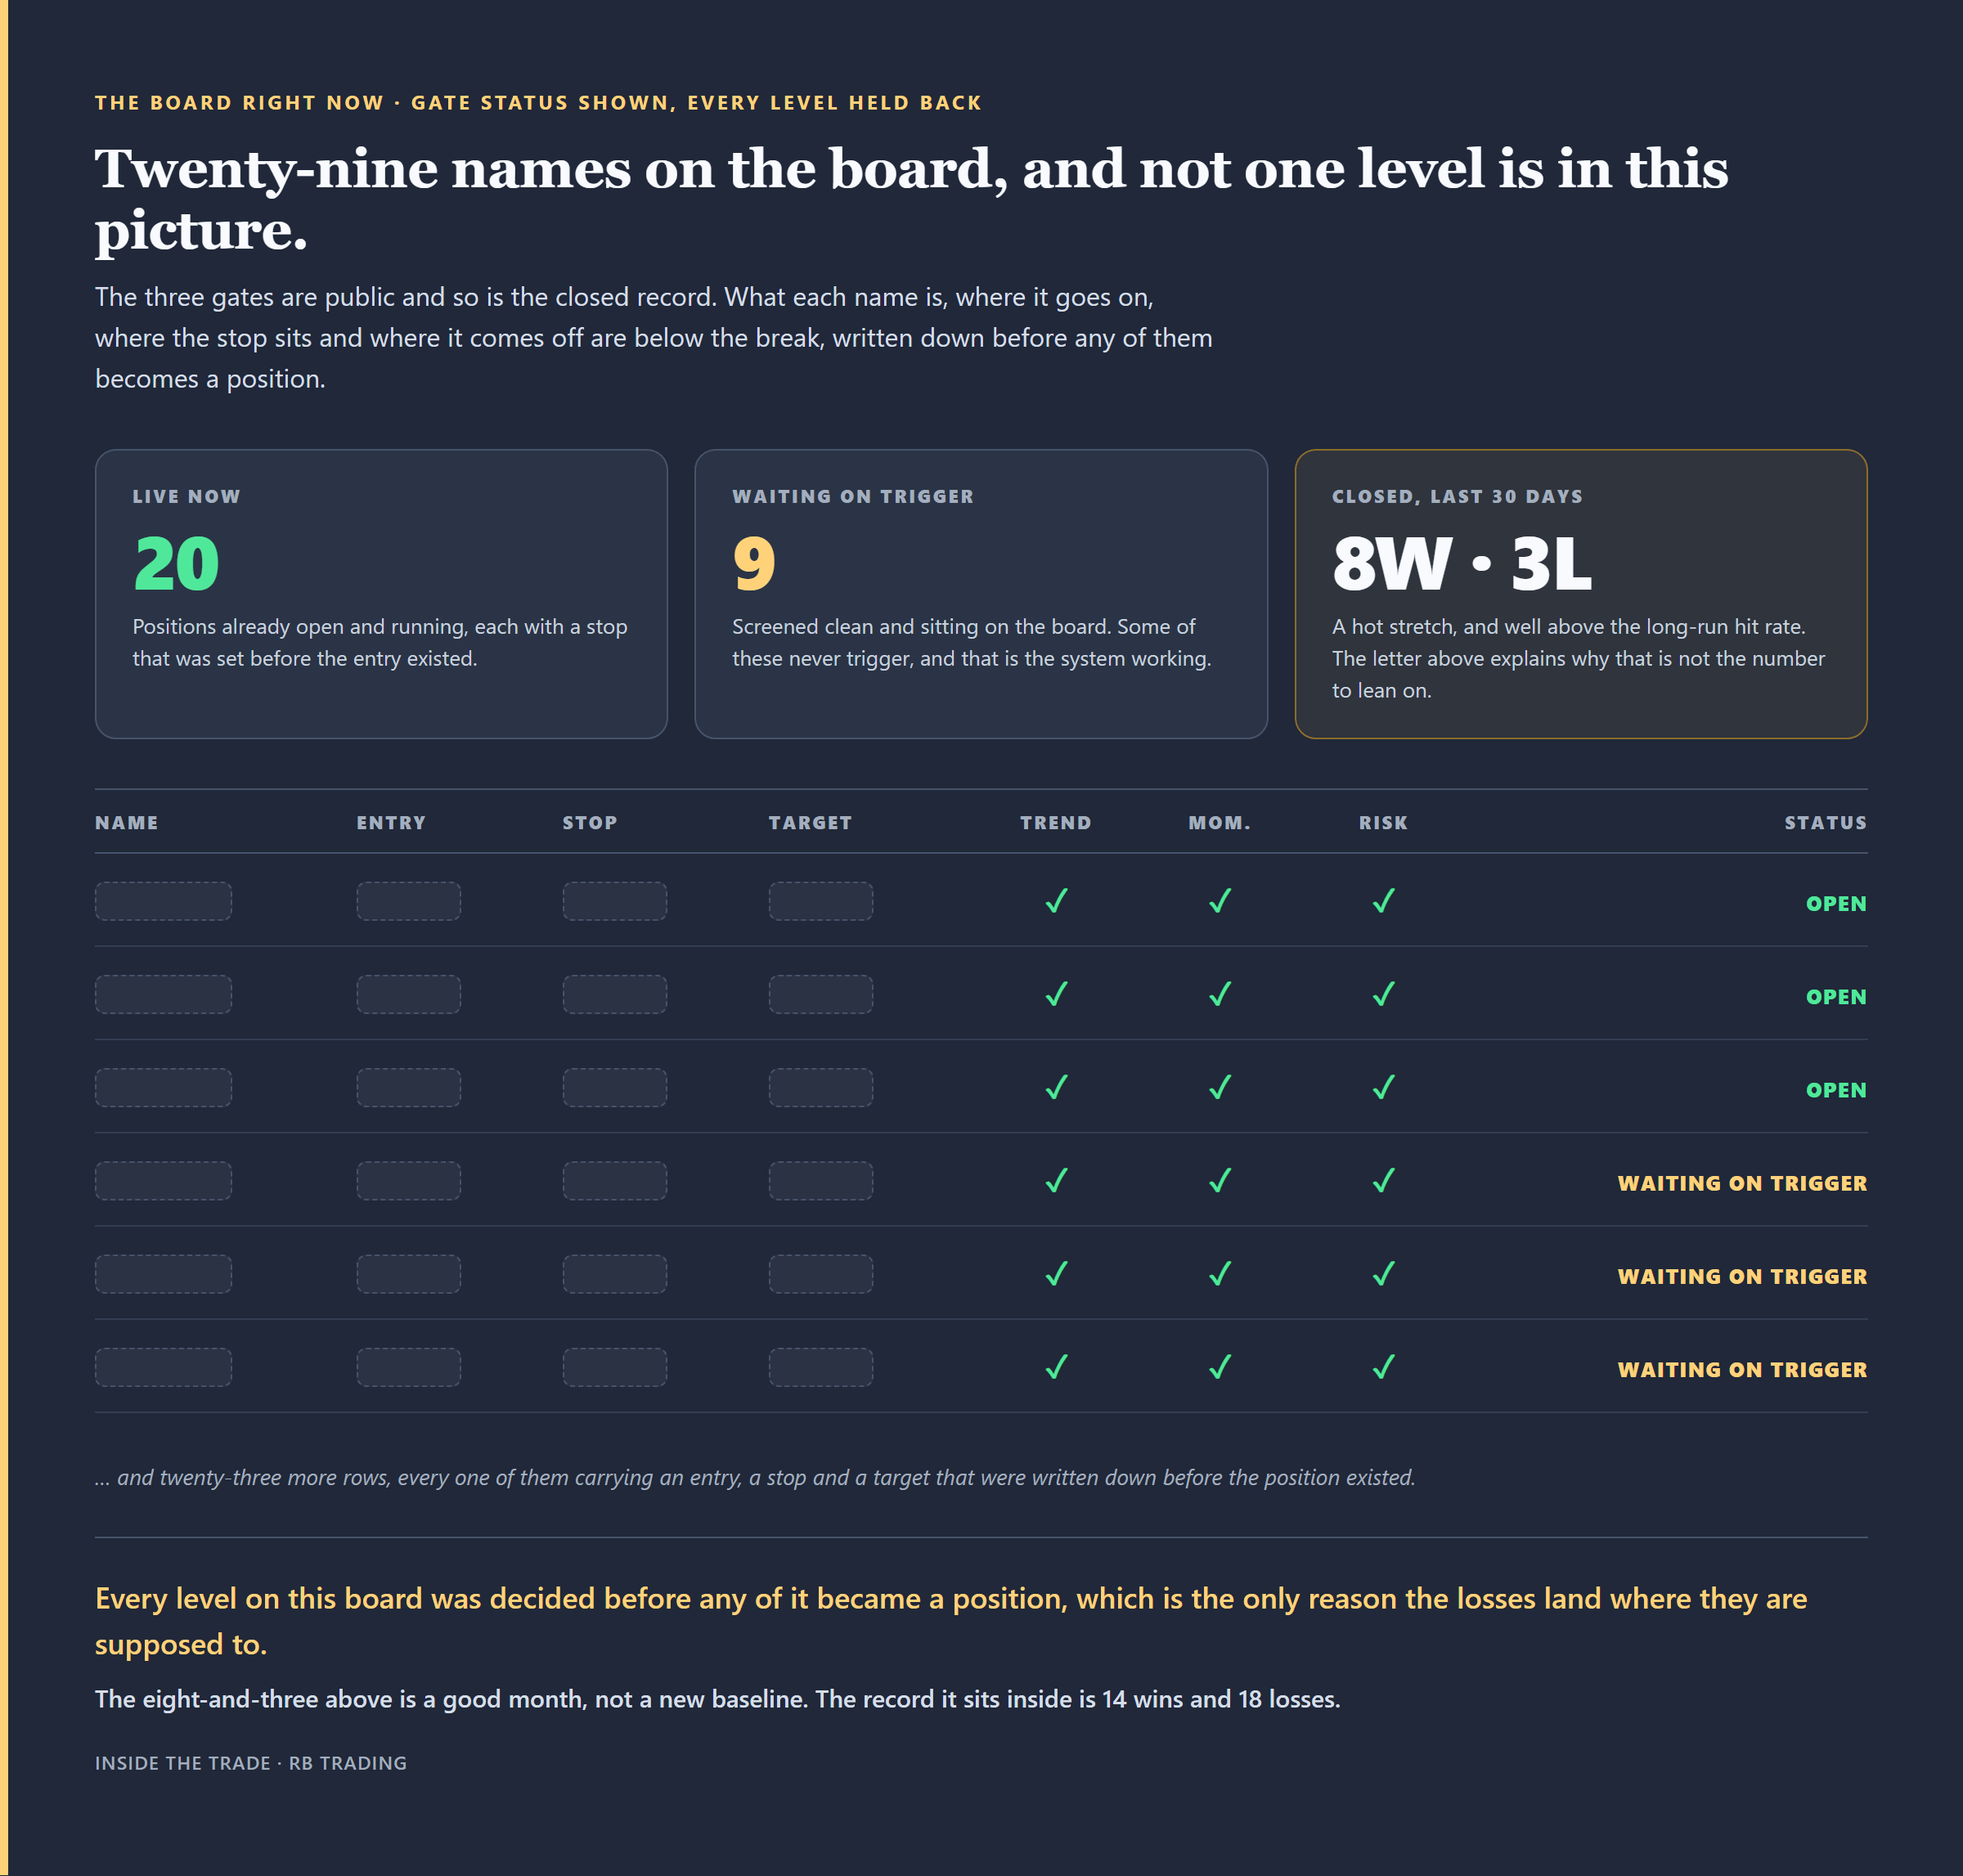
Twenty-nine names on the board and not one level in the picture. The gates are public, the prices aren’t.
You’ve had the whole record above: the hit rate, the distribution, the drawdown, the expectancy, the losing streak, all of it, without paying anything. What’s below the break is where the next ones go on — twenty positions already live and nine more waiting on a trigger, every one of them carrying an entry, a stop and a target that were written down before the position existed.
That board is live on the Desk and it moves during the week. → tradedesk.rbtrading.site
Inside the Trade — paid
Every setup with the entry, the stop and the target written down before it’s a position. The full Trading Desk, updated Sunday. Two letters a week. Four invite-only TradingView indicators. Twenty-plus masterclasses. And the journal at half price, applied automatically.
→ $29 a month. That’s 95c a day.
→ $199 for the year on the launch price, list $249. That’s 55c a day, and $149 less than paying monthly.
Cancel anytime. No trial, and no money-back on this one, because you just read my entire closed record — the hit rate, the eighteen losses, the eight-trade losing streak — before being asked for anything.
Comments
Nothing yet. Say the first thing.
Sign in to join the conversation.