
Disclaimer: This post is for informational purposes only and does not constitute financial advice. Past performance is not indicative of future results. Always conduct your own research or consult with a financial professional before making investment decisions.
Most investors believe they're diversified by owning an S&P 500 index fund. The reality in 2026? They may be running a highly concentrated bet on a handful of AI and tech mega-caps and history has a sobering message about what comes next.
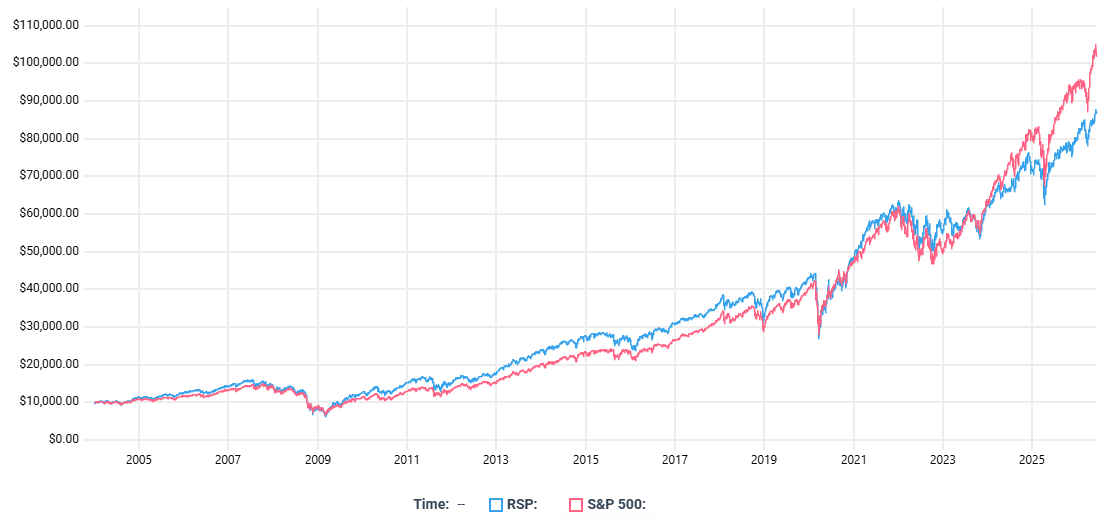
Image: RSP (Equal Weighed S&P 500 ETF) Vs Market Cap Weighed S&P 500. With RSP outperforming S&P 500 after dot-com bubble as well as Great recession.
To understand the risk building in your portfolio, you have to look under the hood of how market indices are constructed.
Market-Capitalization Weighting (The Traditional S&P 500): In a standard index fund like the SPDR S&P 500 ETF Trust (SPY), companies are weighted by their market value. The bigger the company, the larger its share of the index. Because tech titans have swollen to multi-trillion-dollar valuations, the top 10 constituents now account for a record-breaking 41% of the entire index’s weight. A decade ago, that figure was just 19%. Today, the technology sector alone represents nearly 44% of the S&P 500.
Equal Weighting (The Broad-Market Alternative): The Invesco S&P 500 Equal Weight ETF (RSP) tracks the exact same 500 companies, but it gives each corporation an identical slice of the pie—roughly 0.2% at each quarterly rebalance. In RSP, a mid-cap industrial manufacturer or a regional utility provider has the exact same influence on your returns as Apple, Microsoft, or Nvidia. The top 10 concentration drops from 41% to just 2.8%.
For most of the past two decades, equal weight had the upper hand.
The S&P 500 Equal Weight Index outperformed the standard market-cap weighted index by an average of 1.05% annually from its inception in 2003 through 2022.
This long-term advantage is intuitive: equal weighting forces exposure to mid-size and smaller large-cap companies that have historically offered stronger mean-reversion opportunities than mega-caps already priced for perfection.
However, the Magnificent Seven era reversed this relationship: In 2023, SPY surged 26.2% while RSP managed a modest 13.7%. In 2024, the gap widened, with the cap-weighted index skyrocketing nearly 33% while the equal-weighted index lagged behind at 19.5%. The story repeated in 2025, with SPY up 17.7% and RSP up 11.2%.
Consider these striking realities of the current market:
The Nvidia Factor: A single stock, NVIDIA, has responsible for nearly a quarter of the entire S&P 500’s year-to-date gains. Its individual market value has surpassed the combined capitalization of the world’s major pharmaceutical giants.
The Invisible Bear Market: While the headline S&P 500 hovers near all-time highs, more than 220 stocks within the index are down 20% or more from their historical peaks. Over 100 stocks are down more than 40%.
The 4% Anomaly: Only about 4% of individual stocks in the S&P 500 are currently participating in making new historical highs. Put another way, roughly 85% of individual stocks are underperforming the broader index.
This environment means that if you exclude the few companies directly feeding the AI computing demand, the S&P 500 has actually trended flat-to-negative for long stretches. The index looks incredibly resilient, but it is an illusion driven by a few hyper-performers.
This level of concentration naturally sparks comparisons to historical market bubbles, most notably the 2000 Dot-Com crash. The parallels are not just anecdotal; they are deeply mathematical.
During the peak of the 2000 dot-com bubble, a tiny group of infrastructure companies like Cisco Systems, Intel, and Microsoft were dubbed the “arms dealers” of the internet. Investors piled in blindly, convincing themselves that valuations didn’t matter because the internet would change the world. The internet did change the world, but those stocks still crashed by 80% or more when their near-term earnings growth failed to justify their astronomical multiples.
Today, the valuation metrics are flashing the exact same warning signs.
The Shiller P/E Ratio (Cyclically Adjusted Price-to-Earnings) has climbed to an alarming 42.32. There have been only two other times in modern financial history where valuations reached this altitude: the eve of the Great Depression in 1929, and the absolute peak of the Dot-Com crash in 2000 (which peaked at 44.19).
Furthermore, the famous Buffett Indicator which measures the total value of the stock market relative to U.S. GDP has soared to an unprecedented 237%. This completely eclipses the peaks of the 2000 bubble (142%) and the 2021 speculative frenzy (218%).
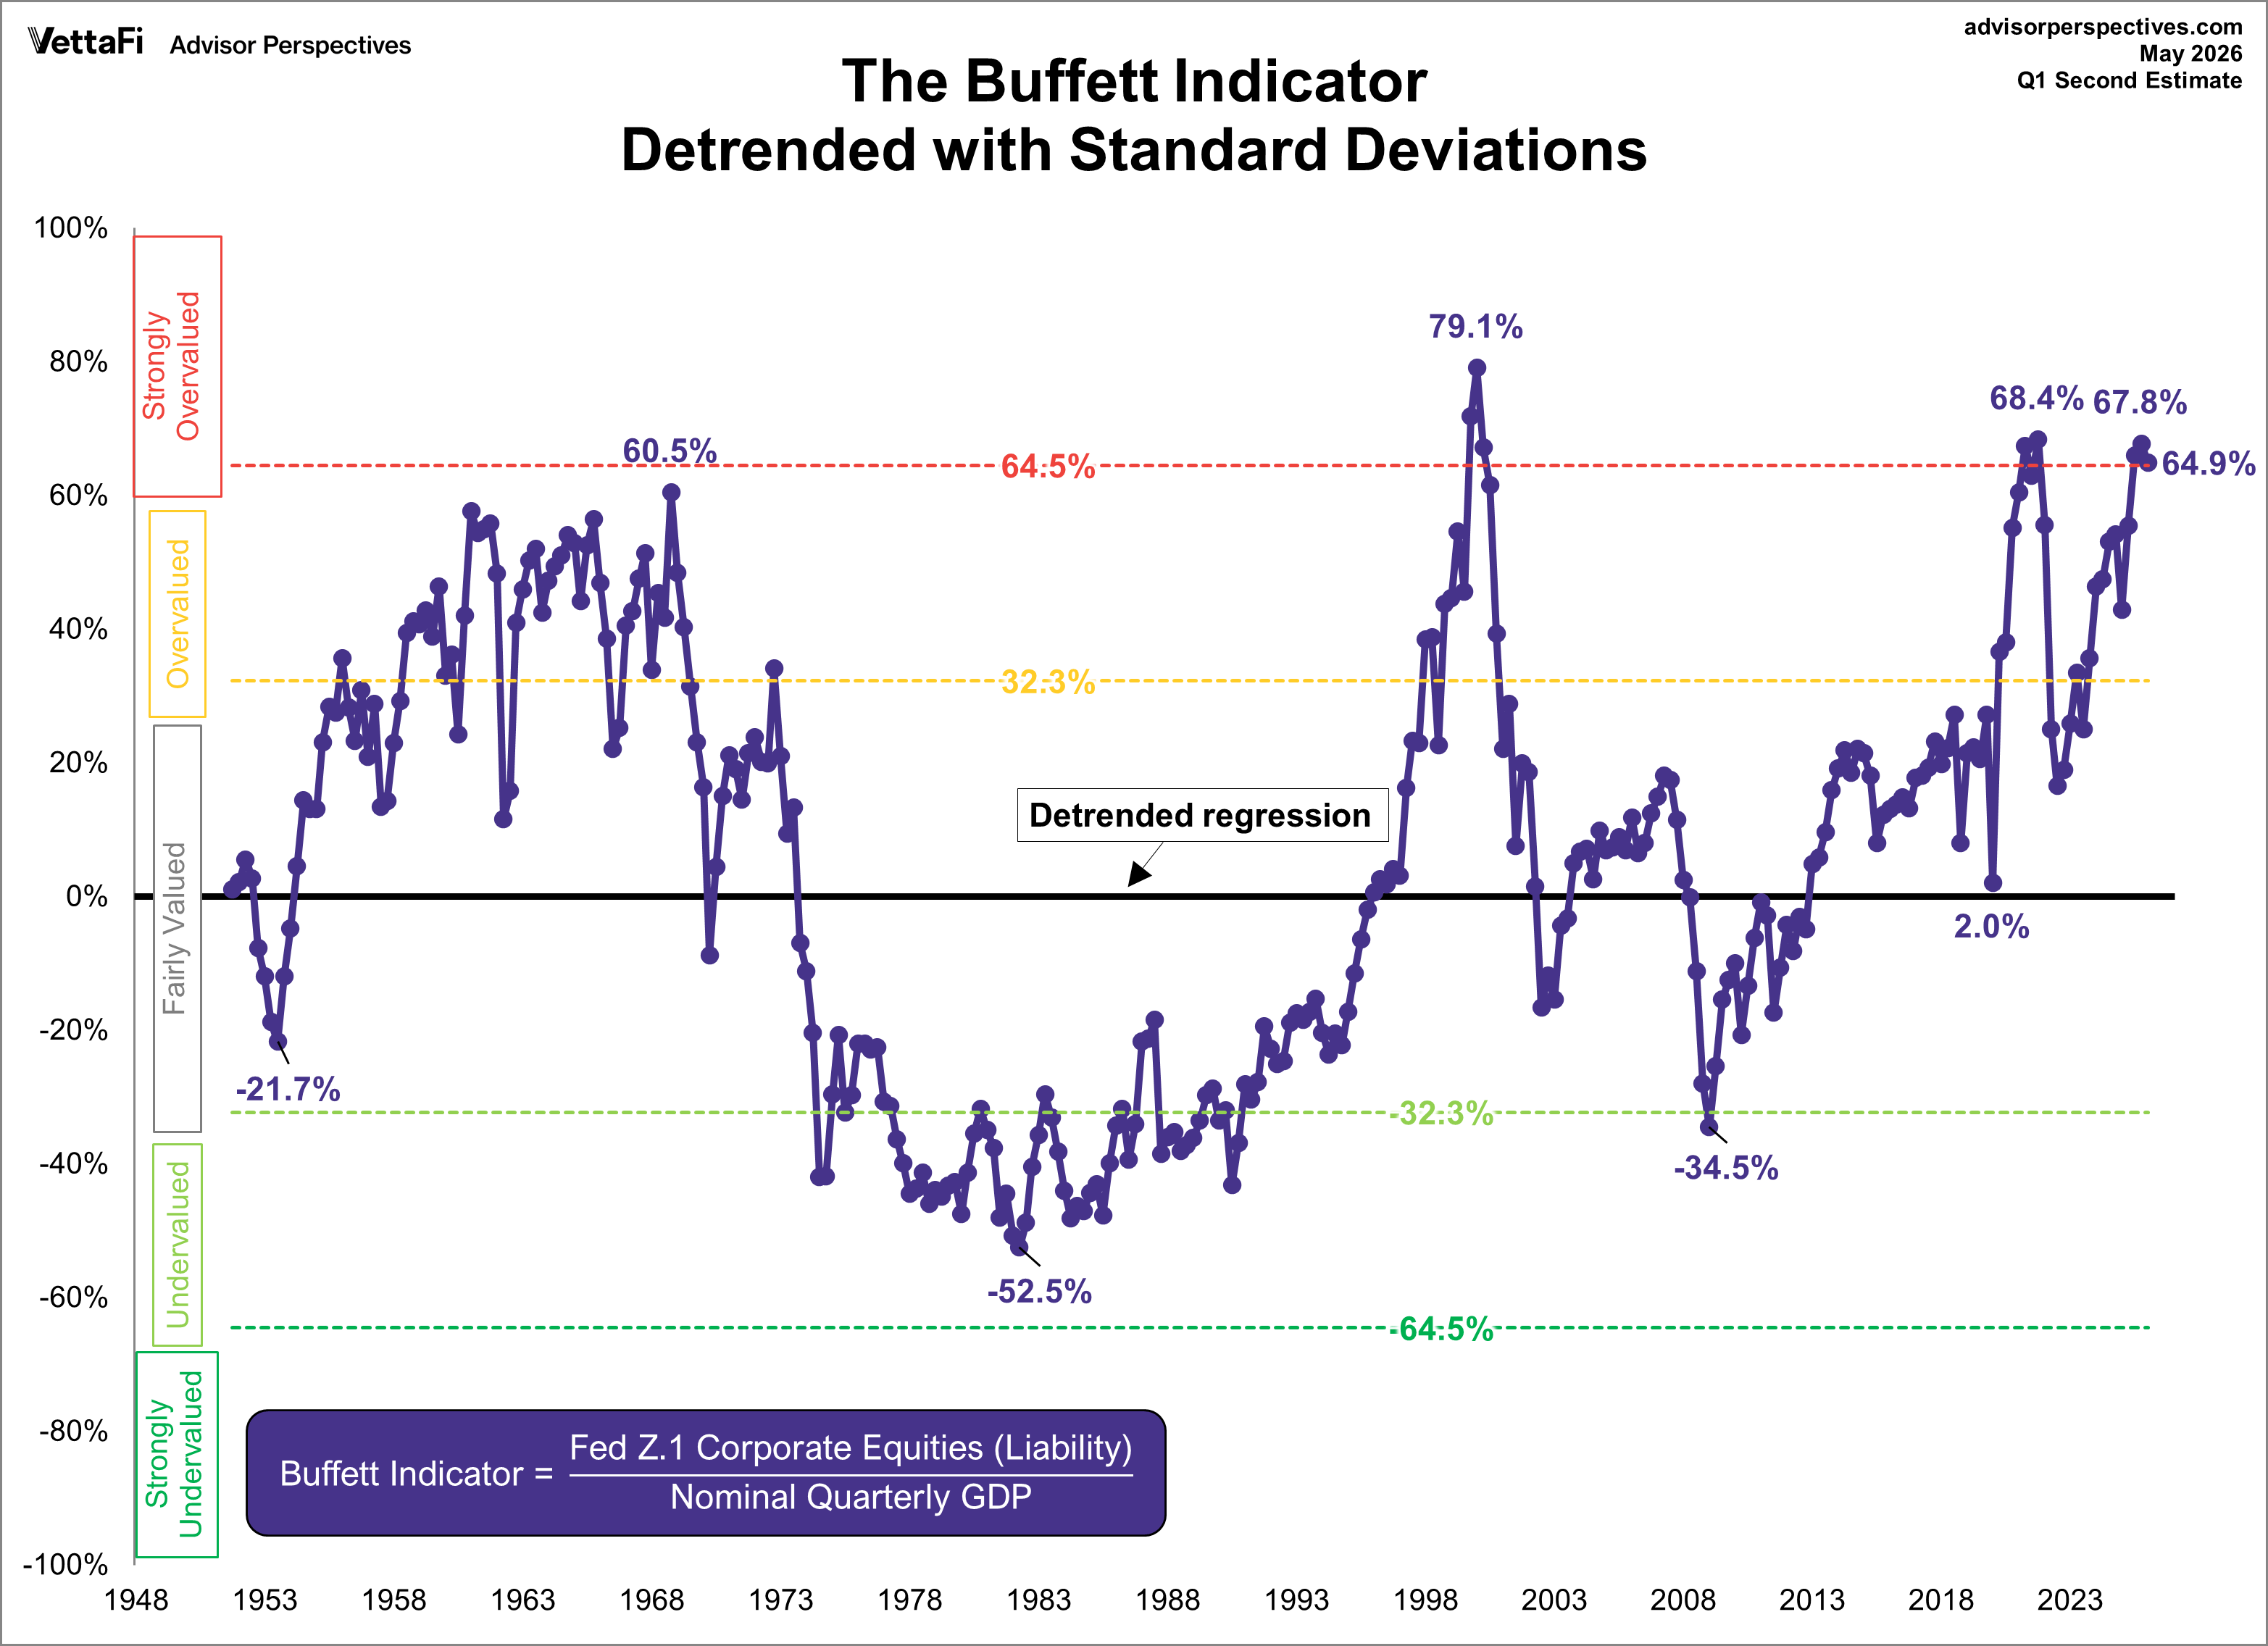
Warren Buffett himself once described this metric as “probably the best single measure of where valuations stand at any given moment,” warning that when it crosses well into the 200% range, you are playing with speculative fire.
When only 4% of stocks are making new highs, it mirrors the exact breath-less market architecture of March 2000. Legendary value investor Jeremy Grantham has long warned about the dangers of narrowing market breadth, noting that when a bull market reduces itself to just a handful of heroic leaders, the structural integrity of the entire trend is compromised.
If you believe that artificial intelligence is a transformative technology but worry that stock prices have decoupled from fundamental reality, the Invesco S&P 500 Equal Weight ETF (RSP) offers an elegant escape hatch.
RSP provides a built-in contrarian rebalancing mechanism. Every quarter, the fund manager must sell down the stocks that have surged in value (trimming overvalued mega-caps like Nvidia and Microsoft) and reallocate that cash into the laggards that are trading at a discount (buying undervalued sectors like financials, industrials, and utilities).
By design, RSP systematically forces you to buy low and sell high. It also boosts your portfolio’s dividend yield to roughly 1.65%, compared to the meager 1.1% offered by the tech-diluted SPY.
If you want to step entirely outside of the Mega-Cap Tech shadow and position your portfolio for a true broad-market rotation, you need to tilt toward small-cap, mid-cap, and dedicated value spaces.
Historically, small-cap value has been one of the highest-performing asset classes over long horizons. However, passive small-cap indexes (like the Russell 2000) are notorious for holding “junk” companies with no earnings. AVUV solves this problem through an engineered, factor-based active approach. It targets small companies that display both deep value characteristics and strong profitability, keeping transaction costs low while screening out financially distressed firms.
Equal weighting is not a rejection of the S&P 500, it’s a smarter, more disciplined way to own it. The same 500 companies. But none of them allowed to run unchecked at bubble-era valuations. For any investor who built their financial foundation on broad index exposure but is quietly uncomfortable with the idea that their “diversified” portfolio is functionally a leveraged bet on Nvidia and a handful of AI-adjacent mega-caps, RSP and the small/mid-cap value ETFs above offer a compelling rebalancing toolkit.
Sources:
Comments
Nothing yet. Say the first thing.
Sign in to join the conversation.