
A few days ago I wanted to find an easy way of plotting the way that the current through an LED changes as you vary the load resistor.
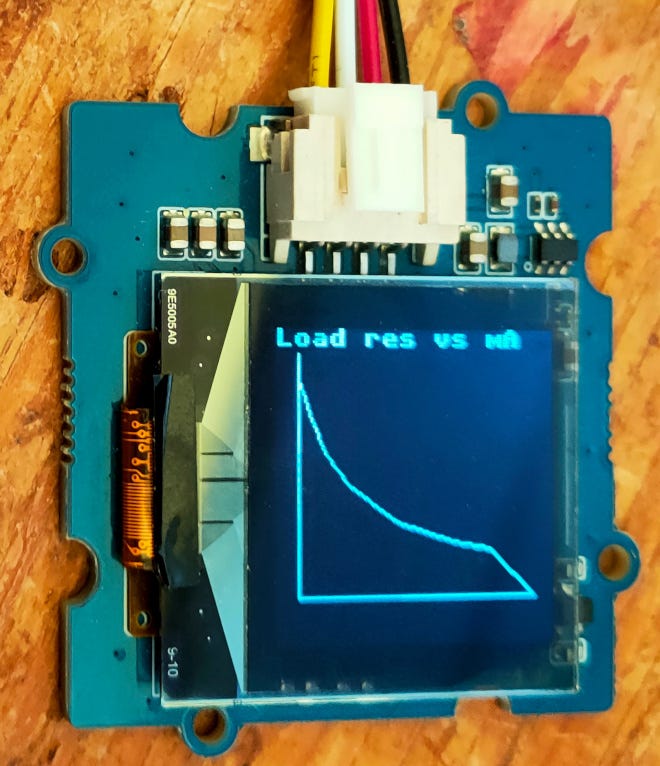
The load resistance increases to the right; the current falls off as the load increases. The current falls to about 6 mA; that's the bottom of the plot.
Here's the tortuous journey to creating the plot.
I quickly wrote some code to plot on the OLED; I wrote about that in last week's newsletter
Then I started work on the hardware. In a senior moment, I forgot the goal.
I spent most of last week plotting LED voltage against current. Interesting, but not what I wanted to see!
Yesterday I realised my mistake and started work on the right setup, showing how current varies with load resistance.
In this post you'll see how I built a project that did the job.
My first attempt hit a snag. I tried to use the Pico's GPIOs to drive the LED, but at full brightness the LED needs 25 mA, and that's way over the limit for a Pico GPIO.
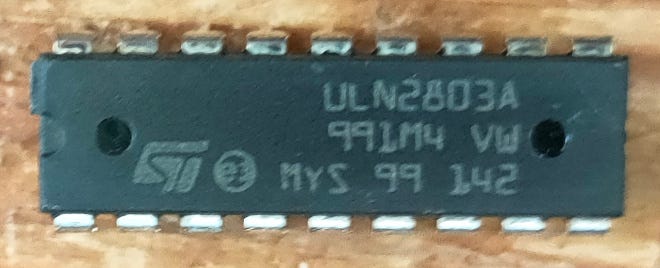
Luckily there's a simple technique for driving LEDs and other heavy loads from the Pi or Pico. It uses an IC (Integrated Circuit) chip called a ULN2803.
The ULN2003 chip has a set of eight Darlington drivers. Each can sink to 500 mA; more than enough for my LED.
The chip has one or two quirks, one of which turned out to be vital for the project.
As I mentioned, each driver can sink up to 500 mA when its output is at 0 volts.
When an output pin is high, it behaves as if the pin is connected through a very high resistance.
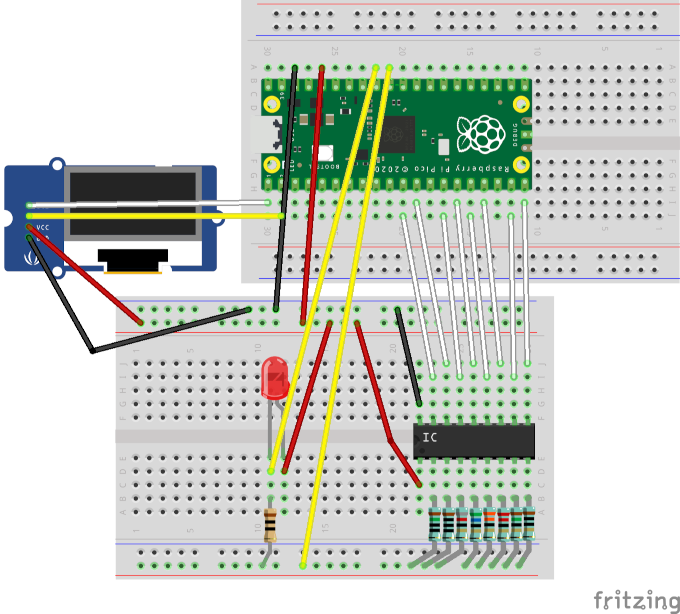
Here's the breadboard layout:
And here's the schematic:
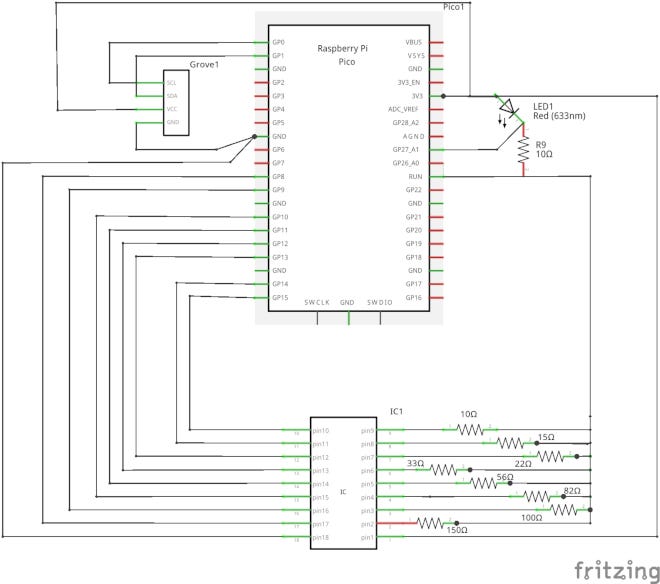
As you can see, the Pico uses GPIO 8-15 to control the eight inputs of the ULN2803A.
When a GPIO pin is low, the corresponding IC output is in high-impedance state.
When a GPIO pin s high, the IC output is at zero volts, and the LED with its two load resistors in series has 3.3 volts across it.
The Pico uses two analogue inputs ADC0 and ADC1 to measure the current through the 10-ohm load resistor.
Here's the micropython code:
from machine import Pin, ADC
from time import sleep
from plotter import  LinePlot
SAMPLES = 8
def volts(adc):
    v = SAMPLES*[0.0]
    for i in range(SAMPLES):
        raw = adc.read_u16()
        v[i] = raw * (3.3 / 65535)
    return sum(v)/SAMPLES
adc0 = ADC(0)
adc1 = ADC(1)
resistors =   [10, 15, 22, 33, 56, 82, 100,  120]
pin_numbers = [15, 14, 13, 12, 11, 10,   9,    8]
pins = [Pin(pin_number, mode=Pin.OUT) for pin_number in pin_numbers]
for pin in pins:
    pin.off()
pins[7].on()
sleep(1)
def measure():
    result = []
    for resistor, pin in zip(resistors, pins):
        pin.on()
        sleep(0.1)
        v0 = volts(adc0)
        v1 = volts(adc1)
        voltage = v1 - v0
        current_ma = 100 * voltage
        result.append([resistor + 10, current_ma])
       # print(3.3 - v1, current_ma)
        pin.off()
    return result
def print_values(values):
    print(' Vl,     mA')
    for v_led, mA in values:
        print(f'{v_led:.2f}, {mA:>5.2f}')
def plot(data):
    lp = LinePlot()
    lp.plot(data, 'LED volts vs mA')
values = measure()
print_values(values)
plot(values)
The code uses a plotting package specific to the OLED used.
You can find all the code on GitHub; details are in the resources section below.
Here are the parts you'll need if you want to build the project.
I had a Pico W available, but any Pico will work. They are widely available from companies like Pimoroni or Adafruit.
Here's the Pico W:
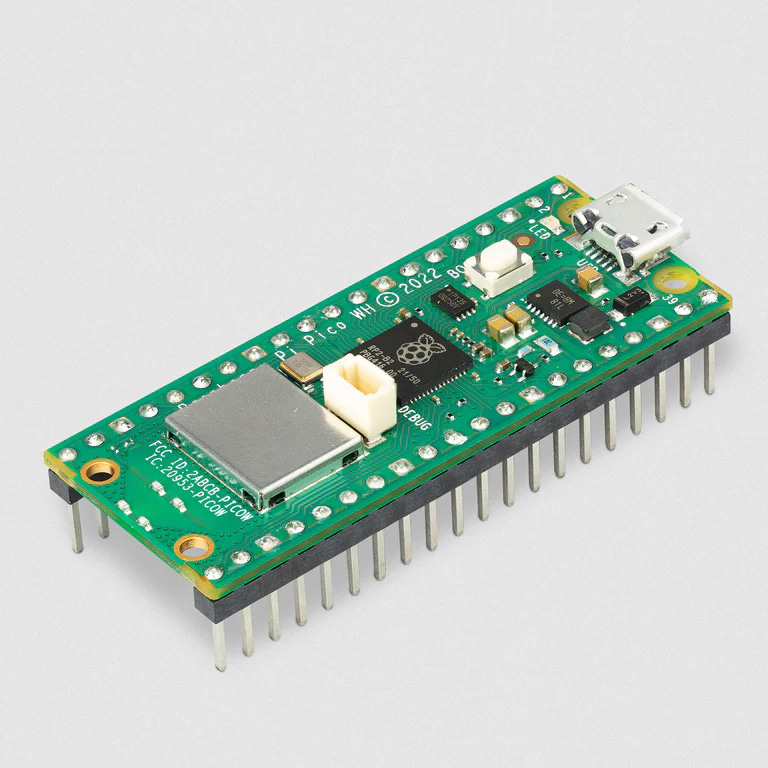
If you're buying one, you can buy it with headers already attached. If you're happy soldering, you can save a little money by soldering the headers yourself.
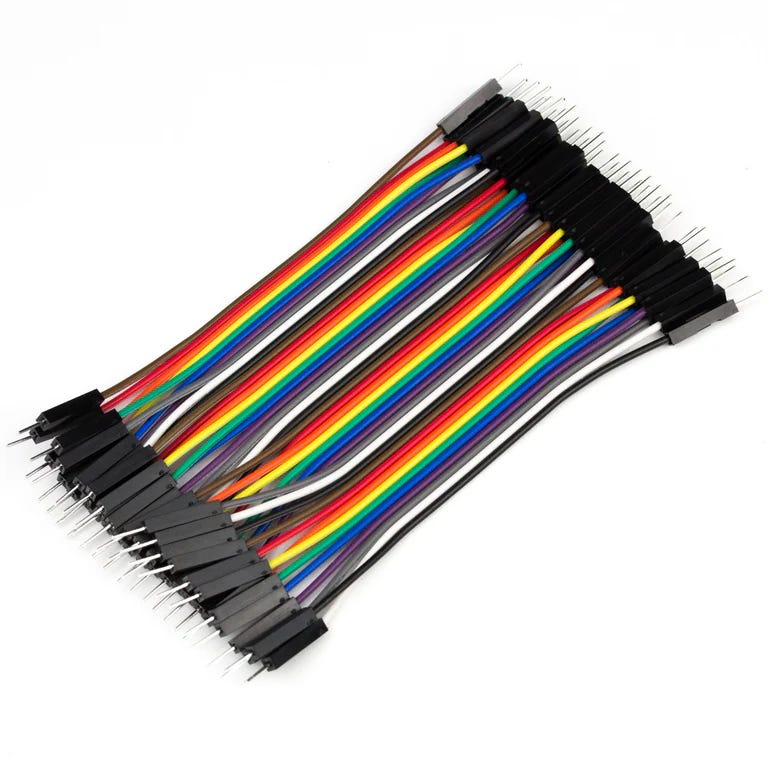
They're also widely available. My advice: don't go for the cheapest. Cheap jump wires are unreliable, and you can waste a lot of time debugging a project when the problem is a poor connection.
I recommend Dupont jump wires from companies like Pimoroni or Adafruit.
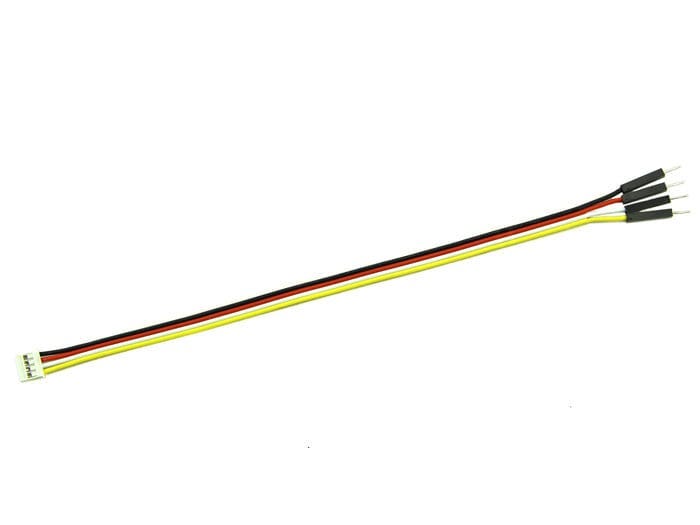
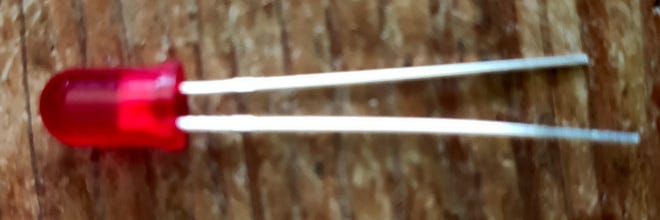
Two 10-ohm resistors. 15, 22, 33, 56, 82, 100 and 120 ohm resistors. One of each.
Two 400-point breadboards
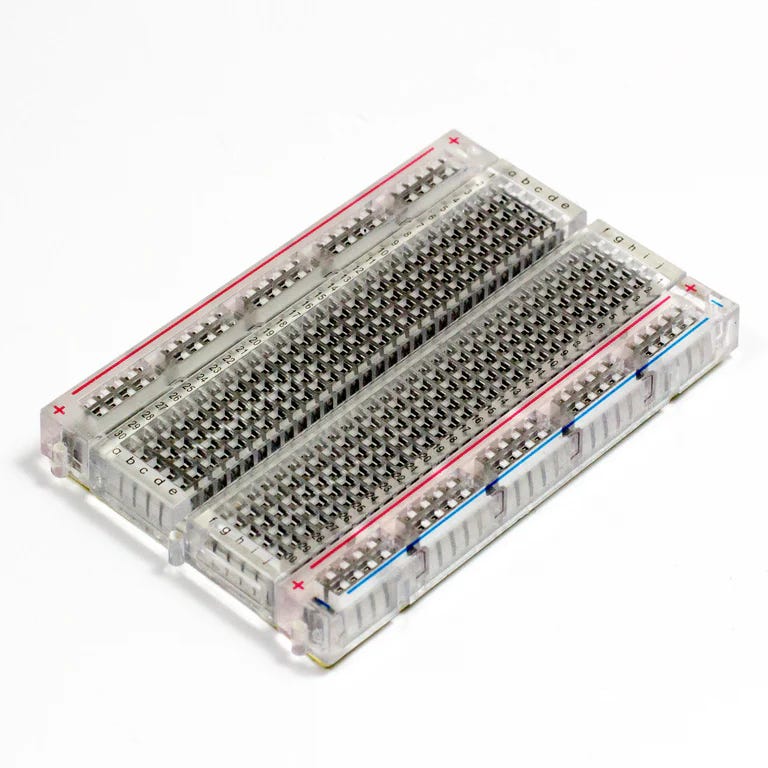
Available from the Pi Hut or Adafruit.
Connect them according to the breadboard diagram above.
The code is available on GitHub in the led_plot\src directory.
When I followed the chain of links from the SH1107 driver that I used, I found micropython-nano-gui, a lightweight and minimal micropython GUI library for display drivers based on the FrameBuffer class.
It's written by Peter Hinch, who has shared several useful libraries for micropython. I plan to experiment and report.
The next series of newsletters will feature the I2C and SPI protocols. They are powerful ways of connecting controllers like the Pi and Pico to a wide range of useful peripherals.
The first newsletter will include a brief overview of I2C and a detailed look at the MCP23008, a versatile port expander that adds eight GPIO pins to a Pi or Pico.
As usual, I'll include details of a fun, useful, and inexpensive project.
If you have questions about this project, spot any errors, or find it useful, please let me know. Your feedback will help me to create the content that readers like you want to see.
If you've just been visiting and liked what you saw, subscribe! You won't be spammed, and the RAREblog is free.
Comments
Nothing yet. Say the first thing.
Sign in to join the conversation.