
For most of the last century, midterm elections have followed a familiar law of American politics: The party holding the White House loses ground in the House.
The size of the defeat varies. The destination, however, has become surprisingly predictable.
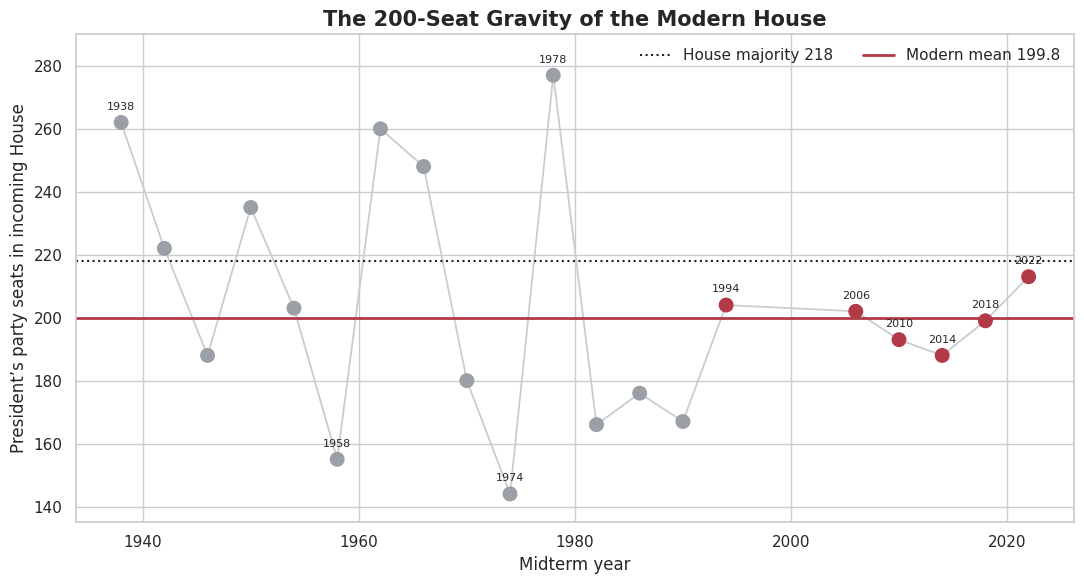
Across the 20 midterm elections from 1938 through 2022 in which the president’s party lost House seats, that party emerged with an average of 204 seats. The median was 200.5.
Thus, the broad historical record points toward a simple benchmark: After suffering a midterm loss, the president’s party has typically held somewhere around 200 to 204 seats.
But history must be handled carefully. The House of the mid-20th century was not the House of today.
In earlier decades, one party could enter an election with a congressional majority so vast that even a public rebuke left it firmly in command. Democrats lost 72 seats in 1938 and still held 262. They lost ground in 1962 and retained 258 elected Democrats. In 1978, despite surrendering seats, Democrats emerged with 278.
Such majorities are almost unimaginable in the modern era.
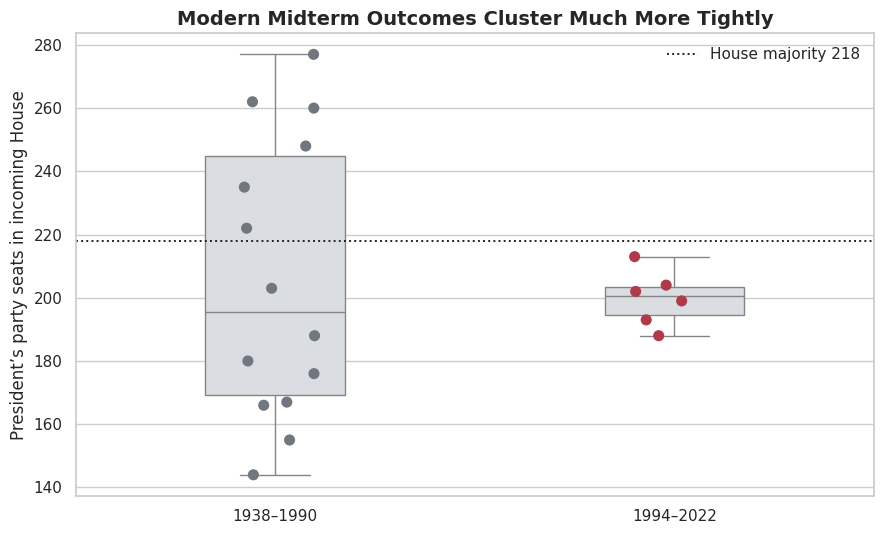
These earlier elections widen the historical range dramatically. Among the 20 losing midterms, the president’s party finished with as many as 278 seats and as few as 144. The standard deviation was roughly 36 seats. Evidence of a political order in which congressional power was distributed far less evenly than it is today.
For understanding the present, the period since 1994 offers a cleaner guide.1
In the six losing midterms from 1994 through 2022, the president’s party finished with 204, 202, 193, 188, 199 and 213 seats. The average was 199.8. The median was 200.5. More important, the standard deviation fell to roughly eight seats.
That is not merely a statistical curiosity. It reveals a modern center of gravity.
When the president’s party loses House seats today, it tends to land near 200. One standard deviation around the modern average produces a benchmark of approximately 192 to 208 seats.
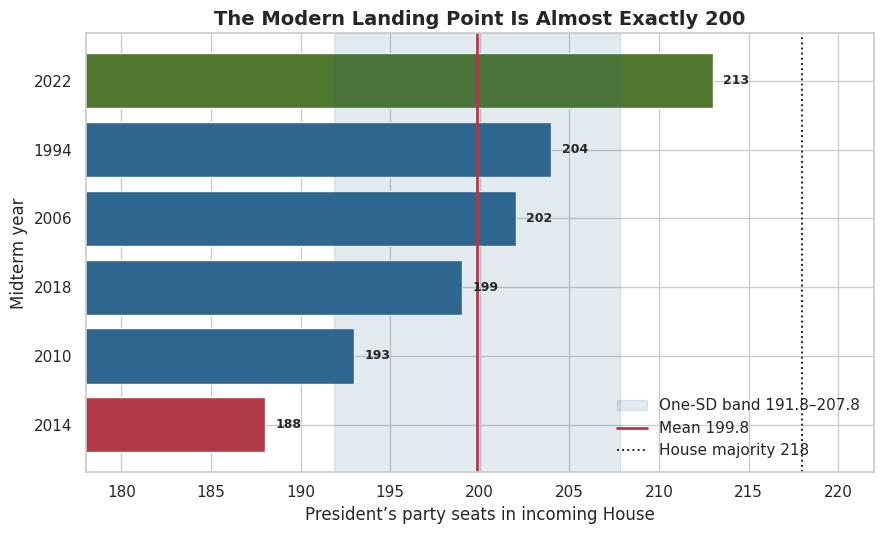
Within this small sample, finishing above roughly 210 constitutes a comparatively strong showing despite the losses. Falling below roughly 192 represents a distinctly weak position.
Several recent elections illustrate the pattern.
In 1994, Democrats were swept from the House majority they had held for four decades yet still won 204 seats. After Republicans lost control in 2006, they retained 202. Republicans emerged from the 2018 midterms with 199.
Those are nearly textbook modern outcomes.
The exceptions are instructive. Democrats finished the 2022 election with 213 seats, the strongest position among the six modern cases, even as Republicans captured control with 222. Democrats fell to 193 seats after the Republican wave of 2010 and then to 188 in 2014.
Yet 2014 was not the more devastating single-election defeat.
Democrats entered that election with only 201 seats and fell to 188. Their lower endpoint reflected a weakened starting position. The 2010 wave was the greater electoral collapse, reducing Democrats from the 257 seats elected in 2008 to 193 in 2010, even though they still finished with five more seats than they would four years later.
This distinction is central.
A party’s final House delegation is determined by two forces: How many seats it possesses before the election and how many it loses.
The catastrophic historical floors demonstrate the same point. Republicans fell to 144 seats in 1974, amid Watergate and the resignation of Richard Nixon. They held only 153 elected Republicans after the recession-era landslide of 1958 and 166 after the 1982 midterms.
Yet these results belonged to a congressional order in which one party could dominate the House for a generation.
That order has vanished.
Today’s House is divided between two closely matched national coalitions. Fewer districts are truly competitive. Ticket-splitting has diminished. Large majorities are difficult to build and, once lost, difficult to reconstruct.
The tight clustering of recent outcomes is consistent with that transformation. But the modern sample remains small. Six elections are enough to reveal a pattern, not enough to establish an iron law.
For evaluating 2026, the post-1994 experience is therefore more useful than the full historical average. The old elections tell us how violent a midterm reaction can become. The modern elections tell us where the president’s party is likely to end up.
That destination is not 240 seats, nor usually 180.
It is approximately 200. The hard gravitational center of the modern House.
Methodology and sources
The final-seat figures use the U.S. House of Representatives Office of the Historian’s initial election results for each incoming Congress, rather than mechanically subtracting a reported net change from the outgoing party total. The House notes that these figures exclude later membership changes caused by deaths, resignations, special elections, contested elections or party switches. (History, Art & Archives)
The American Presidency Project’s midterm series was used to identify elections in which the president’s party gained or lost seats and to cross-check the historical record. Its tables attribute some Progressives or independents to the major party with which they caucused. Because of that convention—and because headline net-change totals may account differently for vacancies or unresolved elections—some historical figures can vary by one or two seats between sources. Those minor discrepancies do not materially alter the article’s finding: The full historical average is about 204 seats, while the post-1994 average is almost exactly 200. (The American Presidency Project)
Seat totals reflect the House Historian’s initial election-result party divisions for the incoming Congress. The modern standard deviation is calculated as a population standard deviation across the six losing midterms from 1994 through 2022.
No posts
Comments
Nothing yet. Say the first thing.
Sign in to join the conversation.