
The Crypto breadth indicators measure the percentage of active cryptocurrencies on CoinMarketCap.com, both coins and tokens, that are above their X-dma (daily moving average). Backtest results showed that the 50-day moving average is the best to use over the 100- and 200-day moving averages. It is fast enough to catch sentiment shifts early and best captures the moment when momentum has reached a critical mass, starting a rally or accelerating a decline. In fact, the results showed that using the indicator to time entries and exits in Bitcoin outperformed a buy-and-hold strategy.
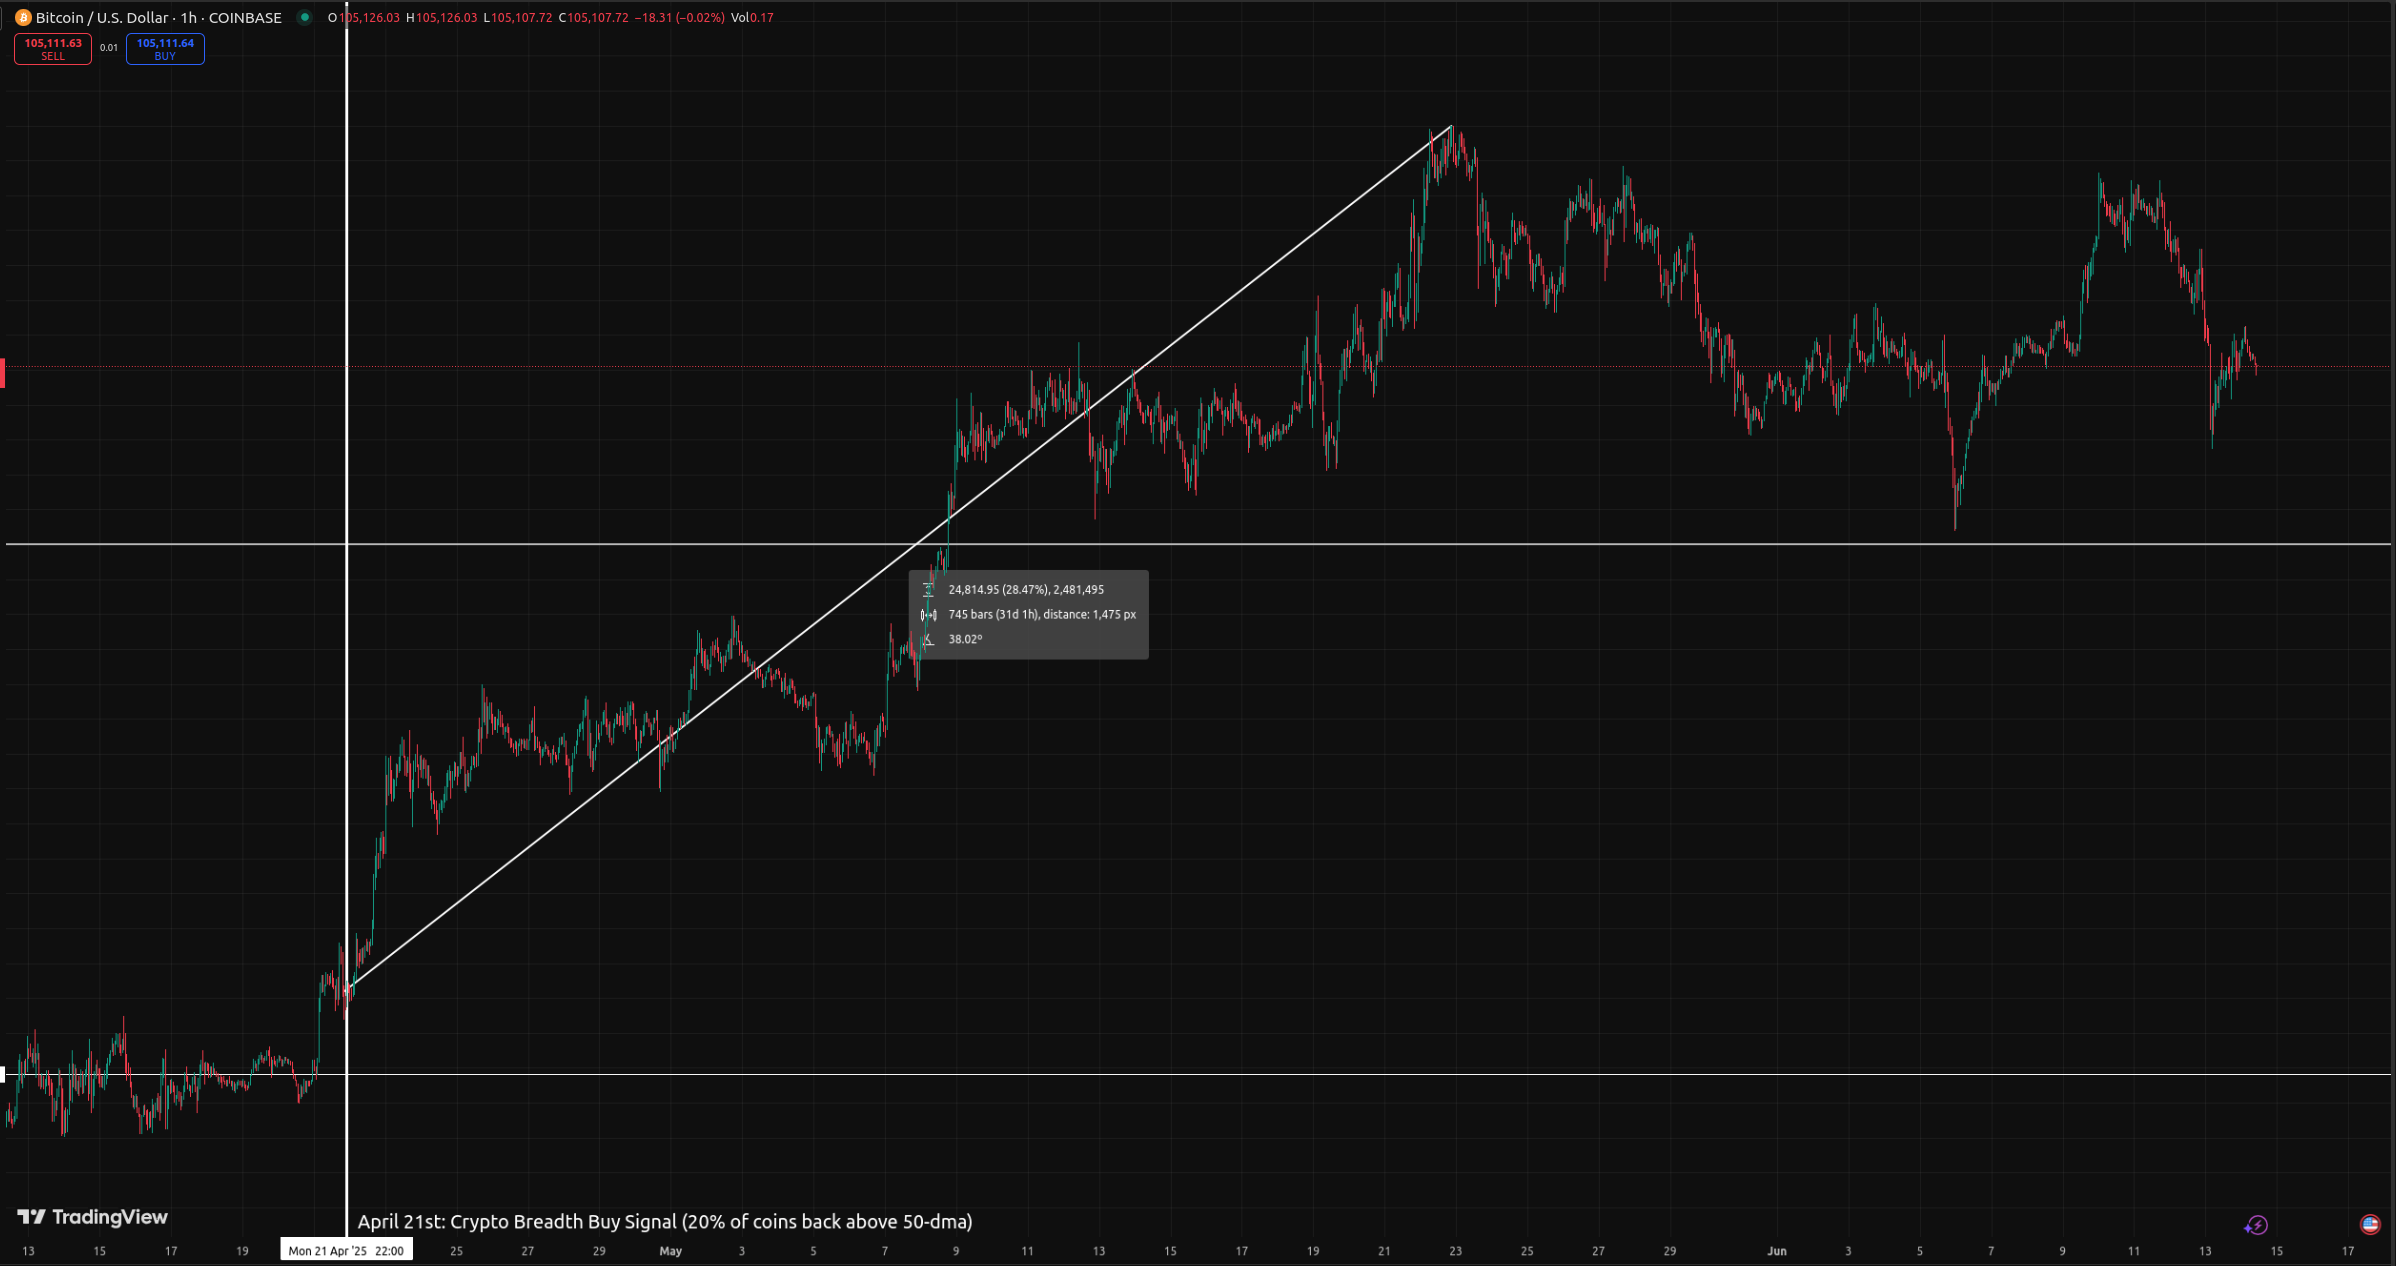
In April, Crypto fell along with other asset classes during the Liberation Day tariffs-led market rout. On the 21st of April, 21% of cryptocurrencies were back above their 50-dma, signaling that it was a good time to buy Bitcoin. Here’s Bitcoin since then. It’s up ~28.5%.
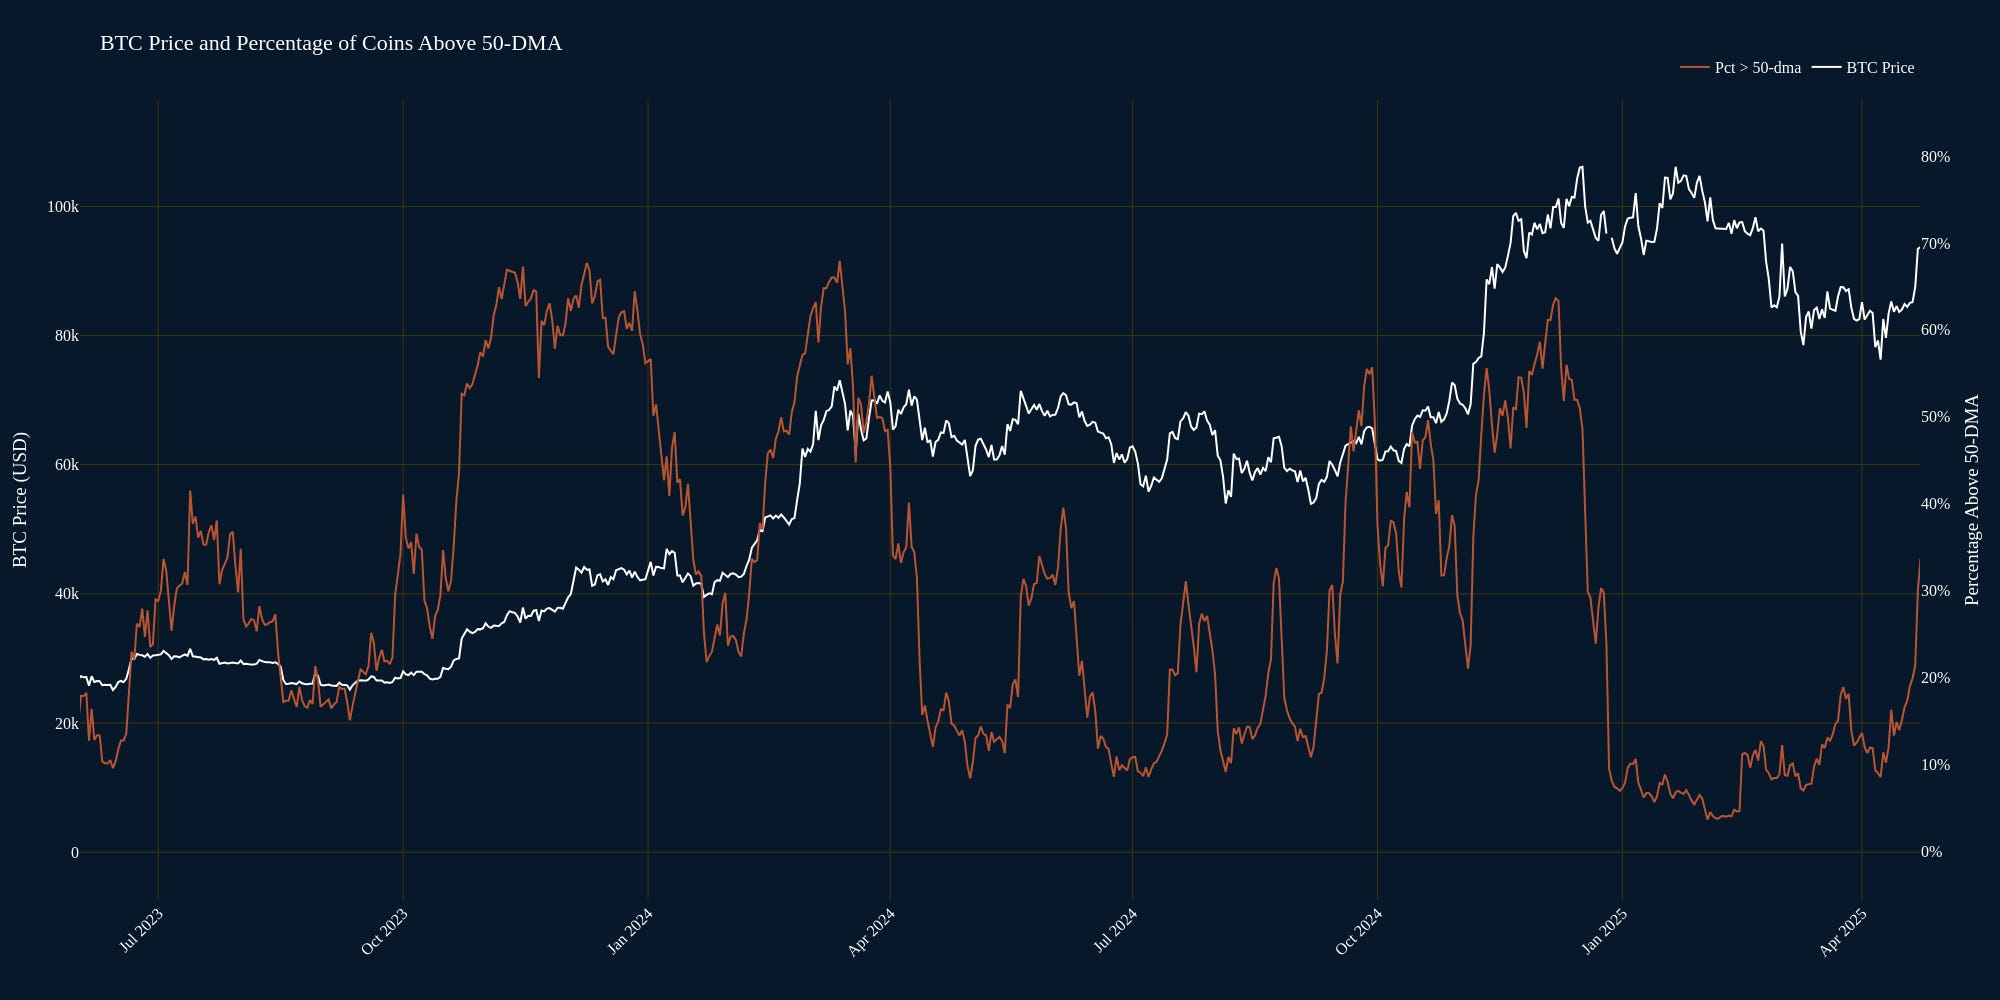
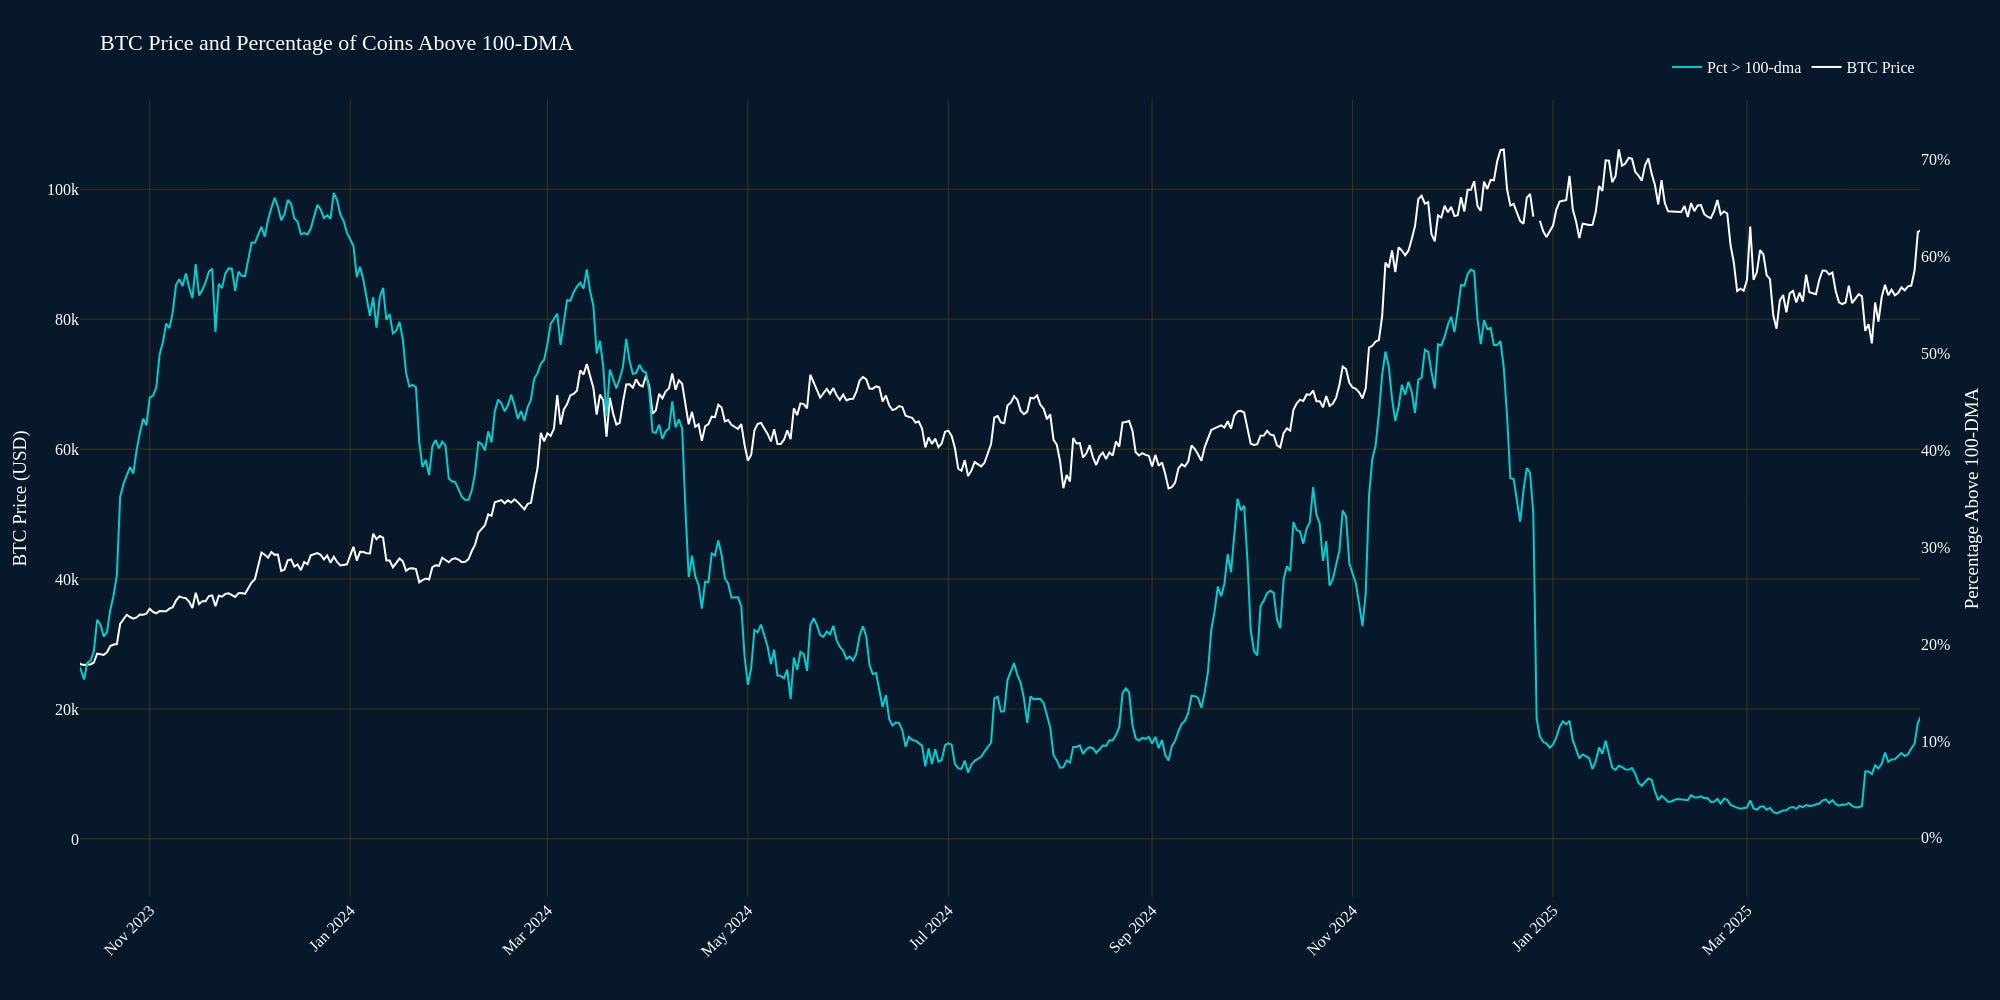
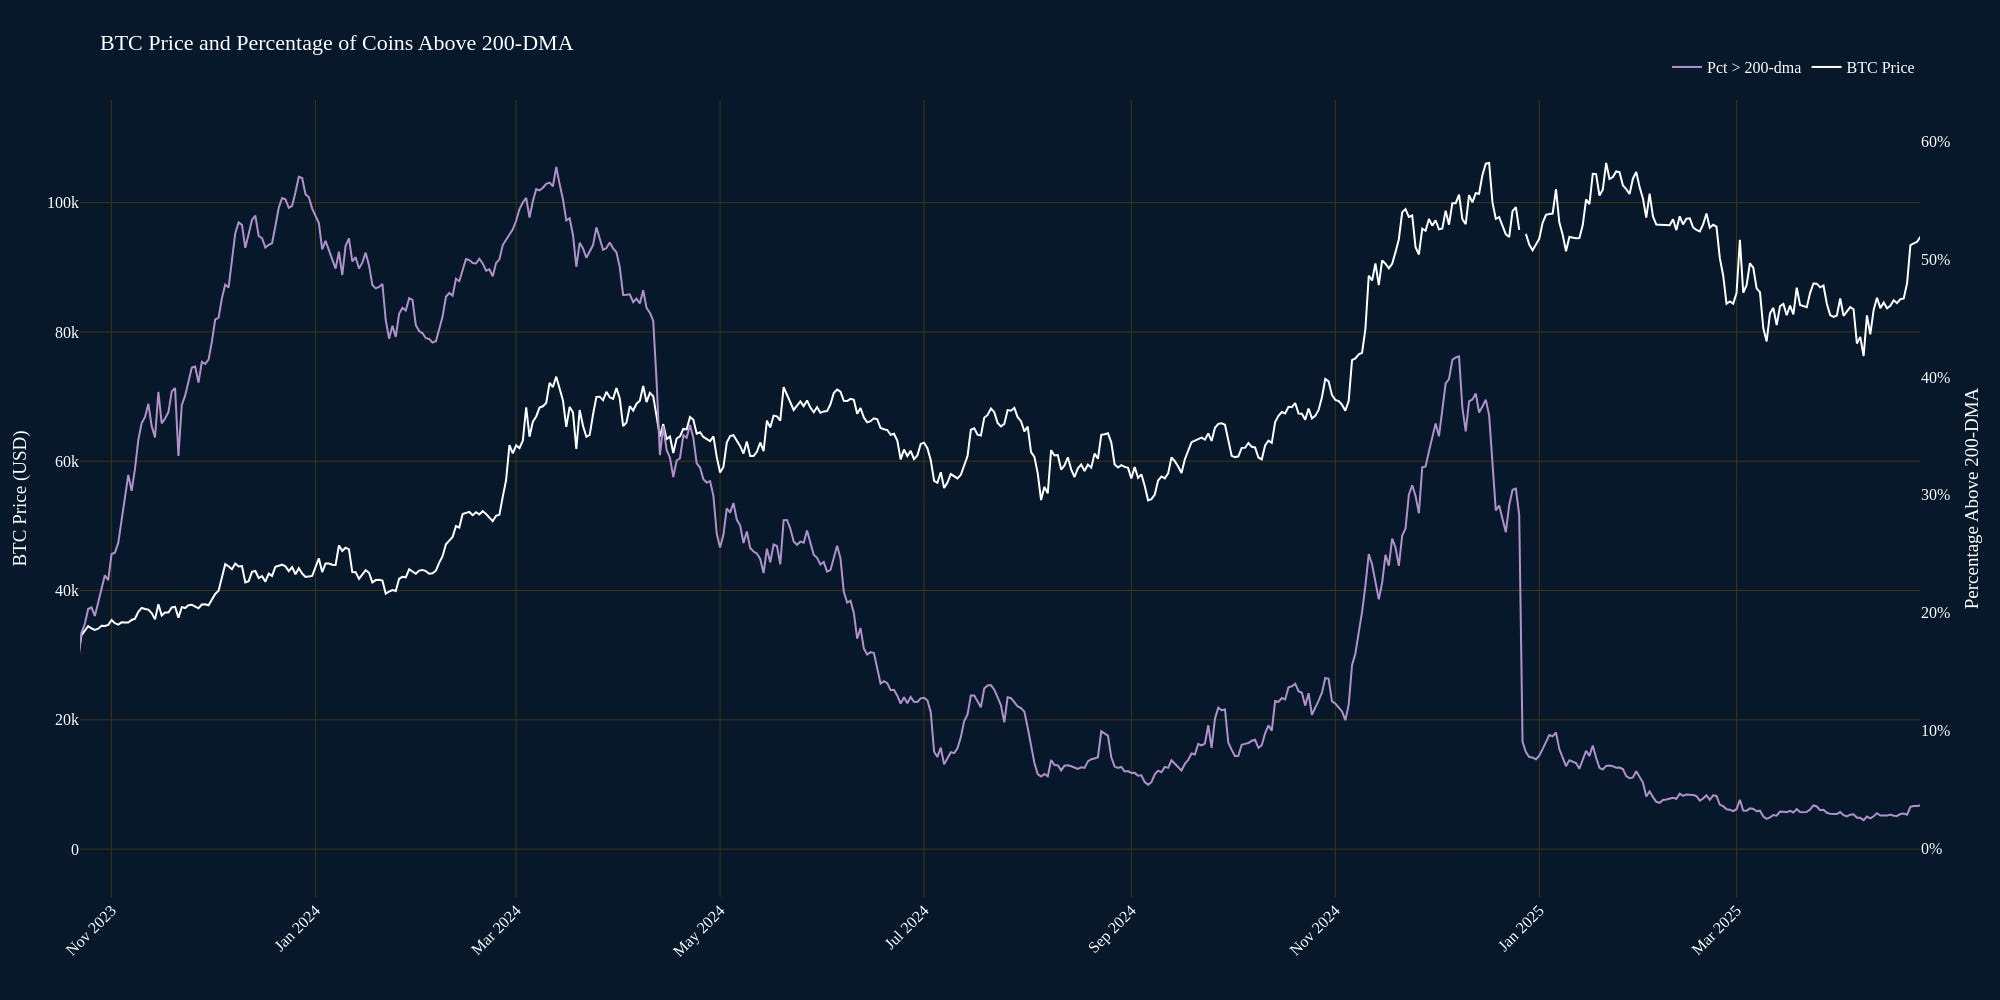
The 100-dma and 200-dma are slow. While the 100-dma also gives profitable signals, the returns are lower than the 50-dma’s signals. The 200-dma is completely useless. Here are the respective charts.
Comments
Nothing yet. Say the first thing.
Sign in to join the conversation.