
The Problem
A stock trading at six times earnings looks like an opportunity. For most businesses that instinct is at least a starting point for work. For a cyclical business it is usually a warning. The warning concerns the denominator. Those earnings sit at a high the industry has never sustained, and buying the stock means watching the earnings fall to meet the multiple instead of watching the multiple expand to meet the price.
The multiple runs backward. Cyclical businesses look cheapest at the top of the cycle, when margins are fat, capacity is tight, and earnings have reached a level no previous cycle held for long. They look most expensive at the bottom, when earnings are depressed or negative and the price-to-earnings ratio is enormous or simply meaningless. An investor applying ordinary P/E intuition to a cyclical will be drawn in at the peak and repelled at the trough. That is the wrong behavior at both ends.
The mechanism explains why the pattern repeats. In a cyclical business, prices and volumes are set by the balance of supply and demand across an entire industry, and no single company controls them. When demand outruns installed capacity, prices spike. Most of that incremental revenue drops straight to the bottom line, because the cost base is largely fixed, so margins and earnings rise far faster than revenue does. The earnings spike is real. It is also temporary, because those same high prices summon the new capacity that eventually erases them.
Micron’s fiscal 2022 illustrates the magnitude. The company earned $8.7 billion of net income on $30.8 billion of revenue. One year later it reported a net loss of $5.8 billion on revenue of $15.5 billion, with gross margin turning negative. Nothing about the business had been misunderstood. The cycle simply turned.
Valuing a cyclical requires a different question from the one that works on a stable business. What does this company earn in an average year across a full cycle, including the bad ones? Everything below is an attempt to answer that. What makes a business cyclical, where the cycles come from, and how to normalize earnings before applying any multiple or model to them.
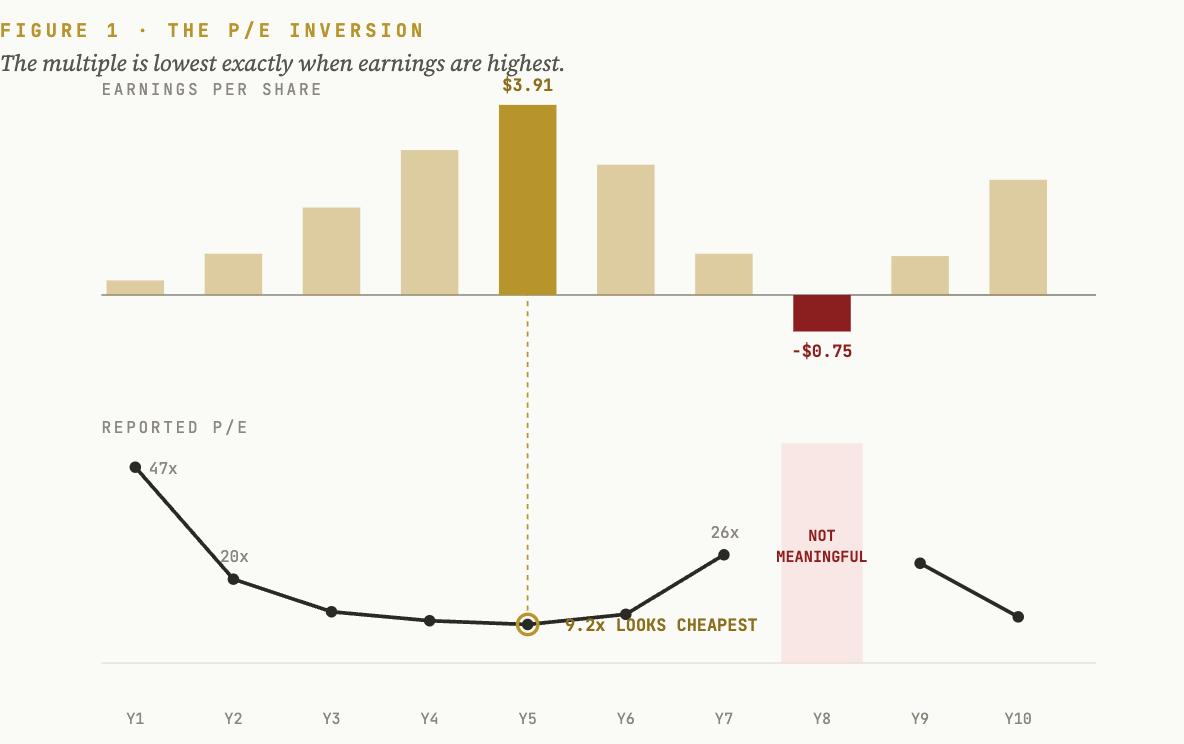
The multiple is lowest when earnings are highest.
The Definition
A cyclical business is one whose revenue and profitability swing substantially with a repeating cycle, usually the balance of industry supply and demand, often amplified by the wider economy. The defining feature is mean reversion. Good years end and bad years end, and the business oscillates around a long-run average. It does not trend steadily upward. Semiconductors, memory, commodities, autos, housing, airlines, shipping, steel, and capital equipment are the classic examples.
Three confusions are worth clearing. A cyclical is not automatically a bad business, and some earn excellent through-cycle returns under genuinely capable management. A cyclical is not a declining business, where the mean itself is falling, and that distinction matters enough to have its own section below. And cyclicality is not the same thing as a volatile share price. The cyclicality that matters lives in the earnings.
Cyclicality is a matter of degree. At one end sit businesses whose earnings barely register the economy at all, such as a ratings agency, a payments network, or a diagnostics razor-and-blade model. At the other sit memory manufacturers and shipping companies, which can travel from record profit to outright loss inside two years. Most businesses fall somewhere between, and the practical question is always how much of the current earnings figure is cycle and how much is structure. Every valuation method, from a simple multiple to a full discounted cash flow, takes a level of earnings as its input. Get that level wrong and the answer is wrong by the same magnitude. The input is where cyclical valuations fail, and the method is usually blameless.
The Engine
Cycles are manufactured by capacity decisions. Demand rises against a fixed stock of capacity, so prices rise and margins expand sharply. High margins and confident forecasts prompt every producer in the industry to invest at once, because each is responding to the same visible signal. That capacity takes years to build, whether it is a fab, a mine, a ship, or a plant, so it arrives long after the demand that justified it and often after that demand has already cooled. Supply then exceeds demand, prices fall, margins compress, and the industry stops investing. Which sets up the next shortage.
Two features make the loop reliably violent. The first is lag. Because capacity takes years to arrive, every investment decision is made on information that has gone stale by the time the plant opens. The second is simultaneity. Every producer sees the same high prices and reaches the same conclusion, so capacity arrives in waves. The industry therefore develops a systematic tendency to overbuild at the worst available moment.
Operating leverage amplifies all of it. Cyclical businesses tend to carry heavy fixed costs, so a modest change in volume or price produces a large change in profit. This is why cyclical earnings swing much harder than cyclical revenue does, and why a company can travel from record profit to loss on a revenue decline that would look survivable in isolation. Financial leverage compounds the effect again. The most indebted operators in a cyclical industry are rarely the ones that emerge intact.
The useful consequence is that the cycle announces itself in advance. Capacity decisions are public. Industry capital expenditure announcements, utilization rates, inventory levels, and pricing behavior are all observable well before the earnings that eventually follow from them. Rising industry-wide capital expenditure at peak margins is the clearest warning available that the peak is near, and it is the same signal in every cycle and every industry.
Micron’s own releases record the pattern twice. The company reported a 61.0% gross margin in the fourth quarter of fiscal 2018, and net capital expenditure for that fiscal year reached $8.20 billion. Fiscal 2022 ran the same shape four years later: record revenue of $30.8 billion, net capital expenditure of $11.98 billion, and a fourth quarter in which revenue fell to $6.64 billion from $8.64 billion three months earlier. The release announcing the record year also announced a wafer fab equipment capex cut of nearly 50%. Both facts sat in the same document.
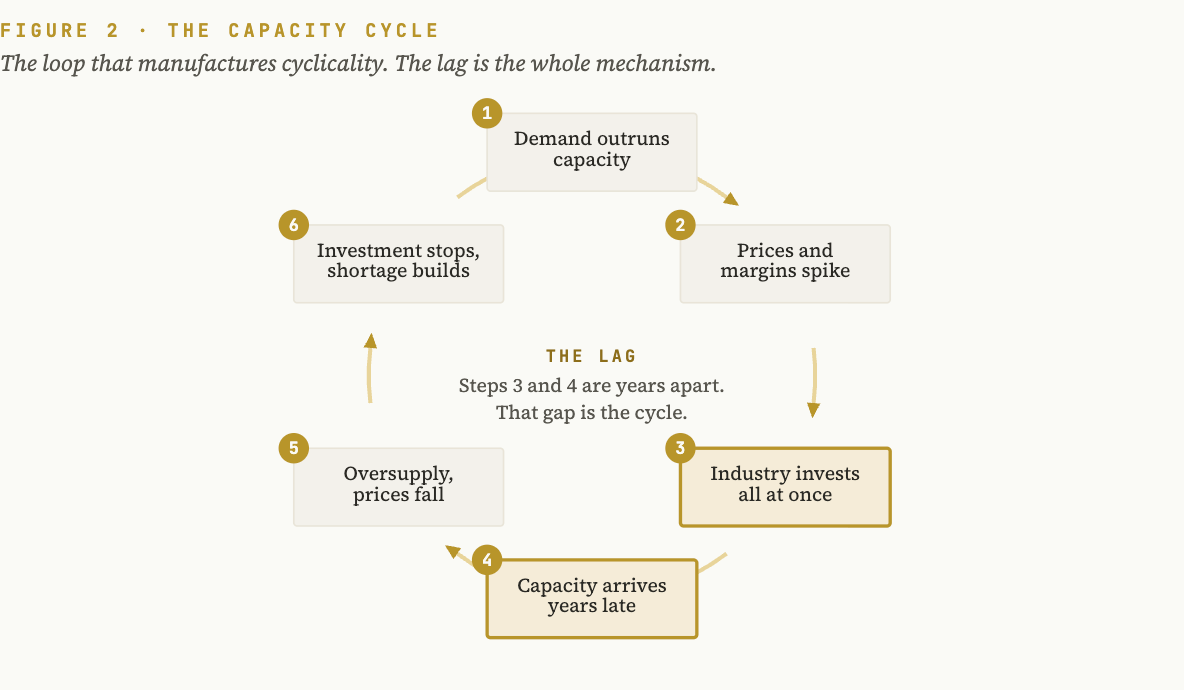
The loop that manufactures cyclicality. The lag is the whole mechanism.
The Method
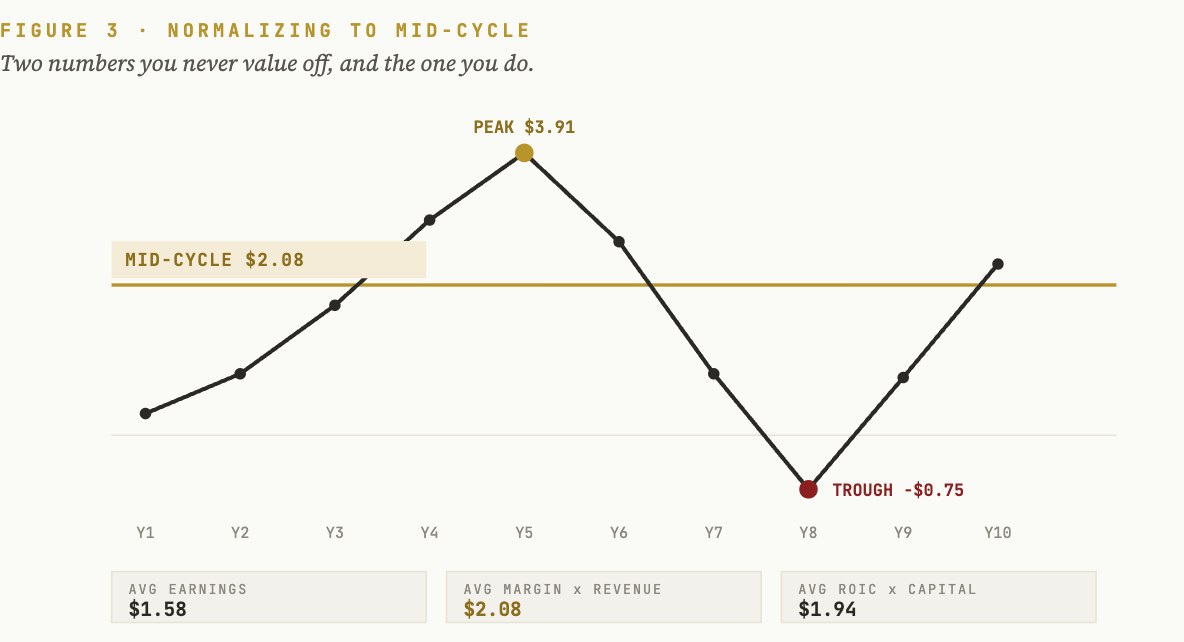
Normalization means estimating what a business earns in an average year across a full cycle. Not the best year and not the worst. Every valuation of a cyclical should run off that number, and three approaches produce it. They disagree with each other, and the disagreement is useful.
Approach 1 — Average the earnings across a full cycle. The simplest method. Take the business’s earnings, preferably owner earnings, across a window long enough to contain at least one complete peak and one complete trough, commonly seven to ten years, and average them. The judgment that decides the answer is the window. Averaging the last five years of a boom produces a normalized figure that is still a peak figure, and the arithmetic will never tell you so. The owner-earnings definition is set out in full elsewhere.
Approach 2 — Normalize the margin, then apply it to current revenue. More precise, and usually the better choice for a business that has grown. Compute the average operating or net margin across a full cycle, then apply that average to current revenue. The correction is for size. Averaging raw dollar earnings across ten years understates a company that is materially larger today than it was at the start of the window, and understates it by roughly the amount it has grown. Where the business has expanded, prefer this one.
Approach 3 — Normalize the return on capital. For capital-intensive cyclicals, estimate mid-cycle earnings as the through-cycle average return on invested capital applied to current invested capital. This anchors the estimate to the capital actually deployed, which helps where margins have been distorted by acquisitions or asset sales. It also produces a figure worth reading alone. The gap between peak return on invested capital and trough return on invested capital is the cleanest single measure of how cyclical a business really is.
The spread between the three is information. Run all three. On a representative ten-year series with revenue compounding at 6% a year and net margins swinging from 31% to negative 5%, the three approaches produce normalized earnings per share of $1.58, $2.08, and $1.94. The widest figure exceeds the narrowest by roughly a third. That spread measures how much of the answer comes from the business and how much comes from the method, and a wide spread argues for a wider margin of safety. A tight cluster is a modest piece of evidence that the normalization is describing something real.
The adjustment for structural change. Averaging assumes the next cycle resembles the last one. Sometimes it does not. If the business or the industry has genuinely changed, through a mix shift toward recurring revenue, consolidation that reduced competitive intensity, or a durable technology shift, the historical average understates the new normal. If the moat has weakened, it overstates it. Make the adjustment explicitly and state the reasoning, because a silently chosen window is the most common route by which a normalization arrives at a predetermined answer.
The arithmetic shows how much the window decides. On the same ten-year series, a five-year window ending at the cycle peak returns $2.80 of normalized earnings per share against $2.08 for the full decade, an overstatement of 35%. A five-year window ending at the most recent year returns $1.35, understating by almost exactly the same proportion. Both look like normalization. Only one of them contains a cycle.
Once the number exists, apply the multiple or the model to it. A cyclical trading at six times peak earnings, where peak earnings run three times the through-cycle average, is trading at eighteen times mid-cycle earnings. Same price. Completely different conclusion. In a shallower cycle, where the peak sits closer to twice the average, that same six times becomes eleven or twelve, which is less dramatic and still enough to change a decision. A reverse discounted cash flow, which solves for the growth rate the current price already assumes, has to run off the normalized figure as well. Run it on peak earnings and the implied growth rate it returns describes a company that does not exist.
The Distinction
Everything above assumes the cycle mean-reverts. The most expensive error in cyclical investing is made when it does not. At the bottom of a cycle and in permanent structural decline, the financials look nearly identical: falling revenue, collapsing margins, losses, a depressed share price, and a management team describing conditions as temporary. One buyer is early to a recovery. The other is buying a business that will never earn its old numbers again. Telling them apart is the entire task at the bottom.
Is demand deferred or disappearing? In a genuine trough, buyers are waiting. In structural decline they are leaving, and the demand is migrating permanently to a substitute. The test is unit volumes measured peak to peak across several cycles. If each successive peak sits below the last, the mean is falling and this is not a cycle.
Is capacity leaving the industry? The self-correcting mechanism of a true cycle is exit. Capacity closes during the downturn, supply tightens, and the next shortage builds itself. When capacity is closing and capital investment has stopped, the cycle is working as designed. When capacity persists, because it is subsidized, strategically protected, or too costly to shut, the trough can last far longer than the arithmetic of past cycles suggests.
Is the competitive position intact? A cyclical downturn should not change relative standing. The best operator at the peak is still the best operator at the bottom, running the lowest-cost assets and holding its customers. Share loss, pricing loss, or technological displacement during a downturn points to something other than the cycle. The moat trajectory framework applies directly here and is set out in full elsewhere.
Can the balance sheet survive the wait? This is the question that decides outcomes. A recovery is worthless to an equity holder who has been diluted or wiped out before it arrives. Check net debt against normalized earnings, read the maturity schedule, and model the cash burn under trough conditions. Peak earnings flatter every leverage ratio, which is precisely why the check has to run off the normalized figure. Heavily indebted cyclicals do not merely underperform in a downturn. They permanently impair the equity.
Micron’s fiscal 2018 release records the other half of that discipline. During that year the company repurchased or converted $6.96 billion principal amount of debt, cut the carrying value of total debt to $4.64 billion, and finished in a record net cash position of $2.72 billion. Five fiscal years later it absorbed an annual loss of $5.83 billion and stayed solvent. The deleveraging happened at the top, when cash was abundant and the balance sheet looked over-capitalized. That is the only time it is ever easy.
The asymmetry settles the ambiguous cases. Missing a genuine cyclical recovery costs an opportunity, and opportunities are replaceable. Mistaking a structural decline for a trough costs capital permanently, and capital is not. Where the evidence will not resolve, that asymmetry argues for requiring evidence of mean reversion before assuming it. The peak-earnings cyclical is a recognized trap with a documented tell, catalogued in the reverse DCF piece.
The Quality Question
The quality framework favors durable moats, high and stable returns on capital, and long reinvestment runways. A cyclical business violates the stability requirement by definition. One that earns 35% returns on capital at the peak and loses money at the trough resembles a compounder in neither year, and the temptation is to rule the entire category out. That rule would be far easier to apply than to defend. Some cyclicals genuinely compound.
The test is what the business earns on capital across a full cycle. A cyclical whose through-cycle average return on invested capital comfortably exceeds its cost of capital, and whose successive peaks and successive troughs both trend higher, is creating value while it oscillates. One whose through-cycle average barely covers its cost of capital spends the good years earning back what the bad years consumed, and compounds nothing across a decade of effort. The presence of a cycle decides very little. The through-cycle return decides almost everything.
Four features separate the ownable cyclicals from the tradable ones. A structural cost advantage that keeps the business profitable at the trough while competitors are not. A consolidated industry where capacity discipline showed up in the last downturn and can be checked in the filings. A growing recurring or aftermarket revenue layer that dampens the swing. And a balance sheet conservative enough that a downturn becomes a chance to take share while competitors are raising emergency equity. The fourth does most of the work.
The four are not equally easy to assess, and that matters for the order in which to test them. Cost position, industry structure, and revenue mix each take a year of industry study to judge properly. The balance sheet takes an afternoon. Net debt measured against through-cycle average earnings, read alongside the maturity schedule, settles the survivability question from public filings alone. Begin with the cheap test, because it is the one that disqualifies.
Quality changes the treatment without removing the cycle. A high-quality cyclical still warrants a wider margin of safety than a stable compounder would, because the normalized earnings estimate carries more uncertainty than a trailing figure does. It still needs a normalized valuation as its anchor. And the entry point matters far more than it does for a business whose earnings compound smoothly, because a stable compounder forgives a mistimed purchase within a few years, while a cyclical can take most of a decade to do the same.
The Discipline
Never value a cyclical on trailing earnings. Normalize to mid-cycle, apply the multiple or the model to that figure, and require a wider margin of safety than a stable business would need, because the normalized estimate is itself an estimate. Watch industry capacity alongside company results. Rising industry capital expenditure at peak margins remains the most reliable warning available that the peak is near.
Timing a cycle is close to impossible, and nothing above attempts it. That is the point. What normalization provides is a defense against paying peak prices for peak earnings, which is the error that actually destroys capital. An investor who buys a good cyclical business at a genuine discount to normalized value will do well without ever having called the turn. Calling the turn is a separate skill, and most of the people who claim it are describing luck.
Holding the discipline is harder than stating it. It requires passing on a business at six times earnings, and articulating why a low multiple on peak earnings is a warning, usually while the share price keeps rising. That argument holds only if the normalized number was written down before the price became interesting. Compute it early. Its value collapses once there is a position to defend.
Return on invested capital identifies whether a business creates value, and for a cyclical the question becomes whether it does so across the cycle instead of at one chosen point within it. Owner earnings measures what the business produces for the people who own it, and for a cyclical that measurement means nothing until it has been normalized. The frameworks all survive contact with a cycle. The cycle simply changes the input each one requires.
The largest cyclical question in markets today is the artificial-intelligence infrastructure buildout. Hundreds of billions of dollars of capital expenditure are flowing into a supply chain whose current earnings almost certainly represent a peak. The discipline above is how to think about it. The thematic report published yesterday applies that discipline name by name: which AI-infrastructure businesses have moats durable enough to survive the digestion of the capex wave, which are priced on peak earnings alone, and what each is worth on a normalized basis.
Quality Equities publishes independent research for informational purposes only. Nothing published constitutes investment advice or a recommendation to buy or sell any security. The author may hold positions in securities discussed.
No posts
Comments
Nothing yet. Say the first thing.
Sign in to join the conversation.