
There have been moments over the years when our Prospero signals start flashing red warning signs while the market is still flashing green.
Right now is one of those moments.
If you looked only at the major indexes over the last month, you would think we’re in good shape. The market’s had some volatility, but the QQQ is up roughly +2% and SPY +2.5% over the last 30 days. Despite the war in Iran, the most recent economic numbers have come in fairly strong and there’s been no obvious sign that investors believe something is seriously wrong.
But underneath the surface, institutional investors are telling a VERY different story!
As I write this, Prospero’s Net Options Sentiment for QQQ is sitting at 6, while SPY is at 0 and has essentially remained there all week, even on green market days. For those unfamiliar with the indicator, single-digit readings for our SPY and QQQ Net Options Sentiment have historically led to more significant market pullbacks.
That doesn’t mean a selloff will begin next week (we’ve seen those numbers stay in single digits for several weeks before a real pullback begins), but it does raise an obvious question: Why are sophisticated investors buying this much downside protection while the stock market and economy are still holding together reasonably well?
One of the more interesting explanations I’ve seen came this week from Dhaval Joshi, chief strategist at BCA Research, who shared the chart below showing something happening in the Treasury market that deserves our attention.
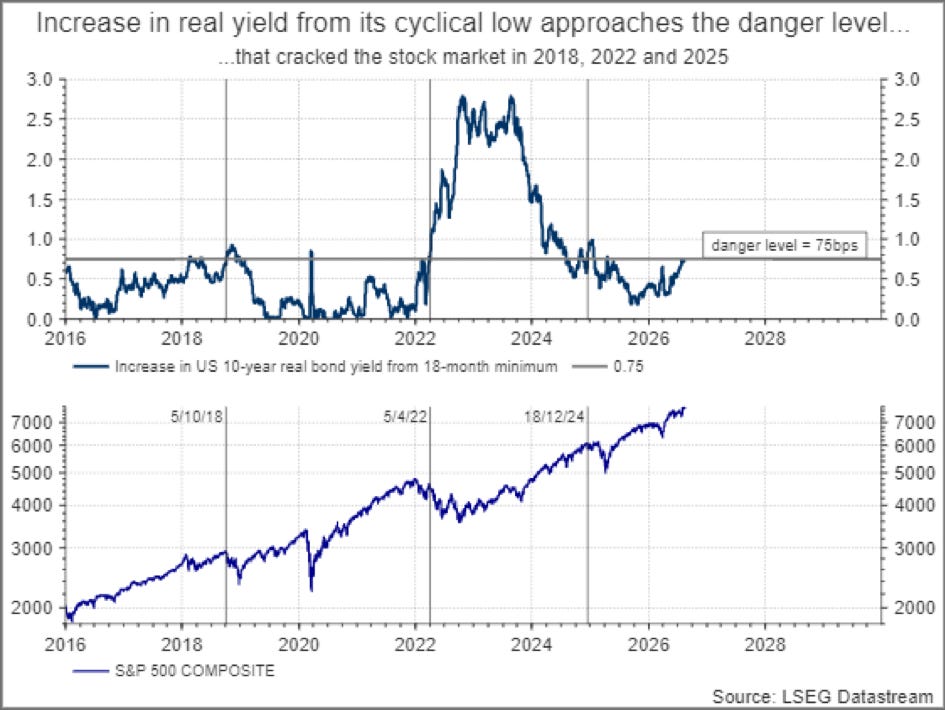
Joshi isn’t simply looking at the level of the 10-year Treasury yield. He is measuring the increase in the 10-year real Treasury yield from its rolling 18-month low. Joshi’s observation is that when the 10-year real yield has risen approximately 75 basis points from its cyclical low, the stock market has historically begun having problems. His chart identifies three recent examples: 2018, 2022 and 2025. We are now rapidly approaching that 75-basis-point level again.
I wouldn’t treat 75 basis points as some magical tripwire where stocks suddenly collapse; but what makes Joshi’s argument compelling is that there is a very logical economic reason the relationship exists.
When real Treasury yields rise, investors can earn a higher inflation-adjusted return without taking on the higher risk of stocks. At the same time, borrowing becomes more expensive throughout the economy and the discounted rate used to value future corporate earnings rises. That matters to every company, but it matters especially to growth-oriented companies whose valuations depend heavily on future profits. The further into the future those earnings are expected to show up, the more sensitive their present value becomes to changes in real interest rates.
The Bad News and Our Government’s Intervention
Long-term Treasury yields have risen sharply enough that the 30-year Treasury recently reached levels not seen since 2007! Because of the rise, the Treasury Department is trying to intervene. It responded by announcing it will double the size of its purchases of longer-dated Treasury securities, increasing long-duration buybacks from $2 billion to $4 billion beginning in September. Their hope is that intervention will cause Treasury yields to drop, easing the pressure on the stock market.
The initial market reaction was exactly what the Treasury would have hoped for. Bond prices rallied and long-term yields fell as investors anticipated a larger buyer entering the market. The problem was that the improvement didn’t last. By the end of the week, the 10-year Treasury yield was back around 4.74%, while the 30-year was around 5.28%, giving back most of the relief that followed the announcement.
To be fair, the expanded purchases haven’t even begun yet, so technically we can’t say the program itself has failed. What we can say is that the announcement failed to produce a lasting reduction in long-term yields, and that may tell us something important about the size of the problem the Treasury is dealing with.
The United States’ Massive Debt Problem
The United States has to borrow an enormous amount of money to keep funding the government. The Treasury expects to borrow about $739 billion this quarter and another $628 billion next quarter, more than $1.3 trillion in just six months.
Stop and read that last sentence again….
Our government is set to borrow $1.3 trillion dollars in the NEXT SIX MONTHS. That means a lot of new Treasury bonds are coming to market, and investors have to be willing to buy them. The concern isn’t whether buyers will show up. They likely will. The concern is how high interest rates will have to go to keep attracting enough buyers.
If investors keep demanding higher yields, the effects won’t stay in the bond market. Borrowing gets more expensive, bonds become more attractive compared with stocks, and higher rates put pressure on stock valuations. That is exactly the kind of environment Joshi’s chart is warning about.
Here’s one final reason why our SPY and QQQ Net Options Sentiment might show us such bearish institutional positioning.
The Japanese Problem
We’ve talked about this a few times, but this is really important. For decades, investors have borrowed cheap yen and invested it in higher-returning assets around the world—the yen carry trade. But as Japanese rates rise and the yen strengthens, that trade becomes less attractive and can force investors to sell assets to repay those loans.
We saw how quickly that can hit U.S. markets in August 2024, when a carry-trade unwind helped send the Nasdaq down roughly 6% in three days. Without boring you to tears, while not guaranteed, a similar “unwinding” of the Japan carry trade could easily happen if Japan continues to raise rates.
We believe those two things (and the ongoing war in Iran) are the likely reasons SPY Net Options Sentiment is 0. QQQ is 6. Again, we don’t know for certain what the cause is, but the FACTS are that sophisticated investors are currently positioned in an extraordinarily defensive way, right as the markets recently hit all-time highs.
Let me end with this. As you know, this market can change quickly. The Midterms are approaching and logic would lead us to believe that President Trump is highly motivated to end the quagmire in Iran. A permanent end to the conflict will cause markets to explode. BUT, if and when that happens, I will personally be watching our Net Options Sentiment like a hawk. If those numbers stay in single digits, or jump up but then return, that is going to REALLY concern me about the underlying state of this market.
There are a lot of good setups in this market. Bitcoin, silver and gold are all running. But that bullishness can also be a sign that people are moving their capital into “hard” assets not controlled by governments that are currently eyeball-deep in debt. If you’ve done well over the last 3 years, now is not the time to get greedy. Let’s preserve our capital until we know for certain which direction this market is heading.
PERFORMANCE & WEEKLY RECAP
It was another tricky week with the market looking down most of the time, but there were pockets of strength. We started the week with solid picks and a good ratio and didn’t need to make many changes throughout the week. We upped our win percentage over SPY since last week and continue to outpace the indices, currently sitting 9.5% above the market on an annualized basis, with a 57% win rate against SPY benchmarks. For those of you who didn’t see the mid-week letter, we mentioned the fact that a recent report from the WSJ showed that for the year ending 6/30, 75% of hedge funds did not beat the SPY for the year. We run this portfolio in a similar way to protect downside, and are proud to be ahead of SPY the past 4 years and continue to do so again this year.
Our short intro + learning videos get you up to speed on how best use our letters and app to increase your wins.
Monday’s stream 8/24 is at the normal time 11AM, same with Wednesday 8/26 at 3PM.
Track all of your investments in real time with our app. Prospero’s proprietary AI tech updates key options signals like Net Options Sentiment, Upside and Downside every 3 minutes.
QQQ and SPY Net Options Sentiment
How we view the Sector performance and momentum
Putting it all together to make a portfolio that first controls for risks but also has upside
Adds —> Keeps —> Drops
Adds —> Keeps —> Drops
CAP / VALUE ANALYSIS
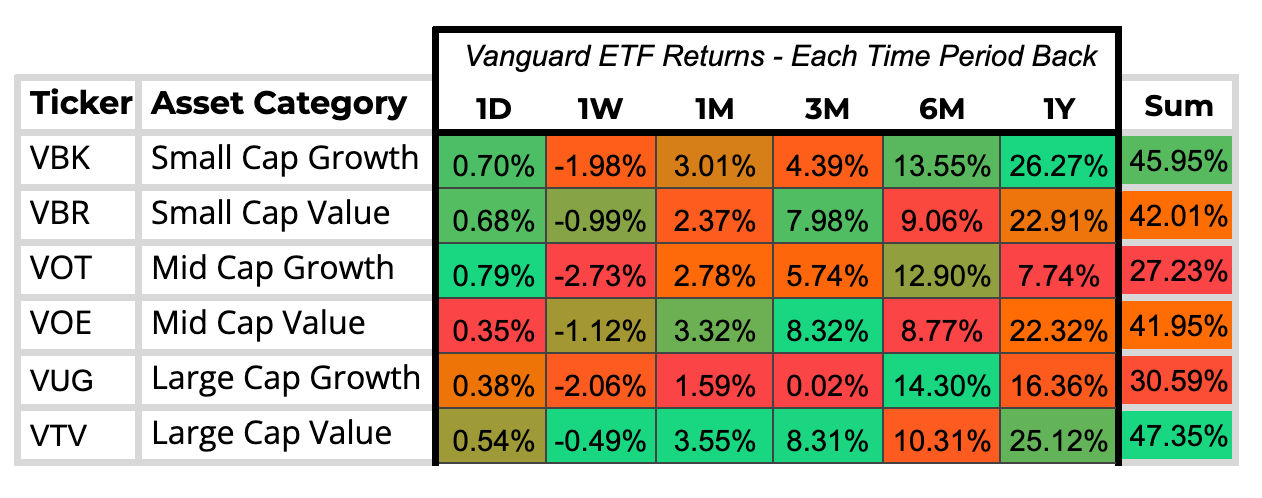
Looking across market categories over the past week, we saw broad-based selling pressure, though Growth took the brunt of the downside while Value held up significantly better. Mid Cap Growth led the weekly decline, falling -2.5%, with Large and Small Cap Growth both slipping -2.0%. Value categories insulated portfolios much better, led by Large Cap Value down just -0.5%, while Small and Mid Cap Value both dipped -1.0%. Daily price action provided a uniform rebound to close out the week, with all categories bouncing between +0.5% and +1.0%.
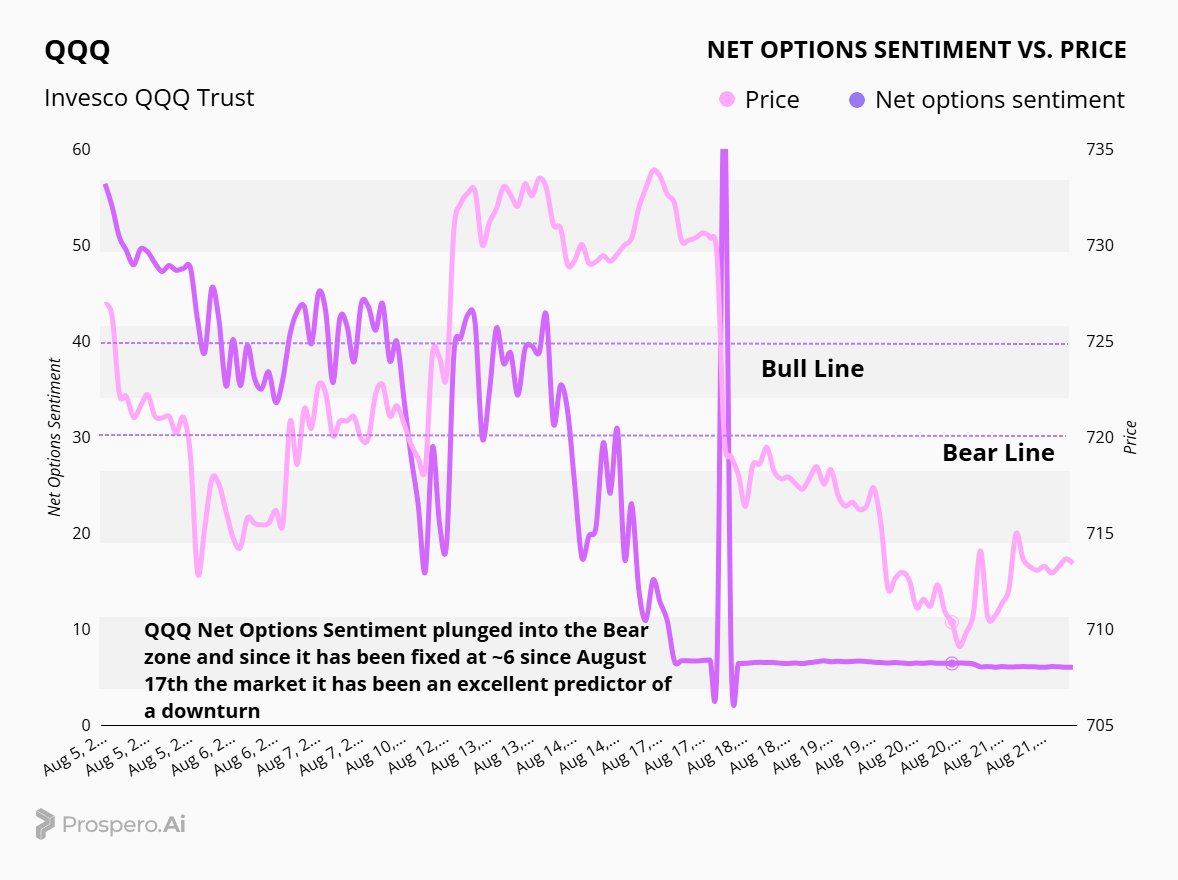
QQQ Net Options Sentiment has been in a Bearish trend for over a week giving us a warning of the incoming trouble. While price action appeared to find temporary footing mid-week, it has continued to slowly slide lower in line with the persistent weakness in options flow. Friday offered a brief relief bounce in price, but until we see a meaningful, sustained uptick in our underlying NOS metrics, we remain cautiously positioned.
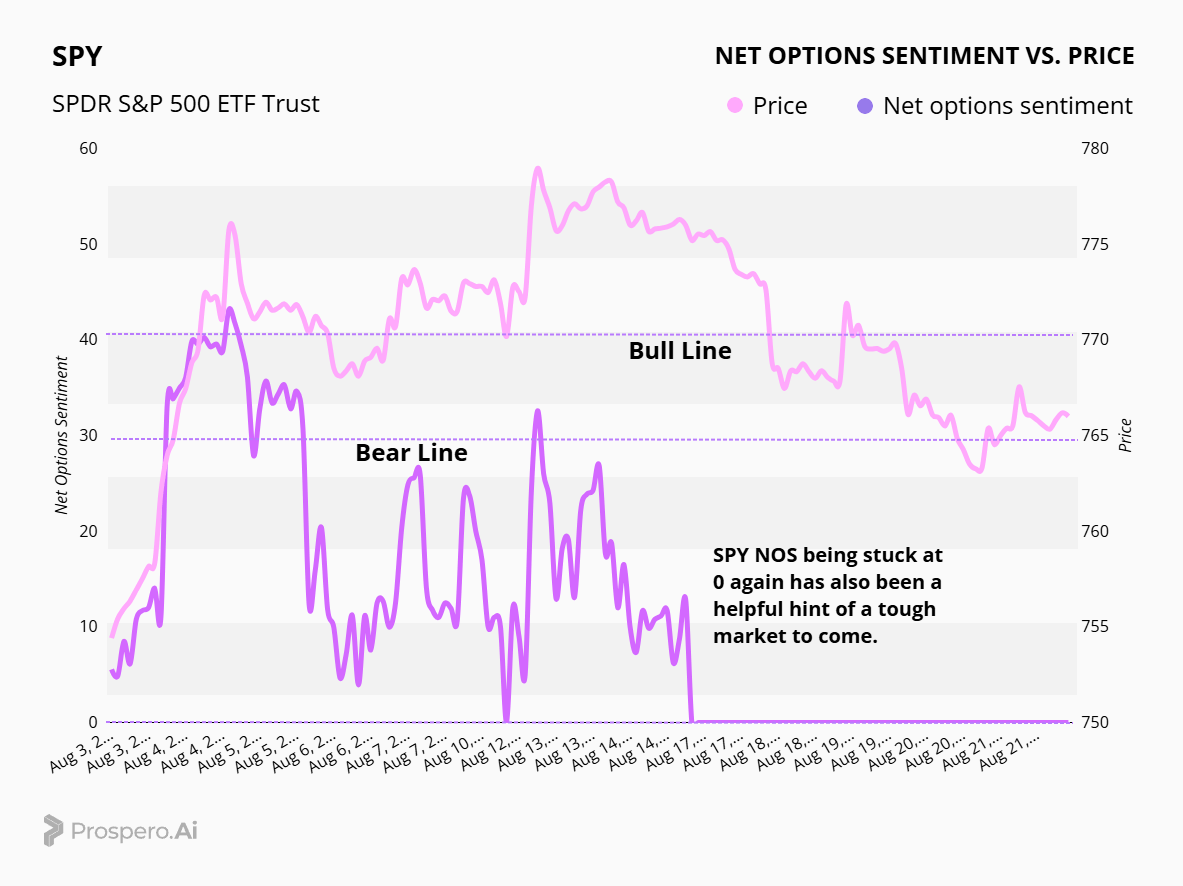
SPY Net Options Sentiment remained pinned near zero throughout the week, providing an early warning that kept us prepared for broader market downside. While Friday delivered a brief relief rally in price, the lack of upward movement in options flow shows institutional buying remains absent. Staying grounded near these baseline NOS levels signals continued caution, especially when comparing SPY's muted flow alongside QQQ to gauge broader market health.
SECTOR ANALYSIS
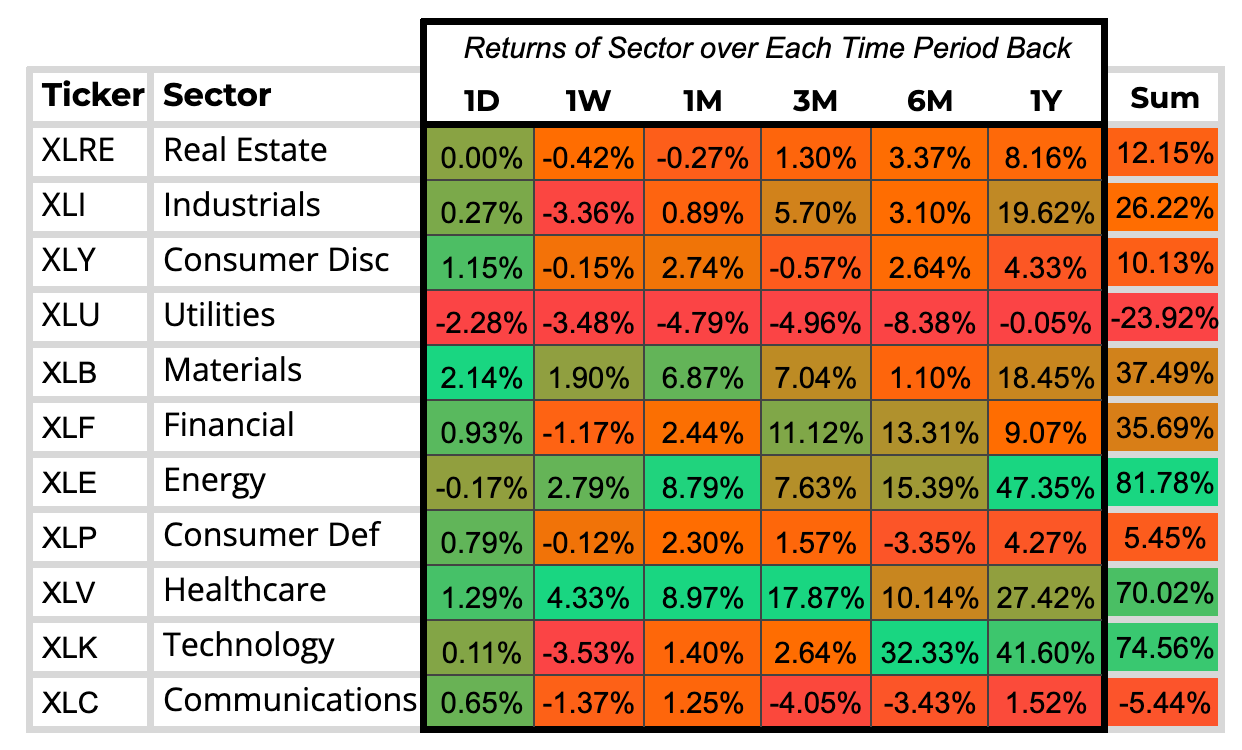
Healthcare (+4.5%), Energy (+3.0%), and Materials (+2.0%) led the market higher this week, while Tech, Utilities, and Industrials paced the downside, each sliding roughly -3.5%. Daily price action finished on a bright note as Materials (+2.0%) and Healthcare (+1.5%) surged to close out the session, though Utilities stayed under heavy pressure, dropping another -2.5%.
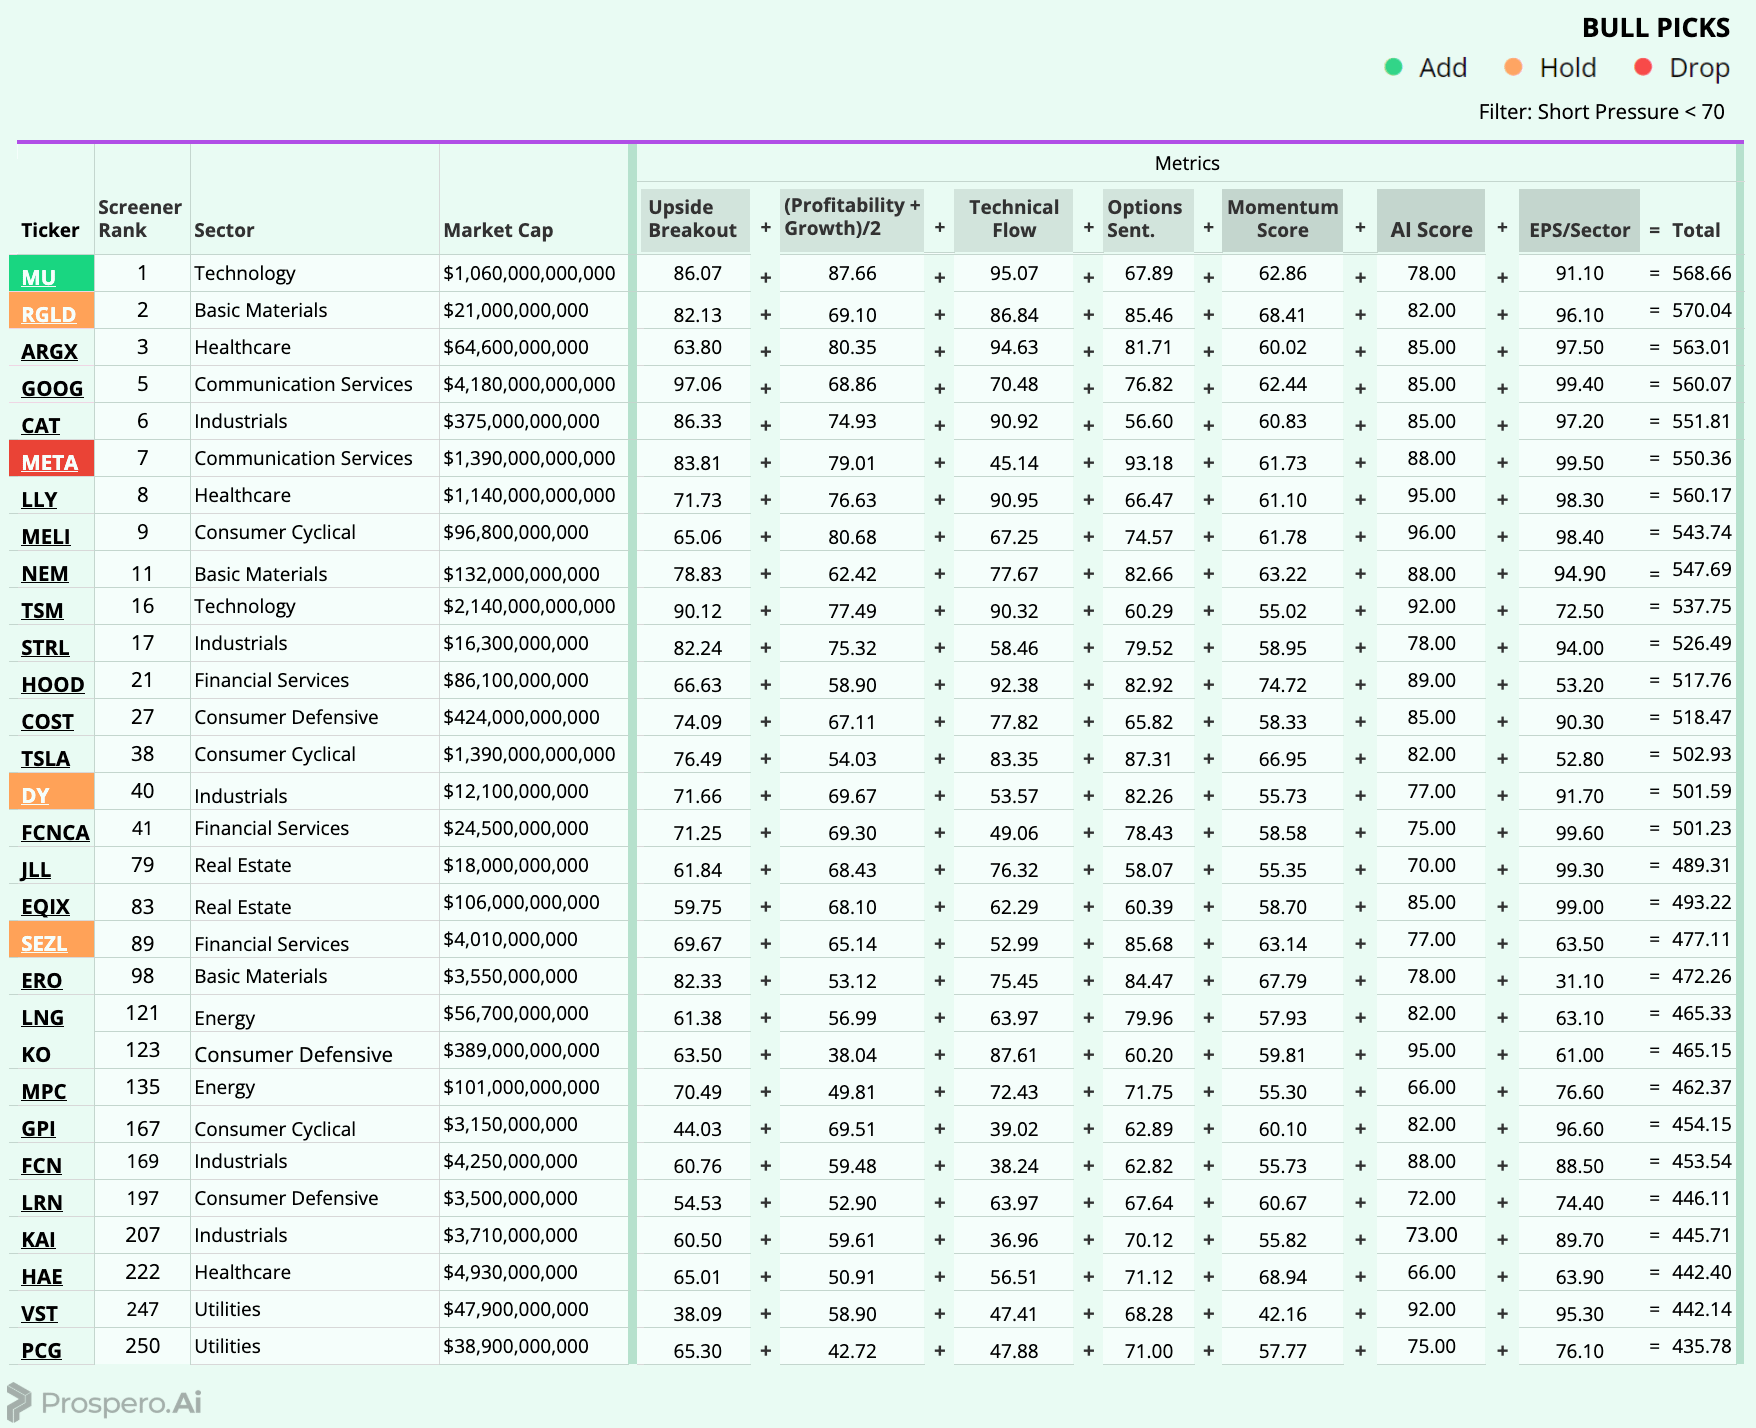
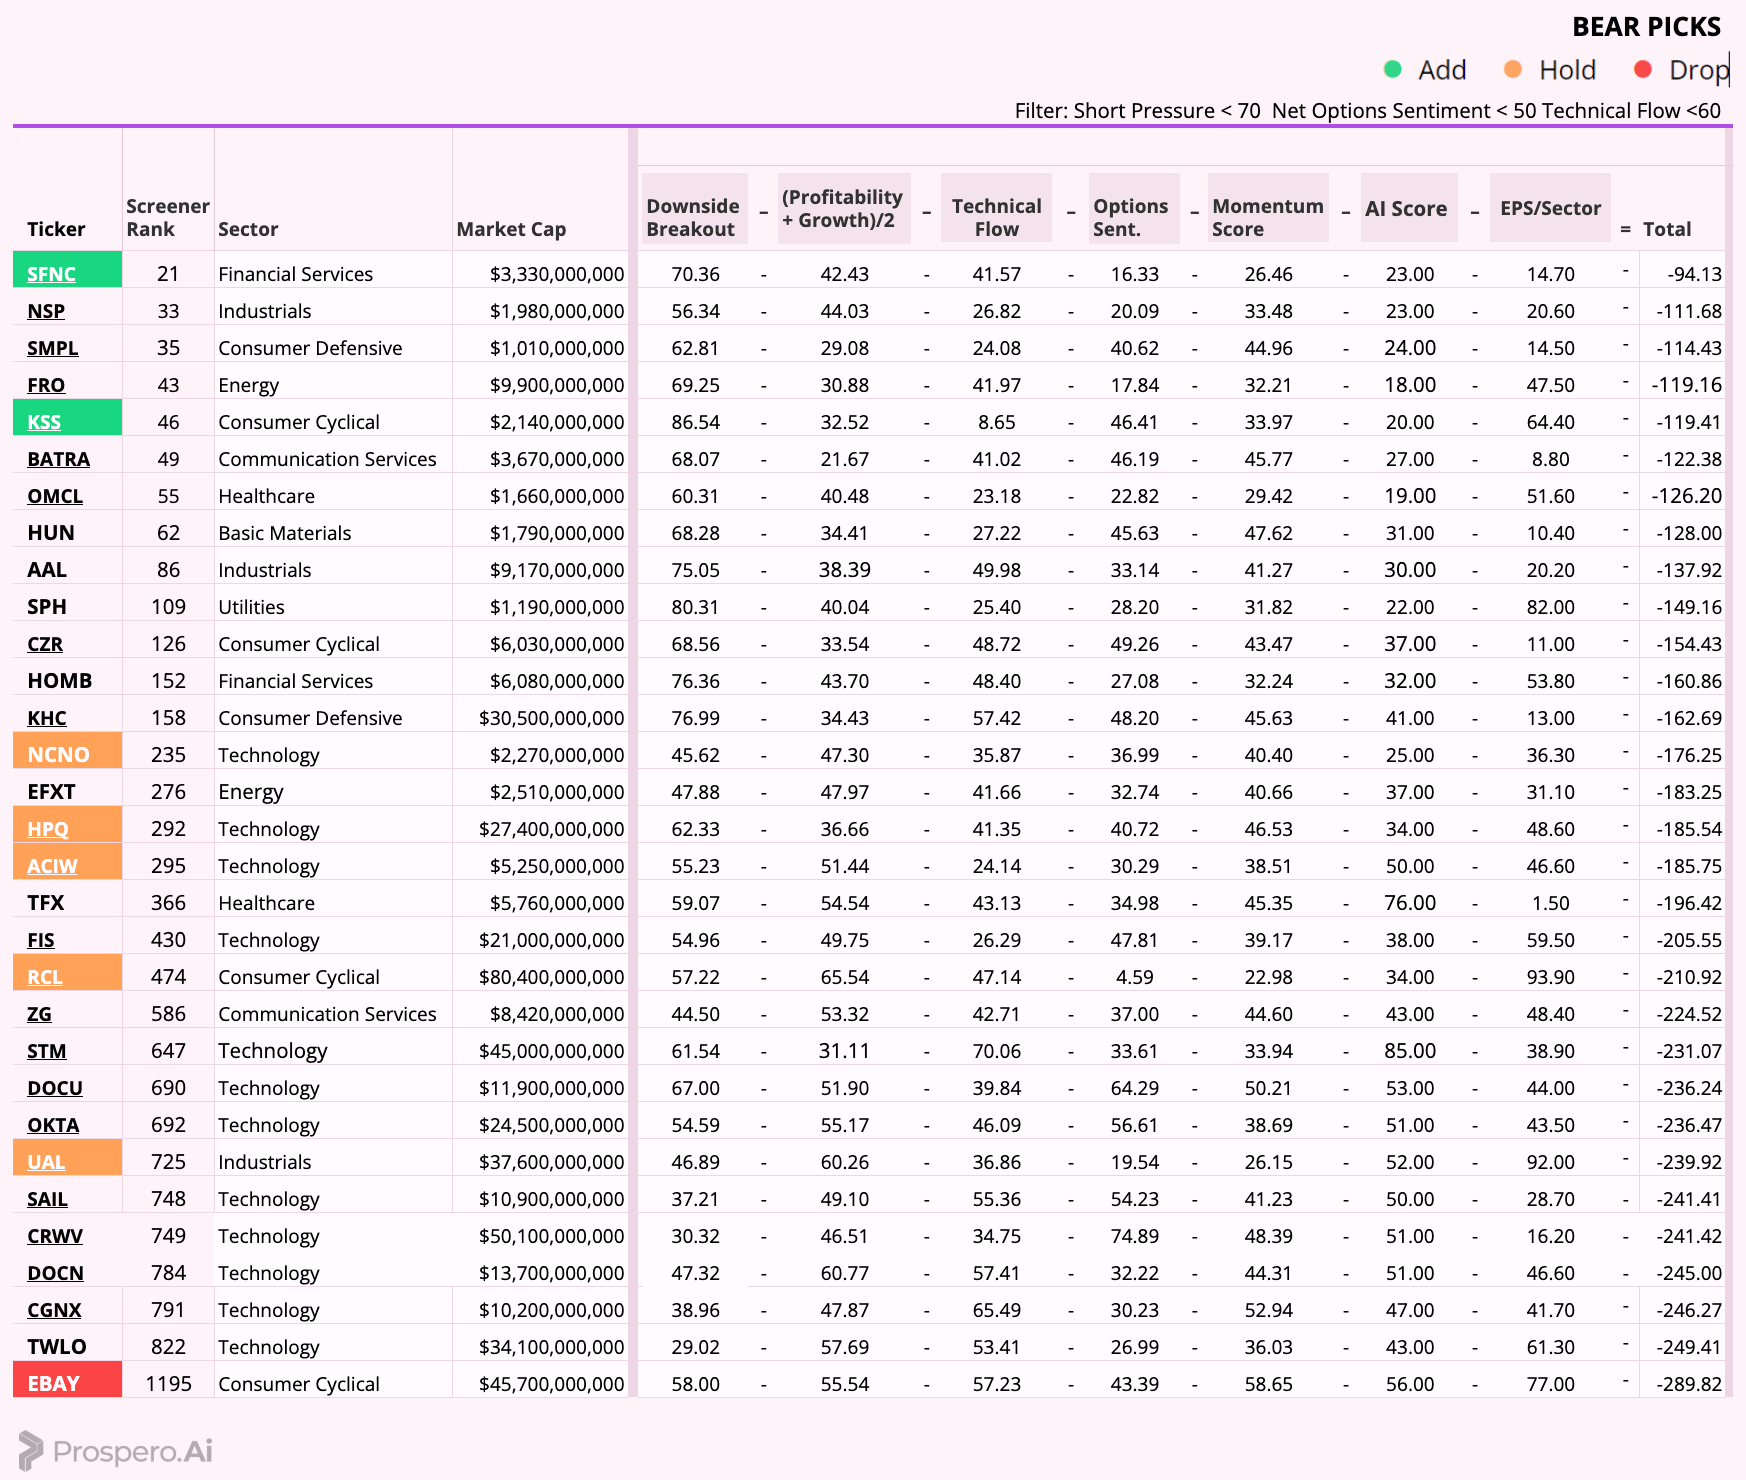
We had some good picks to start the week and they mostly performed as we would have wanted, so we didn’t need to make too many moves. As we go into this week not much has changed as our NOS data is still flashing concerning signals, and we feel good with how we ended the week, so not too many changes are needed. We start the week with a portfolio of 5 longs and 7 shorts.
Adds
MU was added as it has great Tech Flow and Momentum scores.
Holds
RGLD was held for its good Momentum and Net Ops, DY was held for its high Net Ops and good upside, and SEZL was held for its Net Ops and Momentum.
Drops
META was dropped as it didn’t score as well as MU for mega caps with low Tech flow.
Adds
SFNC was added for its poor Tech Flow, Net Ops and Momentum and KSS was added for its bottom of the board Tech Flow and poor Net Ops.
Holds
NCNO was held for its poor Net Ops, HPQ was held for its poor Net Ops and high Downside, ACIW was held for its poor Tech flow, RCL was held for its terrible Net Ops, and UAL was held for poor Net Ops and Momentum.
Drops
EBAY was dropped as it performed poorly in our filters.
Long / Bull Moves – MU Add/ RGLD, DY, SEZL, VIX Holds / META Drop
Short / Bear Moves – SFNC, KSS Adds / NCNO, ACIW, RCL, UAL, HPQ Holds / EBAY Drop
5 Longs: RGLD, MU, DY, SEZL, VIX
7 Shorts: SFNC, KSS, NCNO, ACIW, RCL, UAL, HPQ
Paid Investing Letter Bonus with Momentum Score
Comments
Nothing yet. Say the first thing.
Sign in to join the conversation.