
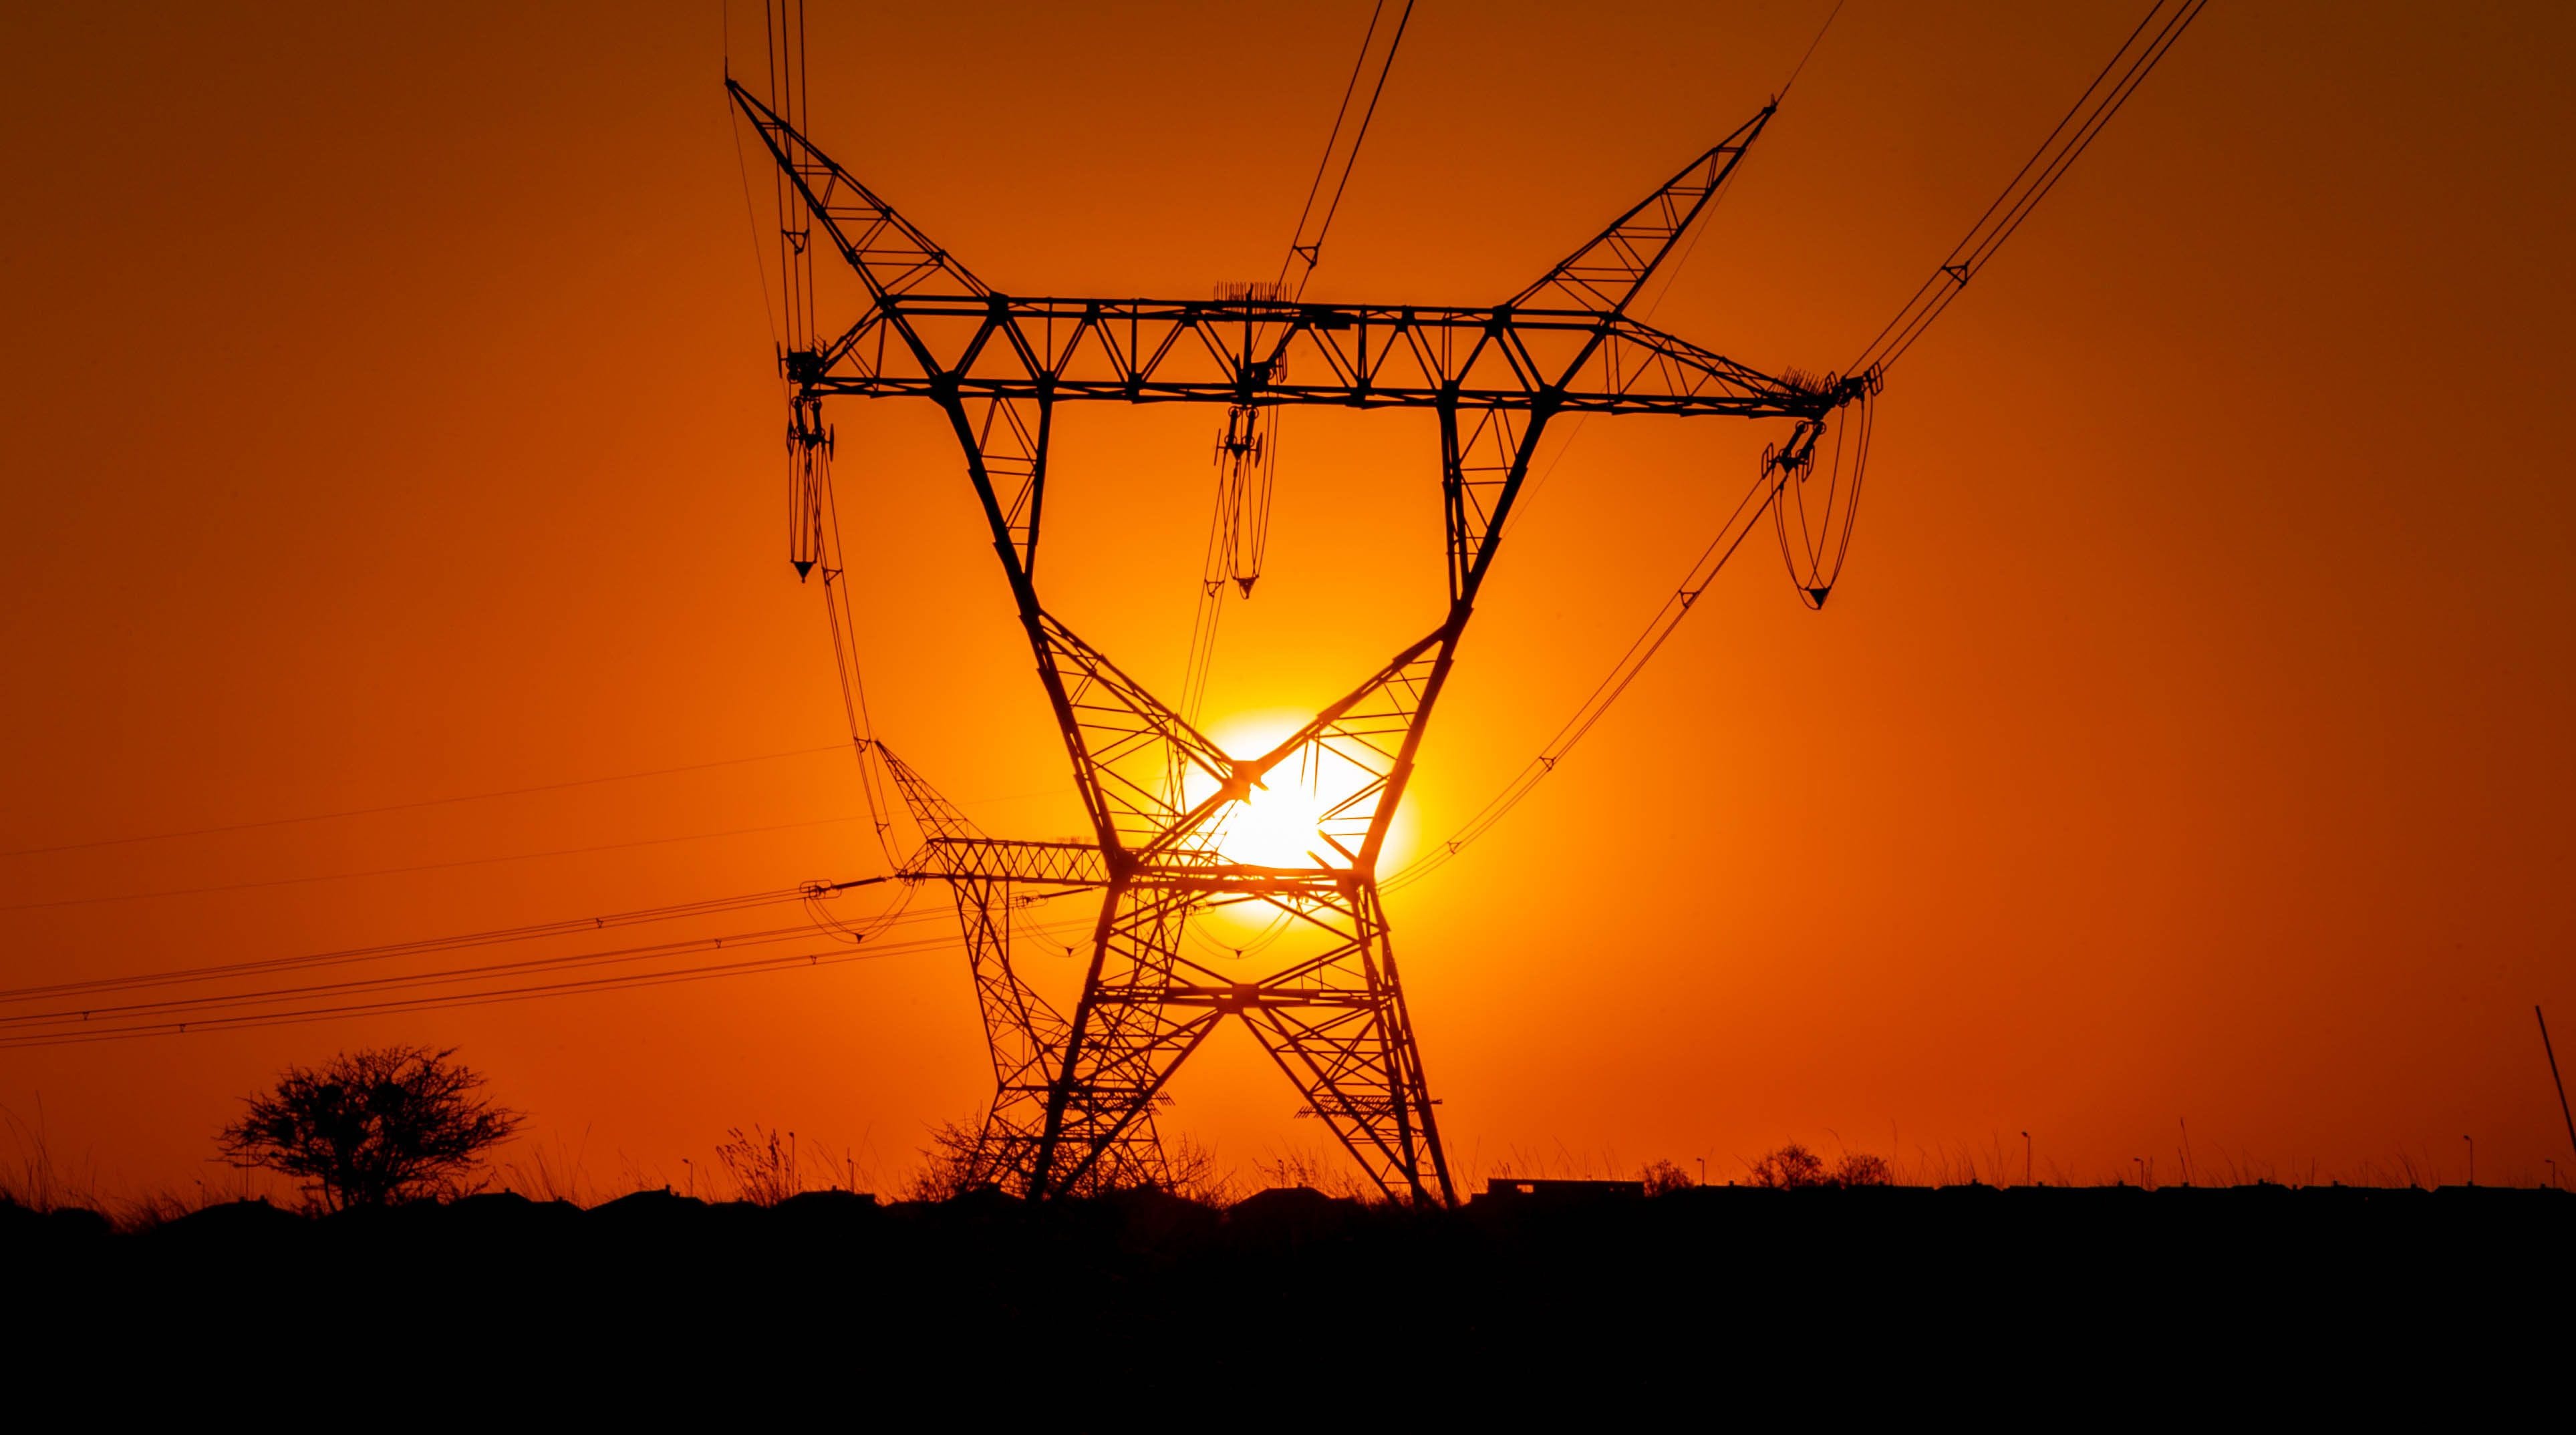
Photo by Thomas Chauke. from Pexels: https://www.pexels.com/photo/vibrant-sunset-behind-electric-power-lines-32546960/
In July 2025, South Africa’s energy regulator approved one of the stranger bargains in modern electricity policy: new wind farms in the Western and Eastern Cape may connect to the national grid only if they agree to throw away up to a tenth of what they generate. Grid operators call this curtailment — the deliberate spilling of power that a saturated network cannot absorb. The bargain opened grid access for about 3,470 megawatts of wind, roughly two large nuclear reactors’ worth of capacity that had been stuck in the connection queue [1, 2].
What makes this strange is that it’s happening in South Africa. For most of the past two decades, curtailment in South Africa meant something else entirely: the scheduled switching-off of customers, because Eskom, the state monopoly that generates most of the country’s electricity, could not keep its plants running, up to twelve hours a day at the worst. South Africans planned their lives around an app, EskomSePush, that told them when their neighborhood’s turn came. In 2023, the worst year, the lights went out on 332 days [3, 4]. A country that spent fifteen years rationing consumption now rations production. To quote Michael Scott:
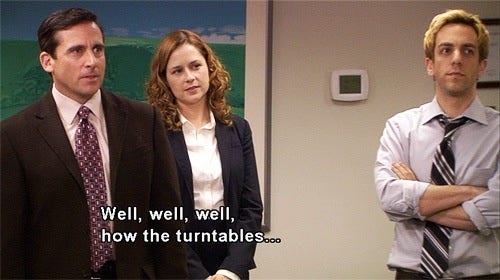
And here is the good news: the blackouts are gone (if you foresee a diversion on Texas and California - it’s coming, hang on…). South Africa has now gone more than 400 consecutive days without load-shedding, a streak running since mid-May 2025, and Eskom projects a clean Southern hemisphere winter [5]. State utilities that fail this badly, this long, are not supposed to recover. So what actually happened?
The turnaround created a “pincer.” The hand of the state offered a bailout with handcuffs: a debt rescue that forced Eskom to stop building and start maintaining. The invisible hand of the market led to an exodus: households, mines, and factories, priced out and blacked out, built their own power once the state stopped requiring permission. The two pressures are not symmetrical. The recovery restored the old system, but the wave of renewables is replacing it.
How a coal monopoly ran out of electricity
The crisis announced itself in January 2008, when the government declared a national electricity emergency. The mines, the heart of the economy since the 1880s, briefly stopped hoisting ore [6]. The underlying arithmetic was simple. Eskom generated nearly all of the country’s power, more than 80 percent of it from coal, with a fleet whose average age crept toward the design life of the plants. Demand grew; the state dithered on new capacity. When it finally built, it built badly. Medupi and Kusile, two giant coal stations launched in 2007–08, were budgeted at roughly R80 billion each and ended up costing R145 billion and R161 billion, wrapped in defects and corruption findings that filled a parliamentary oversight report [7].
The gap between what the fleet could produce and what the country needed was managed by switching customers off in rotation. The practice escalated from an occasional emergency to the country’s operating condition: 205 days of load-shedding in 2022, then 332 in 2023, when “Stage 6” (a third of national capacity offline) became routine [3, 4]. For scale: the February 2021 Texas blackout lasted about four days, killed at least 246 people by the official count, and produced a federal inquiry and its own small academic literature in energy policy [8]. South Africa lived the equivalent, on a published schedule, for eleven months of a single year.
Paying customers were charged more for the shrinking supply. Eskom’s tariffs rose about 937 percent between 2007 and 2024, against cumulative inflation of about 155 percent [9]. An American equivalent would be the average household rate rising ninefold since 2007, to well over a dollar per kilowatt-hour, instead of the roughly 75 percent it actually rose [10]. Ninefold! Every increase made self-generation more attractive, which shrank sales further, which justified the next increase. Utility analysts have a name for that loop: Utility Death Spiral.
The bailout came with handcuffs
The state’s arm of the pincer began in 2023, when the National Treasury took over R254 billion of Eskom’s debt — relief on the condition that the utility take on no new borrowing, build no new generation, and spend its management attention on maintaining the plants it already had [11]. As industrial policy, this was an admission of defeat. As utility triage, it worked. Eskom’s energy availability factor, the share of the fleet actually able to produce, climbed from the mid-50s a year earlier to about 64 percent by 2025. Unplanned breakdowns fell by more than 5,000 megawatts, and diesel spending on emergency turbines collapsed [5, 12].
The improvement showed up where citizens could see it. Load-shedding was suspended in March 2024 and stayed off for 254 days, returned in early 2025 for a few brutal weeks (including one unannounced jump to Stage 6 in February), and then stopped for good in mid-May 2025 [13]. Run the arithmetic on the recovery: six points of availability on a fleet of roughly 48,000 megawatts is on the order of 25 terawatt-hours a year of recovered output, which is more than a tenth of national consumption. Maintenance discipline, the least glamorous policy instrument in existence, did the heaviest lifting. That credit should be paid in full. The more interesting half of the story is what the recovery cannot explain.
The Exit
South Africa had a working channel for private renewable power as early as 2011, a competitive auction program that procured more than 7 gigawatts over a decade and was studied worldwide [14]. Eskom itself throttled it for years in the late 2010s by refusing to sign the purchase agreements. The real opening came under duress. In 2021, with blackouts worsening, the government raised the licensing threshold for private generation from 1 megawatt to 100 megawatts; in late 2022, in the middle of the record blackout year, it abolished the threshold entirely [15]. A factory, a mine, or a shopping mall could now build any amount of generation for itself, or buy it from a private producer who wheels the power across Eskom’s own wires for a fee, without asking the state’s permission to exist.
What followed was the fastest energy build-out in the country’s history, and the state did not build it. Rooftop solar, which Eskom estimates from the gap between predicted and actual demand, went from about 4.4 gigawatts in mid-2023 to more than 8 gigawatts by June 2026 — in peak terms, roughly four Koeberg nuclear stations bolted onto the country’s roofs in three years [16]. Yes, just sit with that for a second if you made it this far.
Privately procured solar and wind, the utility-scale version of the same exit, reached an estimated 12,700 gigawatt-hours in 2025, five to six percent of national supply, on a curve that has roughly doubled every two years since the licensing reform [17]. One research group counted 5,000 megawatts of private solar built within eighteen months of the cap’s removal, with another 12,000 in the pipeline [11].
Set the two arms side by side and the pincer’s proportions are clear. The recovery restored perhaps twice as much annual energy as the private build currently supplies. But the private build did something the recovery could not: it shaved the midday peak, bought Eskom room to take plants down for the maintenance that produced the recovery, and permanently removed a slice of demand from the state’s books. The halves reinforced each other. Only one of them is reversible.
South Africa is not the only grid where the blackouts quietly stopped. California ran rotating outages in August 2020 and came within a now-famous emergency text message of more during the September 2022 heat wave, yet CAISO, the operator of most of the state’s grid, has not called a single conservation alert in the three summers since, having grown its battery fleet from about 500 megawatts in 2020 to nearly 17 gigawatts by late 2025 — roughly a third of its peak demand [25]. Texas, whose grid killed hundreds in the 2021 winter freeze, met record electricity demand through the summers of 2024 and 2025 without once asking Texans to cut back, riding a battery fleet that tripled toward 10 gigawatts and utility-scale solar that out-generated the state’s coal for the first time in August 2025 [26]. The same technology that ended South Africa’s load-shedding is ending shortages elsewhere. What differs is the plumbing: in California and Texas the batteries answer to the grid operator and clear through a market, not around it, which is precisely the arrangement South Africa is still trying to build.
Falling sales in good times
Eskom sold 183 terawatt-hours of electricity in its 2024 financial year, down from 188 the year before, and sales fell another 3 percent in the first half of the 2026 financial year — after the blackouts ended [18]. Fitch, the ratings agency, projects the decline will continue at about 2 percent a year through 2027 [19]. Customers were supposed to come back when the power stabilized. They are not coming back. The exit was never only about reliability: at nine times the 2007 price, solar-plus-batteries beats Eskom’s tariff for anyone with a roof and access to credit, blackouts or none.
The revenue side tells the same story from the other direction. Eskom reported a R25.9 billion profit in FY2025, its revenue up 14 percent — on an 18.65 percent tariff increase layered over falling volumes [18]. The utility is charging fewer customers more money to stand still, which is the textbook mechanics of a death spiral, a term that has migrated into the mainstream South African financial press [20]. And the customers who remain are increasingly the ones who cannot pay. Municipal arrears to Eskom, the unpaid bills of the towns and cities that resell its power, grew from R74 billion in March 2024 to more than R110 billion by mid-2026. Eskom itself warns the figure could reach R300 billion by 2031 [21]. That projection comes from a utility lobbying for enforcement powers and tariff relief, but the direction is not in dispute.
As the case elsewhere, there is distributional issue: households and firms with capital left first, and the estimated 8 gigawatts on rooftops sit disproportionately over the suburbs and industrial parks, not the townships that endured the worst of the load-shedding years. No household-level dataset yet exists to measure this precisely to my knowledge, so I hold the claim loosely (kinda). But the tariff structure guarantees the logic: each departure spreads the grid’s fixed costs over a poorer remainder, and South Africa’s economy, growing around 1.5 percent a year with unemployment near 32 percent as of 2026, does not have many more increases it can absorb [22].
Photo by Wayne Bisset from Pexels: https://www.pexels.com/photo/vintage-orange-car-parked-by-brick-building-36848646/
The case that everything is actually fine
Here an optimistic take. Eskom is profitable, its fleet is healing, a sovereign upgrade and 400 blackout-free days are an accomplishment. A 2 to 3 percent annual sales decline is what mature utilities everywhere manage through rate design. Municipal non-payment is a two-decade governance failure that would still exist if not a single solar panel had ever been installed. On this view the exit is 5 or 6 percent of supply being dramatized into an existential threat, and the boring truth — maintenance worked — is likely the whole truth. An independent transmission company now exists, and a wholesale electricity market, SAWEM, is scheduled to open and turn the exodus into ordinary competition [23].
The reading is right about the past and, I think, wrong about the future direction. The profit is mostly price, not volume. The arrears did predate solar, but they accelerated precisely as tariffs spiked (R36 billion of new municipal debt in roughly two years) because the same price that pushes the affluent onto rooftops pushes municipalities into default [21]. And a 5 percent supply share understates the damage when the departing 5 percent are the customers who actually pay their bills. The wholesale market is the real test of the optimist case, which is why its date keeps mattering: the launch has already slipped from April 2026 to the third quarter of this year [24].
So watch two numbers. If SAWEM opens on schedule and Eskom’s sales stabilize by the end of 2027 (customers choosing to buy through the grid rather than around it) the pincer will have matured into a proper market, and South Africa becomes the developing world’s best argument that a failed utility can be reformed. If sales keep falling at 2 percent a year while arrears compound, then the country has not solved its electricity crisis so much as privatized its beneficiaries, and the next episode of this story will be about who gets left holding the wires.
References
[1] Fasken, “Congestion curtailment approved by NERSA,” July 2025. https://www.fasken.com/en/knowledge/2025/07/congestion-curtailment-approved-by-nersa
[2] Engineering News, “Eskom’s new curtailment addendum unlocks 3 470 MW of grid for wind in Western and Eastern Cape,” January 2024. https://www.engineeringnews.co.za/article/eskoms-new-curtailment-addendum-unlocks-3-470-mw-of-grid-for-wind-in-western-and-eastern-cape-2024-01-27
[3] CSIR, Load-shedding statistics. https://www.csir.co.za/load-shedding-statistics
[4] IOL, “A record 332 days of load shedding in 2023.” https://iol.co.za/news/south-africa/the-year-we-were-plunged-into-darkness-a-record-332-days-of-load-shedding-in-2023-and-counting-63eafd30-87c8-4f13-acd0-60071e509239/ (National Treasury’s count is 335 days; see fact-check log.)
[5] Eskom, “Eskom marks 300 days without loadshedding,” March 2026; Eskom Power System Status. https://www.eskom.co.za/power-system-status/
[6] Wikipedia, “South African energy crisis” (emergency declaration, 24 January 2008). https://en.wikipedia.org/wiki/South_African_energy_crisis
[7] SCOPA oversight report on Medupi and Kusile, October 2019. https://pmg.org.za/tabled-committee-report/3937/
[8] Texas Comptroller, “Winter Storm Uri 2021”; FERC final report. https://comptroller.texas.gov/economy/fiscal-notes/archive/2021/oct/winter-storm-impact.php
[9] PowerOptimal, “2026 update: Eskom tariff increases vs inflation since 1988.” https://poweroptimal.com/2026-update-eskom-tariff-increases-vs-inflation-since-1988-with-projections-to-2028/
[10] EIA, average retail price of electricity, residential. https://www.eia.gov/electricity/monthly/epm_table_grapher.php?t=epmt_5_6_a
[11] Energy for Growth Hub, “How South Africa Ended Load Shedding Without New Infrastructure,” 2026. https://energyforgrowth.org/article/how-south-africa-ended-load-shedding-without-new-infrastructure/
[12] Eskom, power system status updates, June–July 2026. https://www.eskom.co.za/power-system-status/
[13] SAnews, “Over 250 days without load shedding,” 2024; Wikipedia, February 2025 Stage 6 event. https://www.sanews.gov.za/south-africa/load-shedding-reaches-over-250-days-suspended
[14] GIHub / Wikipedia, Renewable Energy Independent Power Producer Procurement Programme. https://en.wikipedia.org/wiki/Renewable_Energy_Independent_Power_Producer_Procurement_Programme
[15] White & Case, “South Africa exempts private generators from Generation Licence requirements,” 2023. https://www.whitecase.com/insight-alert/south-africa-exempts-private-generators-generation-licence-requirements
[16] Engineering News, “Capacity of rooftop solar installed in South Africa has passed 8 GW mark,” 19 June 2026. https://www.engineeringnews.co.za/article/capacity-of-rooftop-solar-installed-in-south-africa-has-passed-8gw-mark-2026-06-19
[17] A. Eberhard, compilation of Eskom transmission and NERSA registration data, July 2026 (2025 figure provisional; solar includes wheeled, wind operational only).
[18] ESI-Africa, “Eskom finances: profits and revenue up, sales down,” 2025. https://www.esi-africa.com/news/eskom-finances-profits-and-revenue-up-sales-down/
[19] Bloomberg, “South Africa’s Eskom eyes green power as its energy sales drop,” September 2025. https://www.bloomberg.com/news/articles/2025-09-05/south-africa-s-eskom-eyes-green-power-as-its-energy-sales-drop
[20] Financial Mail, “Eskom’s death spiral: the paradox of ‘success’,” 18 June 2026. https://www.financialmail.businessday.co.za/features/2026-06-18-eskoms-death-spiral-the-paradox-of-success/
[21] Engineering News, “Eskom prepares to act against 14 municipalities as arrear debt breaches R110bn,” March 2026; BusinessTech, “Eskom warns its R110 billion headache could reach R300 billion in 5 years.” https://www.engineeringnews.co.za/article/eskom-prepares-to-act-against-14-municipalities-as-arrear-debt-breaches-r110bn-2026-03-05
[22] Stats SA; IMF and Treasury 2026 forecasts (GDP growth ~1.5%, unemployment 31.9%).
[23] NTCSA, SA Wholesale Electricity Market. https://www.ntcsa.co.za/sa-wholesale-electricity-market-sawem/
[24] Green Building Africa, “South Africa delays wholesale electricity market launch to Q3 2026.” https://www.greenbuildingafrica.co.za/south-africa-delays-wholesale-electricity-market-launch-to-q3-2026/
[25] NRDC, “Battery Storage Stands the Heat in California and the West” (no Flex Alert across summers 2023–2025; fleet ~500 MW in 2020 to ~17 GW by late 2025, ~33% of peak); California Energy Commission, “Progress on Grid Reliability Ahead of Summer 2026,” May 2026. https://www.nrdc.org/bio/kelsie-gomanie/battery-storage-stands-heat-california-and-west
[26] U.S. EIA, “ERCOT increasingly meets rising demand with solar, wind, and batteries” (record demand, no conservation calls summers 2024–2025; battery capacity ~10 GW; solar out-generated coal, August 2025); IEEFA, “A summer of solar and battery storage records in Texas.” https://www.eia.gov/todayinenergy/detail.php?id=66464
Comments
Nothing yet. Say the first thing.
Sign in to join the conversation.