
Disclosure: I own shares in TOT. I am not a professional. Please do your own due diligence.
Total Energy provides contract drilling services, equipment rentals and transportation services, well servicing, and compression and process equipment and services to the energy and other resource industries. Operations are conducted primarily in Canada, the United States and Australia.
Price: $29.73 CAD
MC: ~1.10 billion CAD
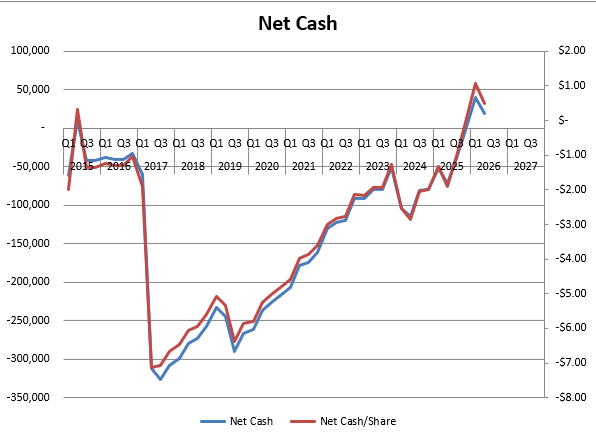
EV: ~1.09 billion CAD
Yield: 1.6%
1 year performance: 135.7%
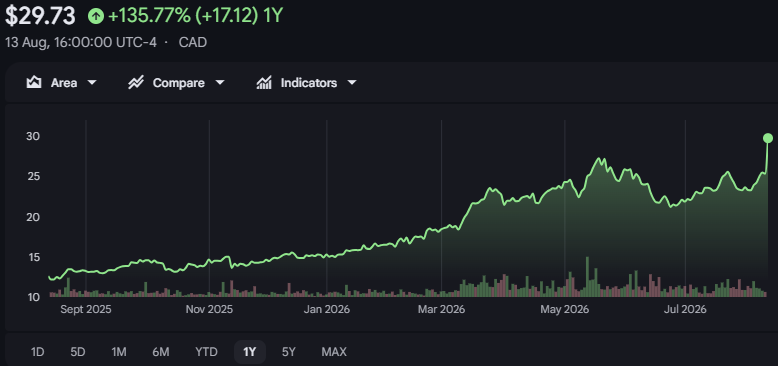
Total Energy reported last night and held a call this morning. Results were quite a bit ahead of my expectations and the stock was up approximately 17.5%.
all numbers in CAD unless stated otherwise
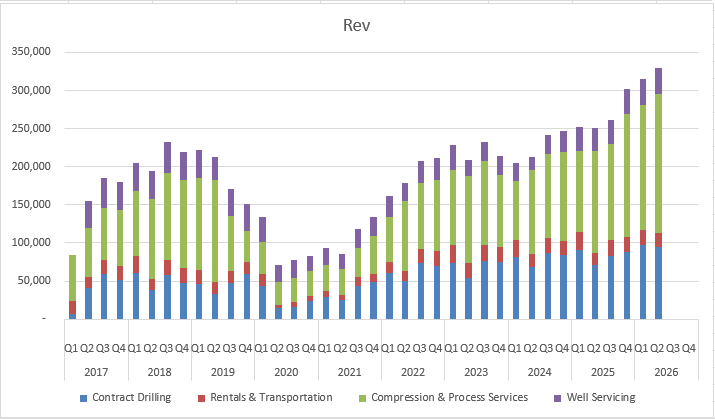
Revenue: $329.0M vs $250.4M (+31.4% YoY)
Gross Profit: $72.0M vs $58.7M (+22.6% YoY)
Gross Margin: 21.9% vs 23.5% (-6.7% YoY)
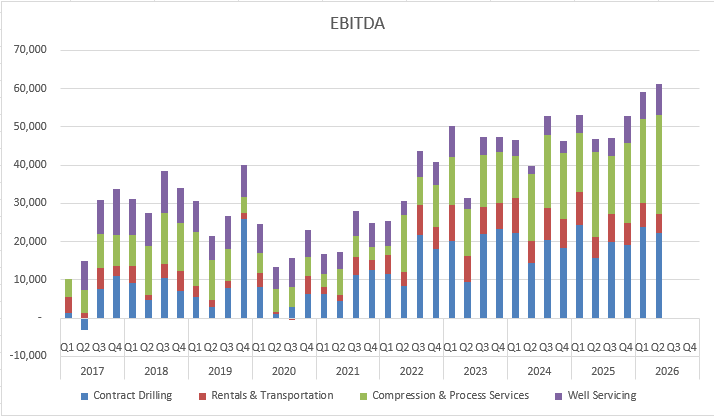
EBITDA: $60.9M vs $45.4M (+34.1% YoY)
EBITDA Margin: 18.5% vs 18.1% (+2.0% YoY)
Basic weighted average shares: 36.7M vs 37.3M (-1.8% YoY)
Diluted weighted average shares: 37.2M vs 37.8M (-1.7% YoY)
$2.3M of non-recurring U.S. Contract Drilling expenses included $1.3M of rig-reactivation costs and $1.0M related to legacy legal disputes
The Q2 gain on sale of PP&E included approximately $2.0M from the disposition of assets related to the discontinued U.S. Well Servicing business
Revenue: $643.9M vs $502.3M (+28.2% YoY)
Gross Profit: $142.0M vs $121.5M (+16.9% YoY)
Gross Margin: 22.1% vs 24.2% (-8.8% YoY)
EBITDA: $116.0M vs $95.9M (+21.0% YoY)
EBITDA Margin: 18.0% vs 19.1% (-5.6% YoY)
Dividends declared: $0.24 per share vs $0.20 per share (+20.0% YoY)
Share repurchases: $14.7M vs $9.9M (+48.4% YoY)
607,908 shares were repurchased during H1 at an average price of $24.23 per share vs 957,490 shares at an average price of $10.37 per share in H1 2025
Canada revenue: $140.5M vs $95.1M (+47.7% YoY)
United States revenue: $112.7M vs $95.9M (+17.5% YoY)
Australia revenue: $75.7M vs $59.3M (+27.8% YoY)
vCanada YTD revenue: $286.8M vs $214.5M (+33.7% YoY)
United States YTD revenue: $212.9M vs $174.8M (+21.8% YoY)
Australia YTD revenue: $144.2M vs $109.3M (+31.9% YoY)
Contract Drilling Services
revenue: $94.7M vs $71.2M (+33.0% YoY)
gross profit: $25.5M vs $18.5M (+37.8% YoY)
gross margin: 27.0% vs 26.0% (+3.6% YoY)
EBITDA: $22.4M vs $16.0M (+39.5% YoY)
EBITDA margin: 23.6% vs 22.5% (+4.9% YoY)
operating days: 2,407 vs 1,945 (+23.8% YoY)
revenue per operating day: $39,349 vs $36,618 (+7.5% YoY)
utilization: 28% vs 21% (+33.3% YoY)
rigs: 93 vs 102 (-8.8% YoY)
Rentals and Transportation Services
revenue: $18.7M vs $16.2M (+15.6% YoY)
gross profit: $6.9M vs $7.7M (-9.8% YoY)
gross margin: 37.1% vs 47.6% (-21.9% YoY)
EBITDA: $5.4M vs $5.6M (-4.2% YoY)
EBITDA margin: 28.7% vs 34.6% (-17.1% YoY)
Revenue per utilized piece of rental equipment: $14,584 vs $13,596 (+7.3% YoY)
Pieces of rental equipment: 8,010 vs 8,053 (-0.5% YoY)
Rental equipment utilization: 16% vs 15% (+6.7% YoY)
Heavy trucks: 58 vs 68 (-14.7% YoY)
Compression and Process Services
revenue: $182.4M vs $133.2M (+36.9% YoY)
gross profit: $30.6M vs $26.6M (+15.0% YoY)
gross margin: 16.8% vs 20.0% (-16.0% YoY)
EBITDA: $26.8M vs $22.2M (+21.0% YoY)
EBITDA margin: 14.7% vs 16.6% (-11.6% YoY)
Compression horsepower on rent at period end: 31,790 vs 43,273 (-26.5% YoY)
Compression rental utilization: 59% vs 63% (-6.3% YoY)
Fabrication sales backlog: $554.5M vs $303.9M (+82.5% YoY)
Well Servicing
revenue: $33.2M vs $29.8M (+11.4% YoY)
gross profit: $8.9M vs $5.9M (+51.2% YoY)
gross margin: 27.0% vs 19.9% (+35.7% YoY)
EBITDA: $10.1M vs $3.5M (+193.6% YoY)
EBITDA margin: 30.6% vs 11.6% (+163.5% YoY)
Service hours: 28,551 vs 27,440 (+4.0% YoY)
Revenue per service hour: $1,162 vs $1,085 (+7.1% YoY)
Utilization: 35% vs 27% (+29.6% YoY)
Service rigs: 61 vs 79 (-22.8% YoY)
Fleet Data
Total drilling rig fleet: 93 rigs
Canadian drilling rigs: 64
United States drilling rigs: 12
Australian drilling rigs: 17
AC triples: 4
AC doubles: 16
Mechanical doubles: 32
TDS and singles: 35
Australian shallow rigs: 6
Total Well Servicing fleet: 61 rigs
Canadian service rigs: 49
Australian service rigs: 12
RTS major rental equipment: approximately 8,010 pieces
RTS heavy trucks: 58
CPS compression rental fleet: 51,420 horsepower at June 30
Total capex: $45.0M vs $26.3M (+71.2% YoY)
YTD capex: $65.8M vs $60.8M (+8.3% YoY)
YTD Contract Drilling capex: $40.8M vs $33.3M (+22.7% YoY)
YTD RTS capex: $3.5M vs $14.3M (-75.5% YoY)
YTD CPS capex: $10.3M vs $2.0M (+403.1% YoY)
YTD Well Servicing capex: $11.1M vs $11.2M (-0.4% YoY)
$17.2M of H1 2026 capex related to $24.5M of capital commitments carried forward from 2025
The 2026 capex budget was increased by $32.7M to $120.1M from $87.4M
$24.9M of the $32.7M increase is growth capital
$7.8M of the $32.7M increase is maintenance capital
Total 2026 capital commitments including $24.5M carried forward from 2025 are $144.6M
$65.8M of total commitments had been funded through June 30
Remaining capital commitments are $78.8M
Australia
Most of the growth has come from market-share gains after investing in the Australian fleet, particularly the acquired Saxon drilling rigs.
Conditions remain stable, supported by strong regional natural gas prices.
About 11 drilling rigs were operating at the time of the call, with a twelfth returning from upgrades and another idle rig expected online by year-end.
CPS backlog and capacity
Fabrication backlog reached $554.5M, consists of firm contracts and extends into 2028.
Demand remains strong, but engine availability and existing plant capacity are limiting how quickly backlog can convert to revenue.
Q2 throughput was normal backlog conversion plus some manufacturing efficiencies, with no material one-time benefit.
Weirton expansion
Some efficiencies from changes to the U.S. manufacturing process should begin showing up in Q3.
The expansion remains on time and on budget for completion in Q1 2027, with the larger throughput benefit ramping through 2027.
CPS margins
Scarce manufacturing capacity is being allocated toward better-margin work.
Scale and better overhead absorption should help margins as the business grows, although ramp-up costs are currently being expensed.
Total is also seeing demand for power-generation equipment alongside compression and process equipment.
Compression rentals
Quarter-end utilization can move around significantly depending on package timing.
Several idle compression packages were placed under a new rental agreement after quarter-end.
Canadian drilling
Canada improved ahead of the U.S. in Q2, driven mainly by oil and liquids activity.
Upgraded equipment helped utilization and market share, with strong demand for super singles, AC doubles and the converted AC triple.
The second mechanical-double-to-AC-triple conversion is on time and on budget, and additional conversions could follow.
Canadian rig additions
An upgraded super single entered service in late July.
Three idle high-spec service rigs are being upgraded, are already spoken for and are expected online by year-end.
U.S. drilling
Activity began improving late in Q2, particularly in Texas and New Mexico.
Several idle rigs were reactivated, resulting in $1.3M of start-up costs during the quarter.
Total expects steady improvement in North American activity through the second half if oil prices remain supportive.
RTS
Total is beginning its first meaningful heavy-truck replacement cycle in years.
New equipment is focused on product lines that are currently sold out and should be deployed by year-end.
M&A
Total continues to review a number of acquisition opportunities and expects more consolidation in North American energy services.
The company was disappointed it was not more involved in the Citadel transaction.
Acquisitions still have to compete with organic growth investments and share buybacks for capital.
CPS backlog - Backlog of $554.5M provides visibility into 2028, with quoting activity remaining strong.
Weirton - The expansion remains on time and on budget for Q1 2027 completion, with the full benefit ramping through 2027.
Compression rentals - Several idle packages were placed under a new rental agreement after quarter-end.
Canada drilling - Activity remains strong, with very strong demand for upgraded rigs and the second double-to-triple conversion.
U.S. drilling - Activity began improving late in Q2, particularly in Texas and New Mexico.
North America - Total expects a good second half if commodity prices remain supportive, with rig counts improving at a measured pace.
Canada service rigs - Three upgraded rigs are already spoken for and expected online by year-end.
Australia drilling - One upgraded rig is returning to service and another idle rig is expected online by year-end.
Australia - Industry conditions are expected to remain stable, supported by strong natural gas prices.
RTS - New and refurbished equipment should be deployed by year-end, with truck replacements expected to help margins.
I have TOT trading at 5.1x EV/ttm EBITDA and just under 10x ttm FCF. Looking ahead the stock gets cheaper. They upped their capex budget and delineated between growth and maintenance capex, so you could tease out a maintenance free cash flow number for 2026 if you want.
Some companies just keep on winning. TOT is a good example. I would expect them to keep up with the NCIB. I would also expect a dividend increase (likely in the new year).
Their comments on the demand for the high-spec rigs and that they wanted to be more involved with Citadel (to be acquired by Ensign) is very interesting to me. This makes me think that the cycle is firm for the high-spec rigs, and I could see TOT looking to do some M&A to gain more exposure.
Australia continues to perform well. The Saxon acquisition significantly expanded TOT’s existing Australian drilling presence, and the follow-on rig upgrades are now translating into a much larger contribution.
Despite the run up, TOT does not seem expensive to me. I like the idea of these strong allocators with some more dry powder to execute on a transaction.
Thanks for reading my work.
Dean
long TOT
Comments
Nothing yet. Say the first thing.
Sign in to join the conversation.