
Disclosure: I own shares in ROMJ. I am not a professional. Please do your own due diligence.
Rubicon Organics is the Canadian leader in certified organic and premium cannabis. The company has a vertically integrated model and national distribution, with brands including Simply Bare Organics, 1964 Supply Co., Wildflower and Homestead Cannabis Supply.
The company operates two cultivation facilities in British Columbia: the 125,000-square-foot Pacifica hybrid greenhouse in Delta and the 47,500-square-foot Cascadia indoor facility in Hope. Cascadia was acquired in 2025 and is expected to increase annual production capacity by approximately 40%.
Price: $0.50 CAD
MC: ~36 million CAD (diluted)
EV: ~ 47.5 million CAD
1 year performance: -18%
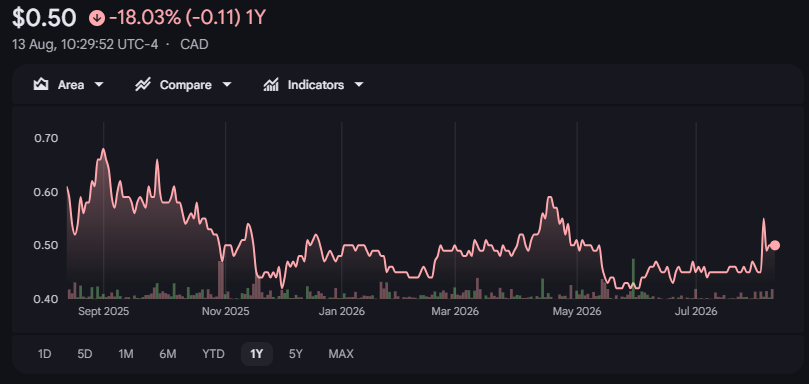
Rubicon reported on yesterday before market open and held a call. Results were better than my expectations with yields improving at Pacifica and the stock has been flat since reporting.
all numbers in CAD unless stated otherwise
Revenue (net of excise tax): $18.5M vs $15.0M (+23.1% YoY)
Gross Margin after fair value adjustments: 41.3% vs 39.2% (+203 bps YoY)
Adjusted EBITDA: $1.1M vs $1.4M (-18.4% YoY)
Adjusted EBITDA Margin: 6.1% vs 9.2% (-312 bps YoY)
Cascadia pre-revenue startup costs: $1.2M vs $0.0M (+100.0% YoY)
Cascadia revenue: approximately $0.5M vs $0.0M (+100.0% YoY)
Cascadia revenue as a percentage of Q2 revenue: 2.4% vs 0.0% (+240 bps YoY)
Cascadia generated approximately $0.5M of revenue in Q2 2026 vs $0.0M in Q2 2025 (+100.0% YoY)
Cascadia represented 2.4% of Q2 revenue vs 0.0% in Q2 2025 (+240 bps YoY)
Cascadia reached 1964 quality standards earlier than expected
Cascadia yields remained below target, with optimization expected through the rest of 2026
Pacifica per-crop yields increased approximately 20% in H1 2026 vs H1 2025 (+20.0% YoY)
Revenue (net of excise tax): $32.1M vs $27.4M (+17.5% YoY)
Gross Profit after fair value adjustments: $11.1M vs $10.1M (+9.7% YoY)
Gross Margin after fair value adjustments: 34.5% vs 36.9% (-244 bps YoY)
Adjusted EBITDA: $0.5M vs $2.1M (-74.1% YoY)
Adjusted EBITDA Margin: 1.7% vs 7.7% (-599 bps YoY)
Cascadia pre-revenue startup costs: $2.3M vs $0.0M (+100.0% YoY)
Canada / domestic sales: approximately 97.0% of Q2 sales vs 100.0% in Q2 2025 (-300 bps YoY)
International sales: approximately 3.0% of Q2 sales vs 0.0% in Q2 2025 (+300 bps YoY)
U.K.: 1964 Supply Co. launched in the U.K. medical cannabis market during Q2 2026 vs no branded U.K. sales in Q2 2025 (+100.0% YoY)
1964
64% of Q2 revenue, disclosed on the conference call
Q2 growth was supported by dried flower growth and pre-roll growth across 1964 and Simply Bare
Brand of the Year at the 2026 High Buds Club Awards and the 2026 Grow Up Industry Awards
1964 product awards: Stinky Pinky won Indica Flower of the Year at the 2026 High Buds Club Awards
Simply Bare
25% of Q2 revenue, disclosed on the conference call
Q2 growth was supported by dried flower growth, pre-roll growth, new genetics and larger-format products
Simply Bare award: BC Organic Fruit Loopz won Best Dry Flower at the 2026 Grow Up Industry Awards
Wildflower
6% of Q2 revenue, disclosed on the conference call
Wildflower remained the #2 topical brand in Canada
Wildflower had the #1 topical SKU in Canada
Wildflower award: Wildflower Extra Strength Relief Stick won Topical of the Year at the 2026 High Buds Club Awards
International
International products: International revenue mix was 3.0% of Q2 revenue in the MD&A and 4% of Q2 revenue on the call vs 0.0% in Q2 2025 (+300 to +400 bps YoY)
1964 U.K. launch: 1964 Supply Co. launched in the U.K. medical cannabis market during Q2 2026 vs no branded U.K. sales in Q2 2025
International product markets: International sales included the U.K., Germany and Australia in Q2 2026
Market share
All price tiers flower market share: 1.9% vs 1.8% (+10 bps YoY)
All price tiers pre-roll market share: 3.2% vs 2.8% (+40 bps YoY)
All price tiers vape market share: 1.2% vs 1.4% (-20 bps YoY)
All price tiers concentrates market share: 5.7% vs 5.7% (flat YoY)
All price tiers topicals market share: 30.8% vs 27.3% (+350 bps YoY)
Total capital plan
2026 capex approximately $5.0M to $5.2M total
H1 2026 investing cash flow: $2.6M vs $5.8M in H1 2025 (-55.3% YoY)
Cascadia costs
Cascadia acquisition cost: $4.7M total, with $0.6M funded by the offering and $4.1M funded from cash on hand
Cascadia optimization: H1 2026 spending included targeted projects associated with optimization of the Cascadia facility
Base operations / platform costs
2026 in-sourcing / processing capex: approximately $1.5M
2026 automation / efficiency capex: approximately $1.5M
2026 maintenance capex: approximately $2.0M
Pre-roll automation and other capital investments: $1.0M planned and $1.0M actual as of June 30, 2026
Pacifica margin projects: H1 2026 spending included smaller-scale margin accretive projects at Pacifica
General working capital purposes: $0.3M planned and $0.3M actual as of June 30, 2026
Pacifica yield
Pacifica per-crop yields were up approximately 20% in H1 2026 compared with H1 2025.
The improvement came from both existing genetics and new genetics, with better quality, terpene results, potency and consistency.
Cascadia ramp
Cascadia generated approximately $0.5M of revenue in Q2 after moving out of the pre-revenue phase in the quarter.
Quality reached 1964 standards earlier than expected, but yields are still below long-term targets.
Cascadia should become a more meaningful revenue contributor in Q3 and Q4.
Gross margin
Gross margin before fair value adjustments was 30% in Q2, or approximately 36% excluding pre-revenue Cascadia operating costs.
Margin work is focused on cultivation yields, pre-roll automation, in-house hydrocarbon extraction and better product allocation.
Product mix
Q2 growth included a mid-teens increase in dried flower and more than 40% growth in pre-rolls across 1964 and Simply Bare.
1964 represented 64% of Q2 revenue, Simply Bare was 25% and Wildflower was 6%.
Premium market
Rubicon reached 10% national premium flower share and 5% premium pre-roll share in Q2.
The Canadian premium category declined in total dollars, while Rubicon grew.
Pre-rolls
Rubicon has three automated pre-roll machines operating.
Standard flower pre-rolls remain the main focus, while infused pre-rolls are still part of the market.
Vapes and extraction
Vape performance was below internal expectations.
In-house hydrocarbon extraction is expected to improve vape and concentrate profitability beginning in Q1 2027.
International
International sales were 3.0% of Q2 revenue in the MD&A and rounded to 4% on the call.
1964 launched in the U.K. medical cannabis market during Q2, which is the company’s first branded international market.
Rubicon has agreements in two international markets and expects up to four markets by year-end.
Capacity
Current annual capacity is 15,500 kg, including 11,000 kg at Pacifica and 4,500 kg at Cascadia.
There is a path to 20,000 kg over 18 to 24 months, but that would require additional capital improvements.
Revenue growth: Rubicon expects revenue to ramp through Q3 and Q4 as Cascadia contributes.
Gross margin: Reported gross margin is expected to improve in H2 as Cascadia revenue catches up to the cost base.
Profitability: Rubicon expects to remain Adjusted EBITDA positive through the rest of 2026.
Cascadia: Cascadia yields are expected to reach initial target levels by the end of 2026.
2027: Margin projects are expected to be fully realized by early 2027.
International: International revenue is expected to average approximately 10% of fiscal 2026 revenue.
Hydrocarbon extraction: In-house hydrocarbon extraction is expected to benefit vape profitability in Q1 2027.
Capital spending: 2026 capex is expected to be approximately $5.0M to $5.2M.
I have ROMJ at 13.5x EV/ttm EBITDA. I think the best way to look at ROMJ is a “run-rate” operation with Cascadia at operational capacity. I am not sure exactly what quarter we get very clean financials from the business, but I’m expecting that the business does 14 million in EBITDA at some point (and grow from there). That would put ROMJ at 3.4x EV/forward EBITDA.
I was surprised by the yield increases in Pacifica. The brand performance continues to validate my thesis that the premium side of the market is not experiencing price compression. I am not expecting ROMJ to raise capital for the Cascadia buildout as my estimate has them at well under 1x net debt/EBITDA and the worst of the investment is behind them.
I think that once we see some meaningful revenue from Cascadia the shares will re-rate. But I also think that ROMJ is a reasonable take-out target for a larger LP. They have the ability to sell into international markets with two high quality facilities. They mentioned that with further investment they can reach 20,000 kg in production. There are enough LPs with lots of cash that may lack the business acumen that ROMJ (and others) have demonstrated that could put some capital to work.
I continue to hold my shares in ROMJ in the cannabis basket.
Thanks for reading my work.
Dean
long ROMJ.v
Comments
Nothing yet. Say the first thing.
Sign in to join the conversation.