

Last week, two headlines landed less than twenty-four hours apart, and if you stripped the dates off you would swear they came from two different countries.
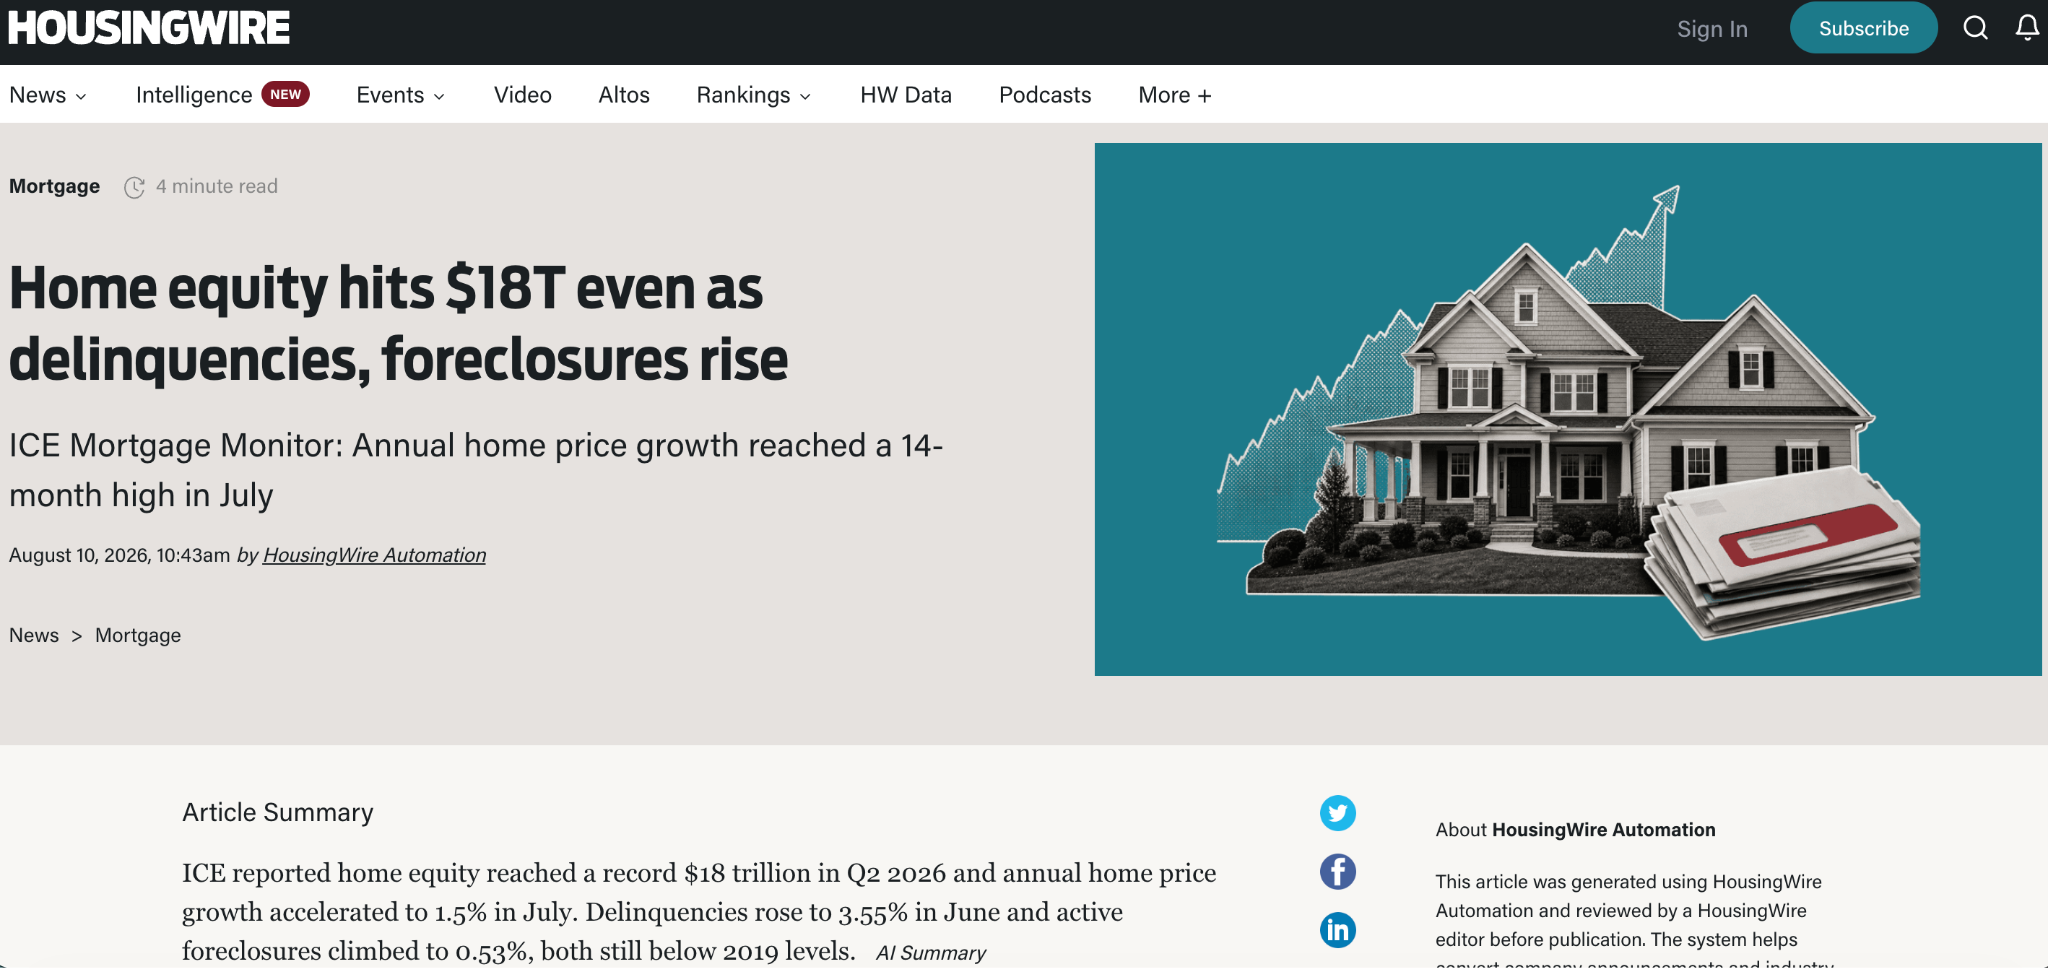
On August 10th, Intercontinental Exchange reported that American mortgage holders are sitting on a record $18 trillion in home equity, the highest figure ever recorded, with the average borrower now holding roughly $212,000 in tappable wealth against their house.
Then, on August 11th, the National Association of Realtors released a report so tepid that its own chief economist described the market not as healthy, but as barely alive: existing home sales down again, mortgage rates at their highest point of the year, and a sales pace that Lawrence Yun himself admitted is a full million homes below what a “normal” market would produce.
I’ve done a couple articles discussing the post-COVID housing unwind: the regional fracture between a boiling Northeast and a collapsing Sun Belt, the institutional buyers everyone loved to blame.
That story hasn’t gone away, but it’s no longer the interesting one. The interesting story is the one hiding inside the aggregate numbers every headline reports as if they describe a single, unified market. They don’t.
There are two housing markets operating in the United States right now, wearing the same statistics like a shared coat, and the gap between them is the actual story of 2026.
“Home sales have been remarkably stable, even amid the rising mortgage rate environment of the past few months,”
Yun said, before immediately undercutting himself by noting that a normal pace would be closer to 5 million annual sales, versus the roughly 4 million we’re actually getting.
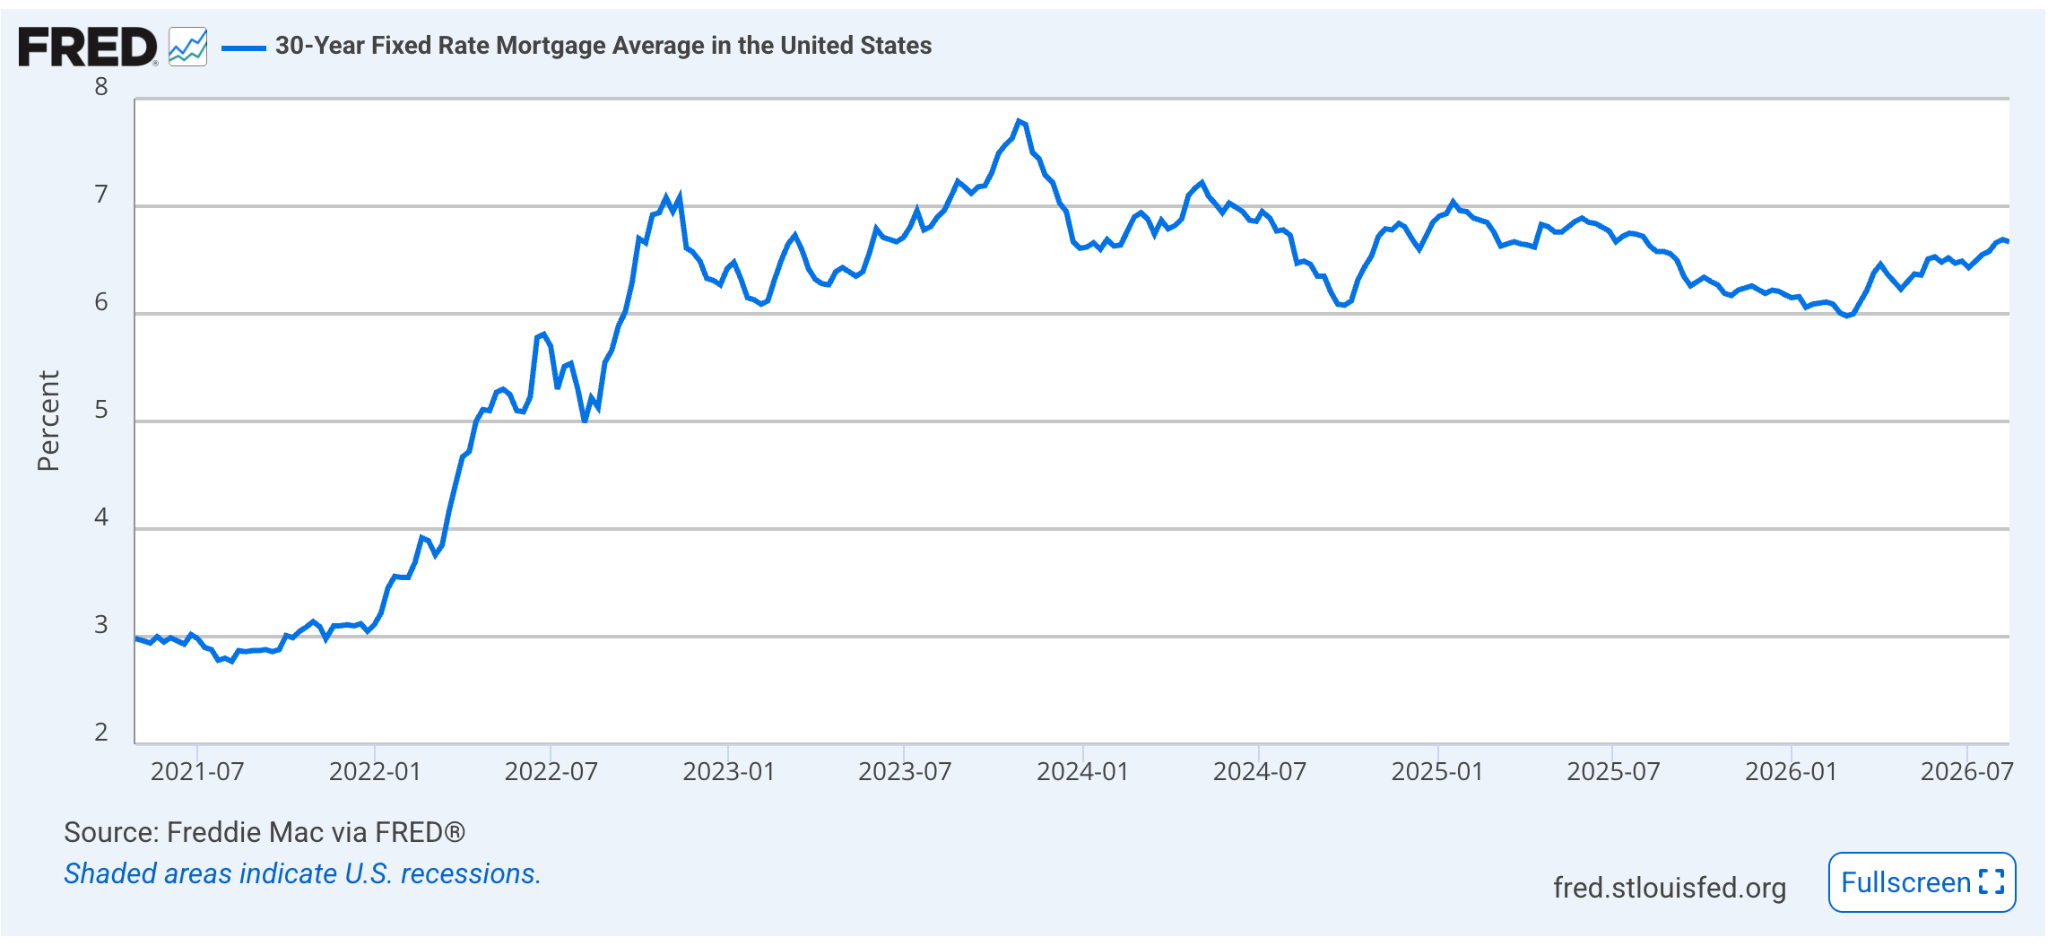
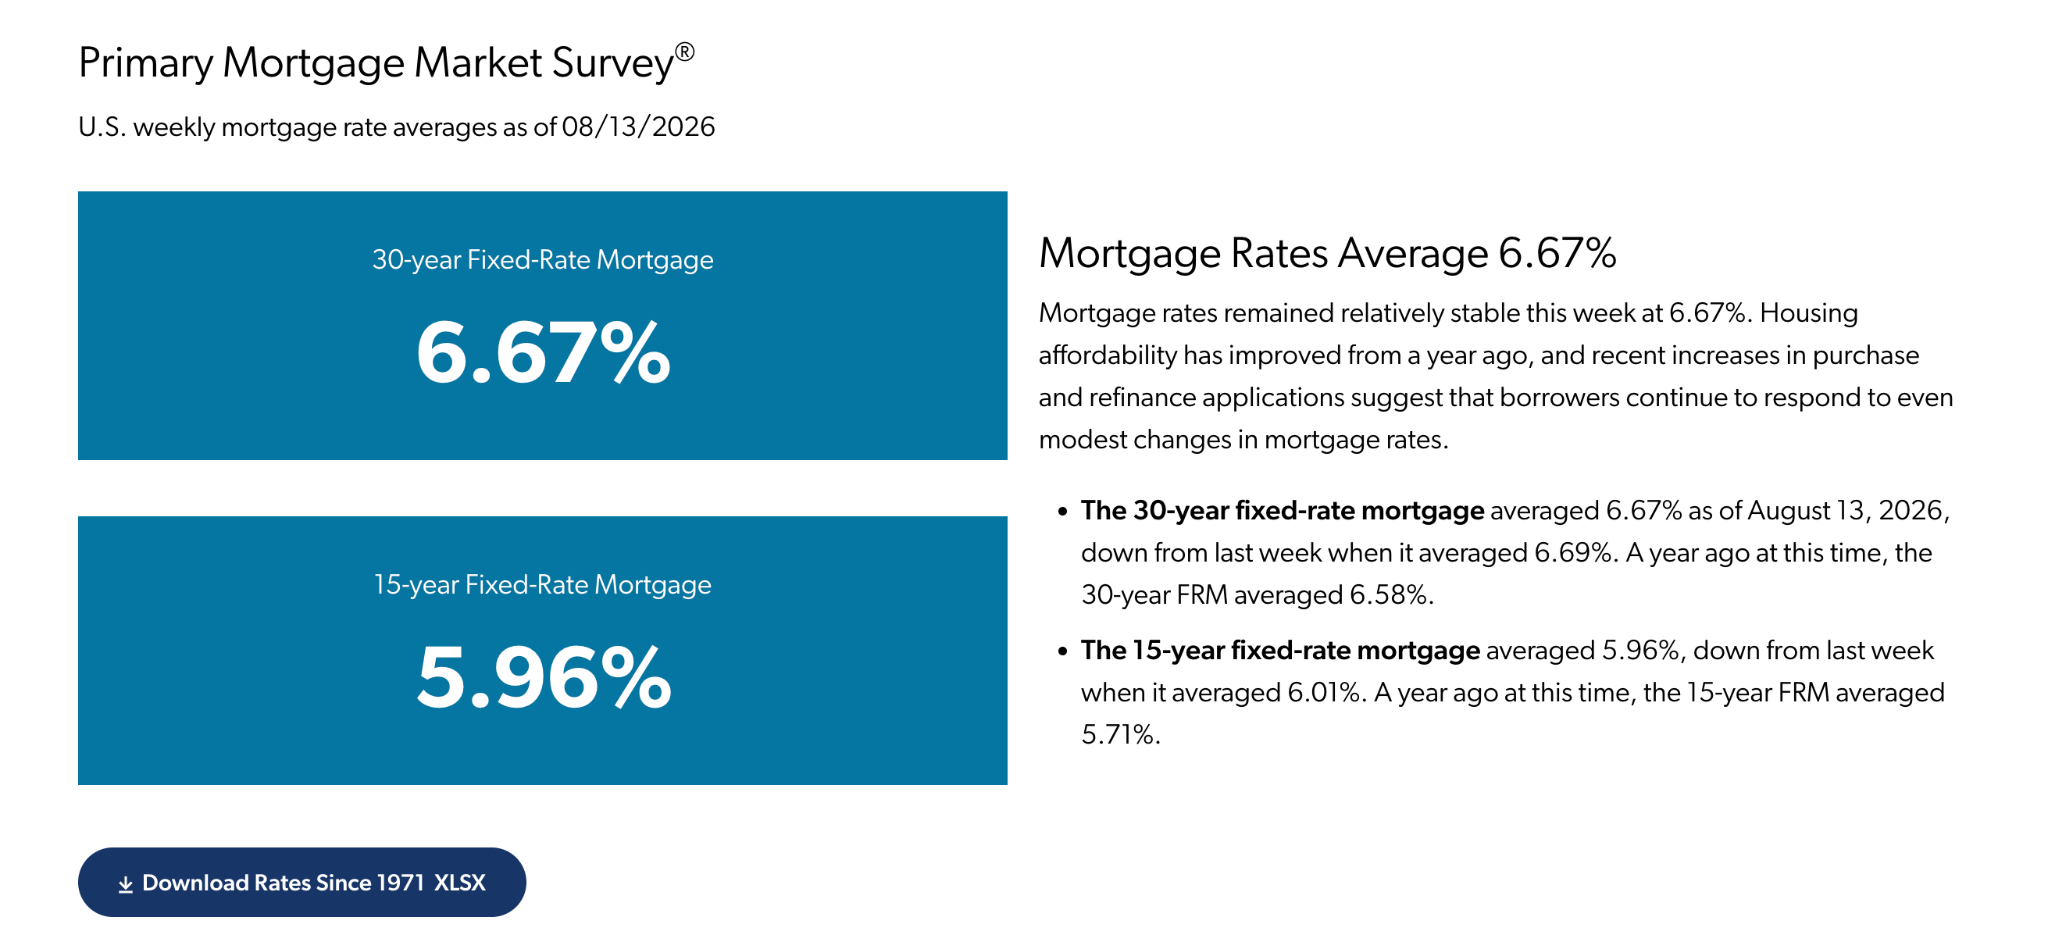
Freddie Mac’s 30-year fixed rate hit 6.69% the week of August 6th, its fifth consecutive weekly increase and the highest reading of 2026, up from 6.63% a year prior. That’s still below the 7.68% average the series has posted since 1971, for whatever comfort that’s worth to someone closing on a $434,100 median-priced home.
Rates briefly dipped under 6% in late February, two days before the U.S. and Israel struck Iran, and they’ve been grinding higher against sticky inflation and geopolitical noise ever since.
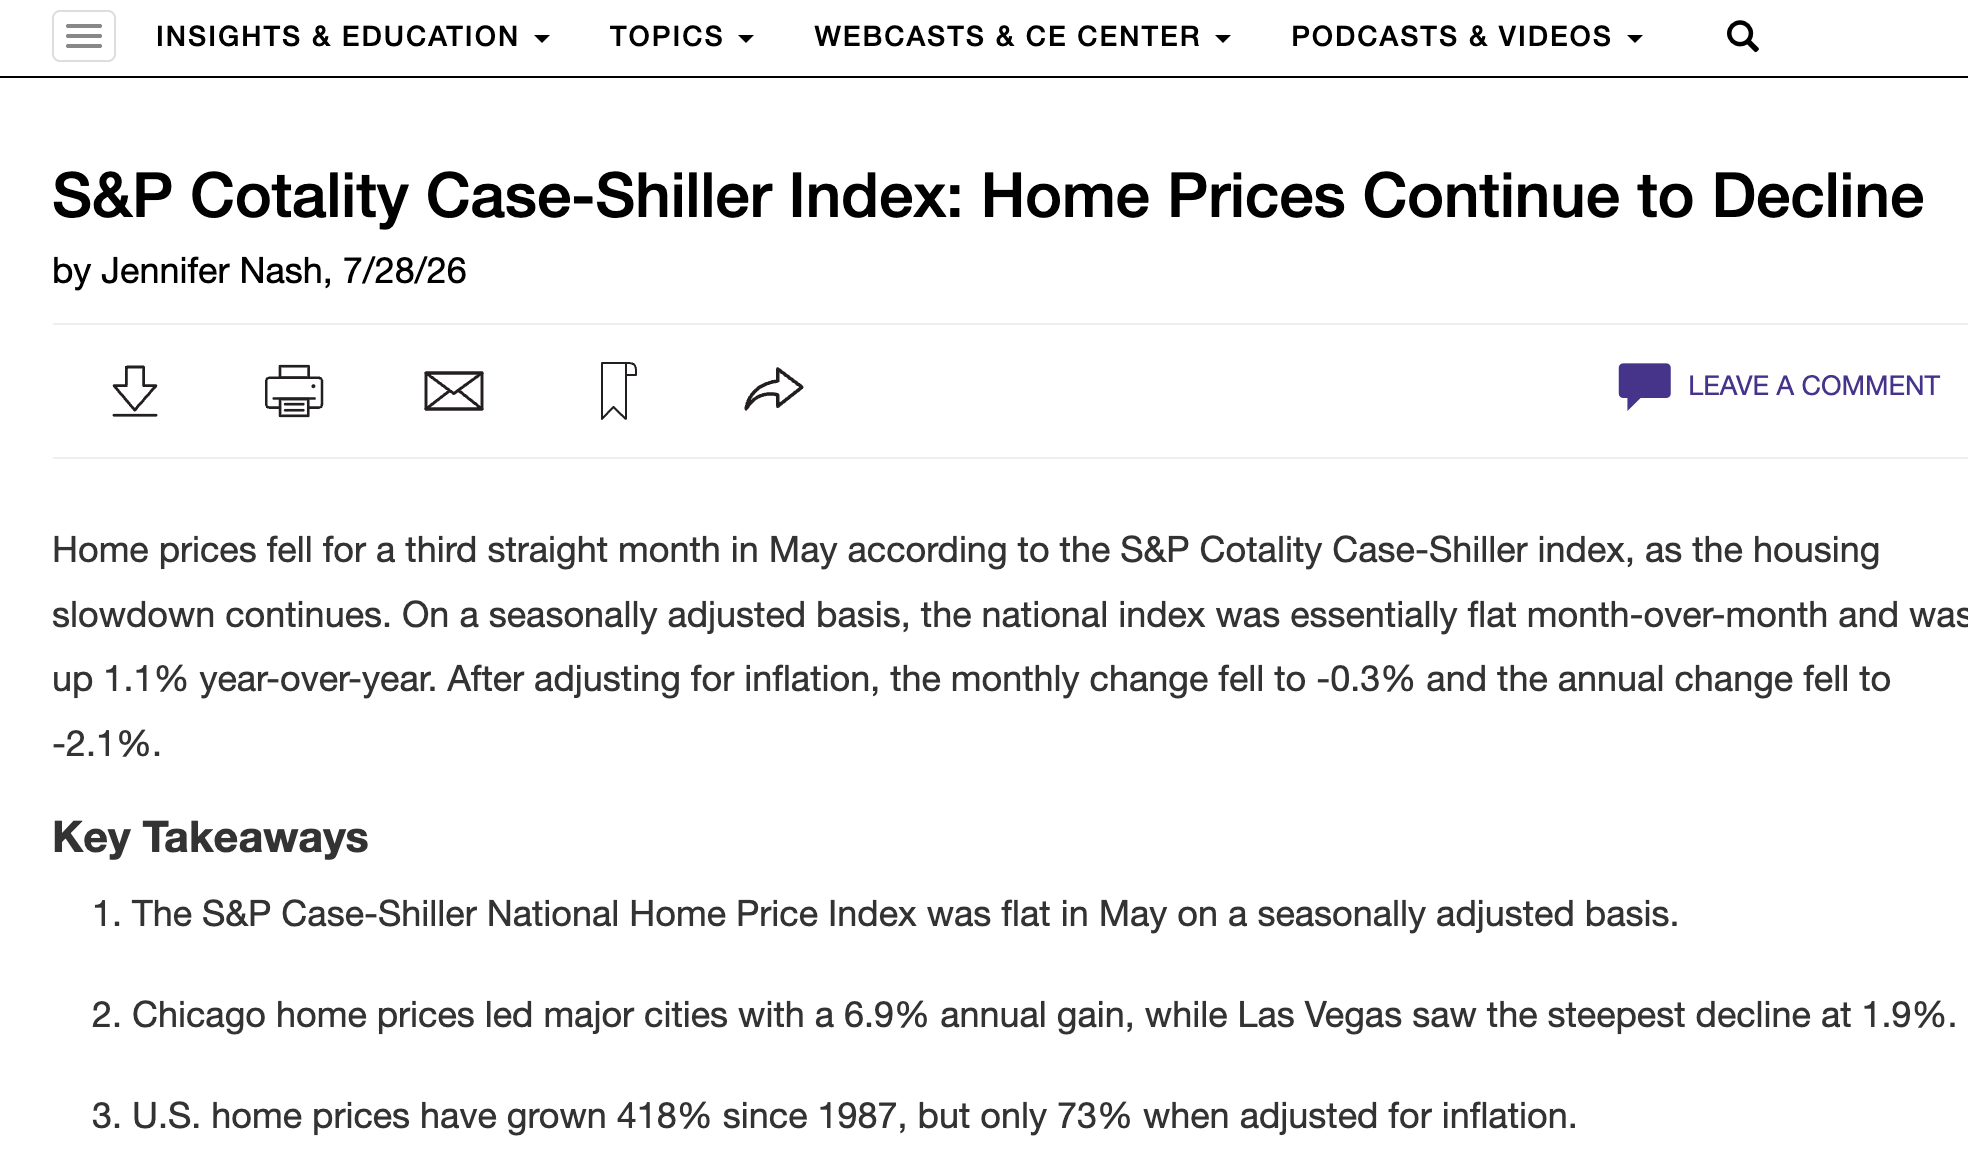
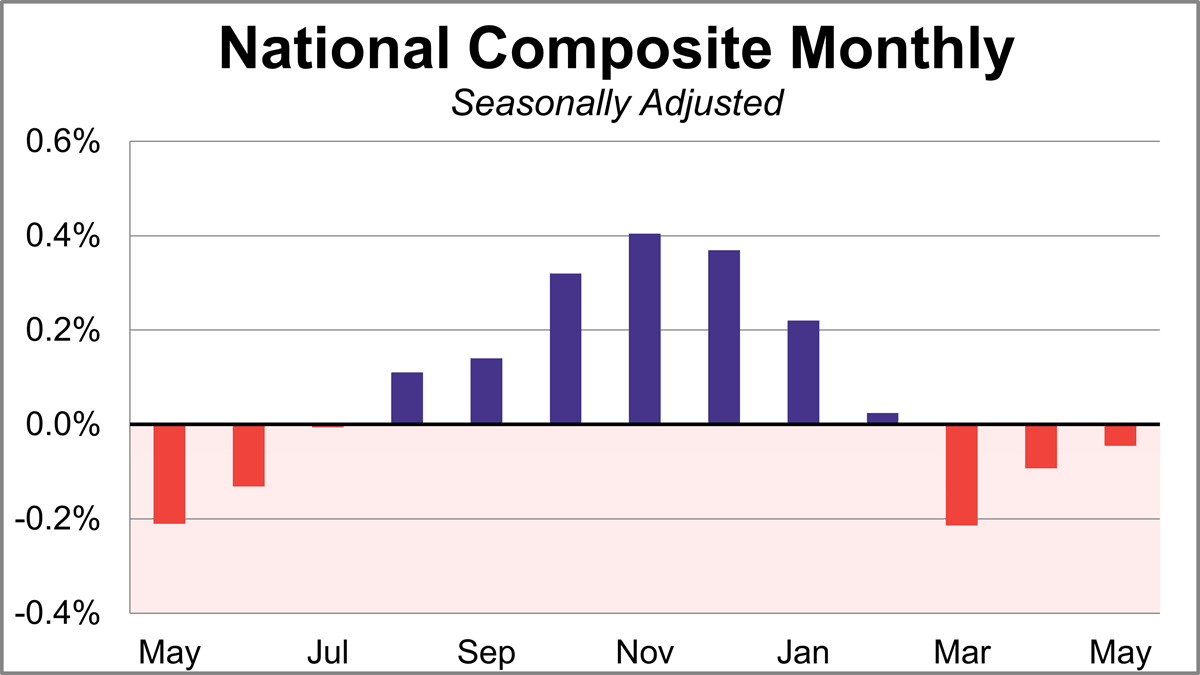
American home values have now fallen in real, inflation-adjusted terms for eleven consecutive months. Nominal headlines keep printing small green numbers; the actual purchasing power represented by the average house keeps shrinking.
If you break the national number apart by city and the flatness turns out to be two opposite trends canceling each other out.
Chicago posted a 6.5% annual gain in April, trailed by New York at 3.8% and Cleveland at 3.2%, older, supply-constrained Northern metros. On the other side: Seattle down 2.3% year-over-year, Denver down 1.8%, Tampa down 1.8%, Dallas down 1.6%, Phoenix down 1.7%, the exact Sun Belt boomtowns that absorbed the heaviest pandemic-era migration and the heaviest post-pandemic building.
This is the regional fracture I flagged in Housing Market Cracks a year ago, still intact, just with fresh numbers attached.
The professional forecasters have been embarrassingly wrong in both directions trying to call this thing. Zillow entered 2026 projecting 1.2% national appreciation and a healthy rebound in sales volume.
By May, that forecast had been slashed to a decline of 0.2% over the following twelve months, blaming elevated rates and inflation eating into whatever savings buyers might see on housing costs. By August, with rates back above 6.6%, the company was warning outright that the market had already peaked for the year. Three forecasts, three different stories, in eight months.
Pull the delinquency data apart by loan type and the “remarkably stable” story stops being credible.
The Mortgage Bankers Association’s second-quarter survey showed the overall delinquency rate at 4.37%, a headline number that sounds unremarkable, boring even.
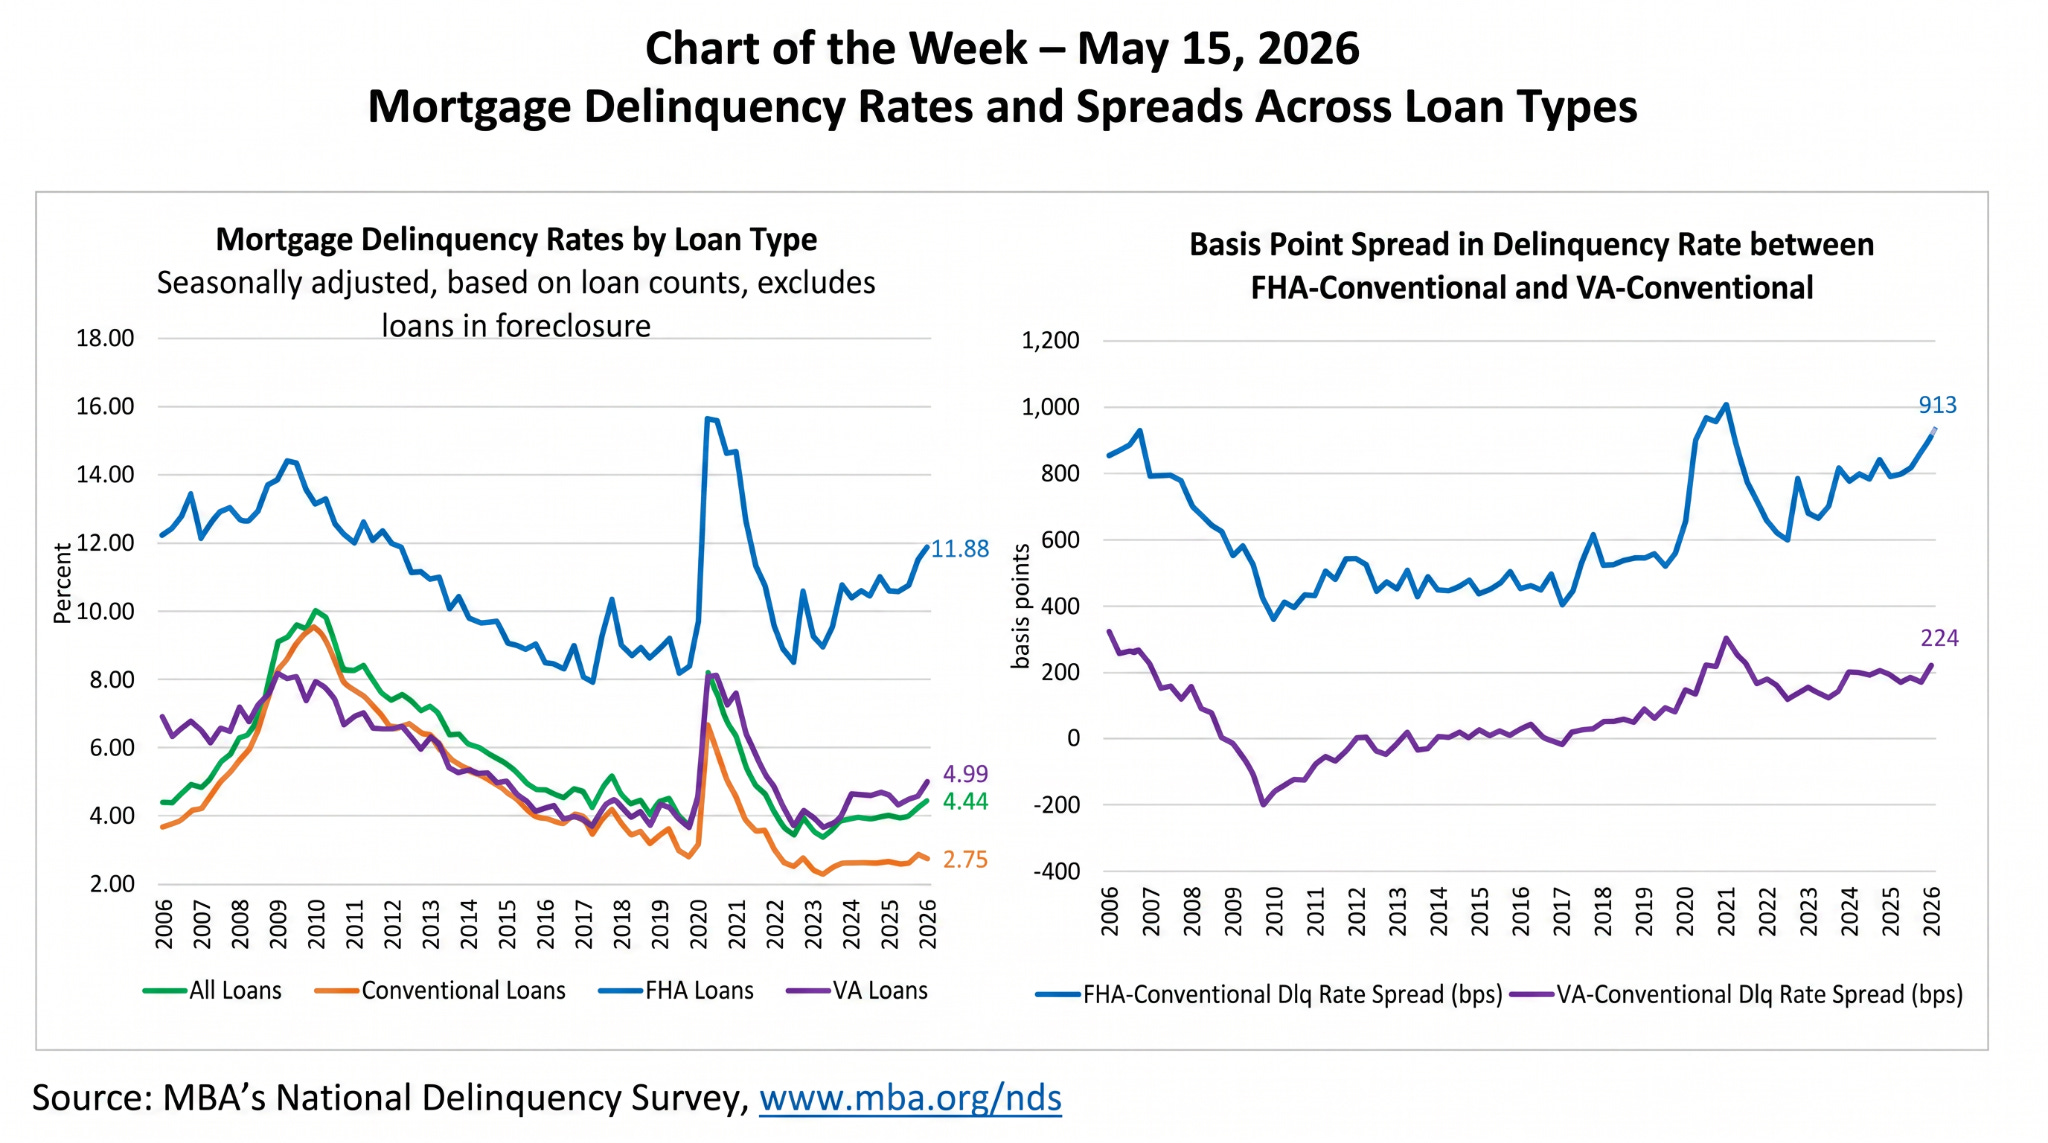
Inside that number: conventional loan delinquencies sit at 2.72%. FHA loan delinquencies sit at 11.79%.
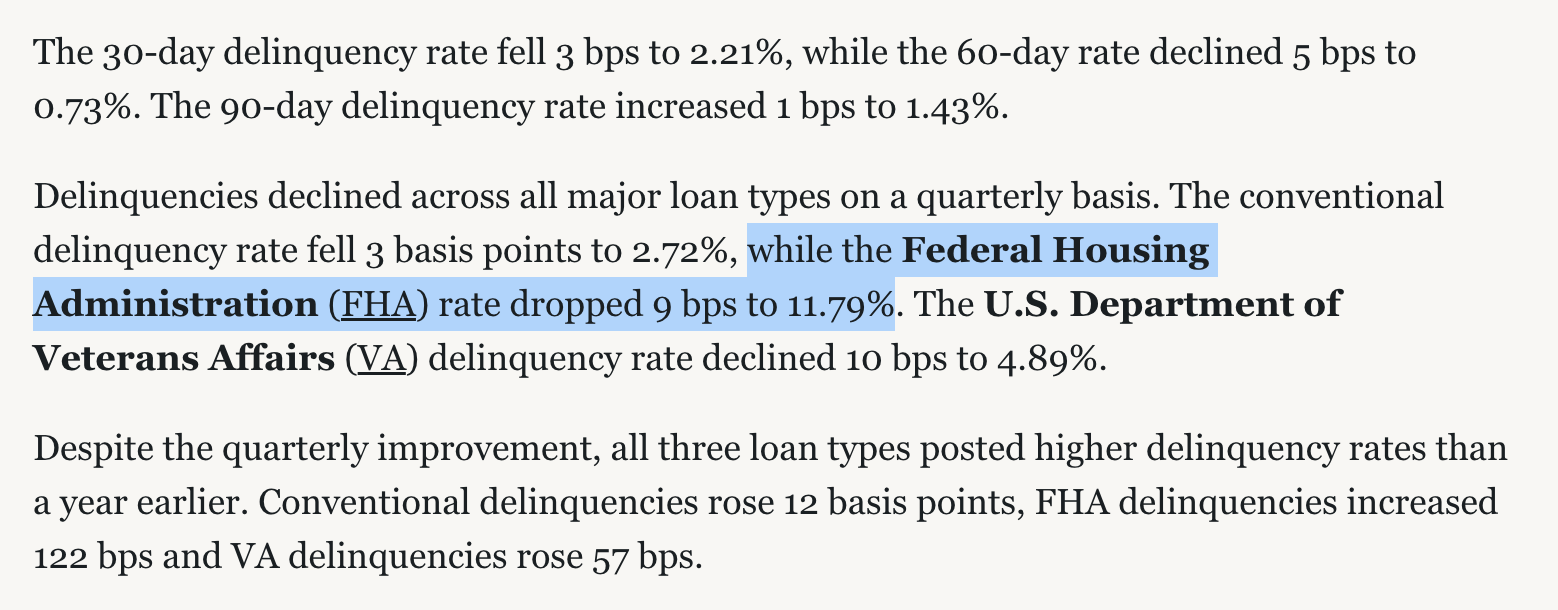
FHA borrowers, who tend to be first-time buyers and younger households without generational wealth behind them, are defaulting at more than four times the rate of conventional borrowers.
Serious FHA delinquency (90+ days past due) jumped from 3.57% in September 2025 to over 5% by January, a spike the industry press has largely buried under the aggregate headline. The FHA program exists specifically to get lower-wealth Americans into homeownership.
It is now the clearest early-warning signal for stress in the entire mortgage complex.
Cotality reported the national foreclosure inventory rate climbing to 0.4% in March, the highest level in six years, the first meaningful increase in over a year.
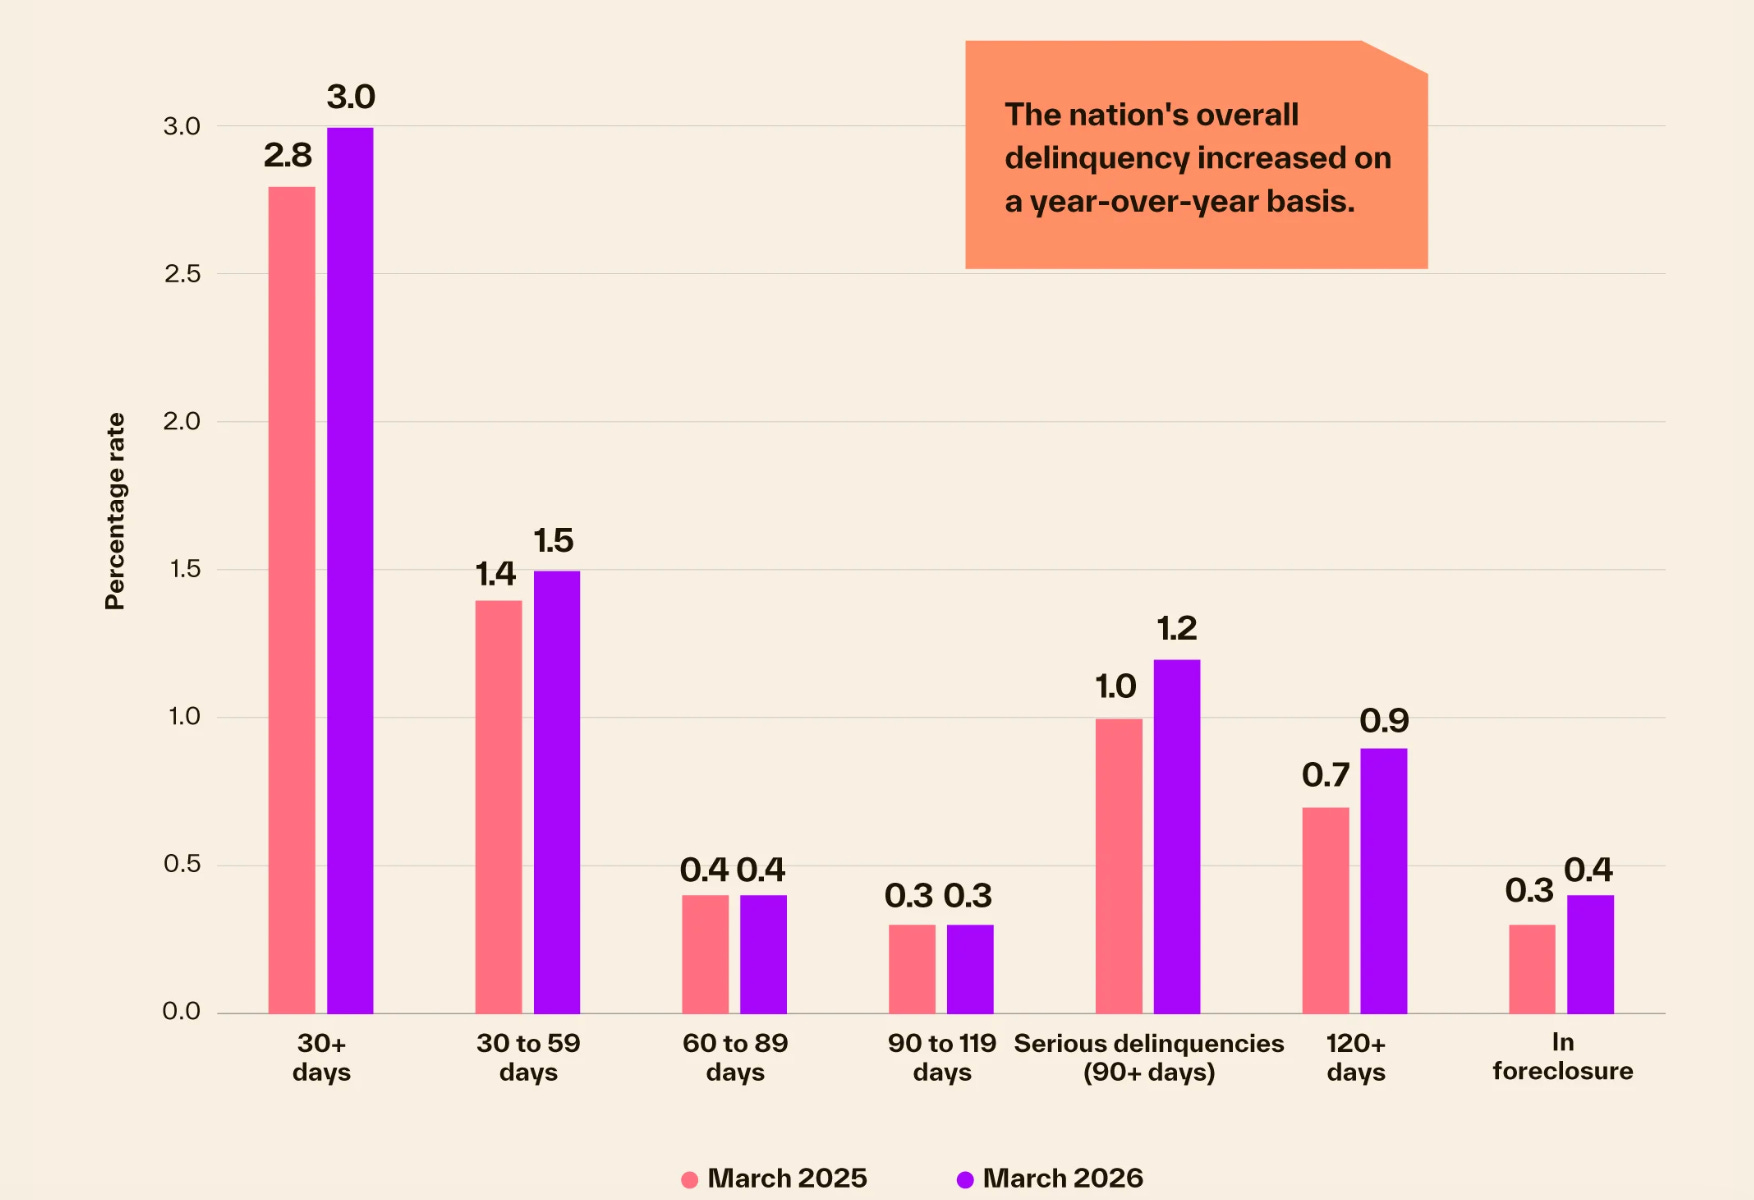
By May, ICE’s mortgage data showed active foreclosure inventory up 34% year-over-year to 280,000 loans, also a six-year high, with foreclosure starts running 19% above prior-year levels. Metros hit hardest weren’t randomly distributed: Pine Bluff, Arkansas; Odessa, Texas; Victoria, Texas. Small, lower-income Sun Belt metros absorbing the pain first, exactly the places without the equity cushion or the wage growth to weather 6.7% mortgage rates layered on top of insurance costs I’ll get to shortly.
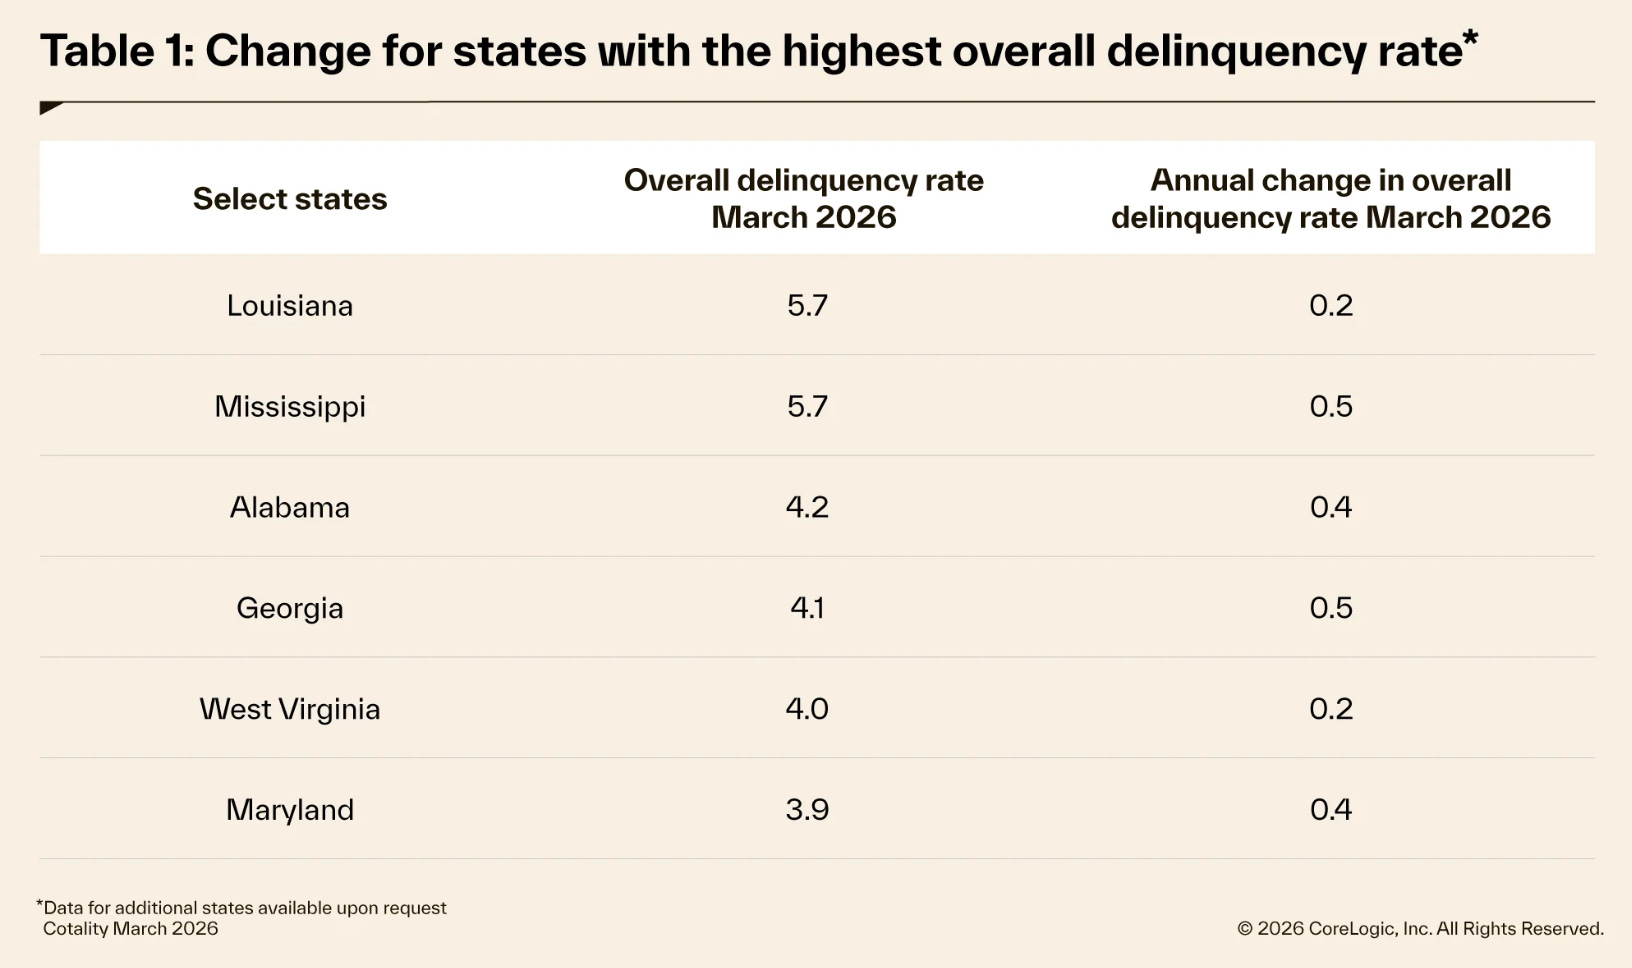
Meanwhile, about 813,000 borrowers are now underwater on their mortgages, up 44% year-over-year, and ICE’s own data shows exactly who they are: FHA and VA borrowers who bought between 2022 and 2025 near the top of the rate cycle, concentrated in Texas and Florida, the two states where prices have fallen furthest from their peaks.
Underwater and delinquent are two different problems, but they compound. A borrower who’s both has essentially no exit that doesn’t involve a short sale, a foreclosure, or years of waiting for a market that may not come back.
None of this shows up in “median home price, up 2.0% year-over-year.”
It can’t.
So how is it possible that the same market producing a six-year high in foreclosure inventory is also producing $18 trillion in record homeowner equity?
Because it’s not the same households on both sides of that sentence.
It’s the difference between someone who bought in 2020 at 3% and someone who bought in 2023 at 7%, and the entire supply side of this market is being shaped by the first group refusing to move.
Cotality’s own Q1 2026 report used the phrase directly: the “golden handcuffs” effect, in which homeowners sitting on ultra-low legacy mortgage rates simply will not sell, because selling means trading a 3% loan for something north of 6.5%.
The average loan-to-value ratio across mortgaged homes has fallen to just 43%, the lowest in over a decade.
Basically it’s this: Homeowners have never had more paper wealth locked inside their houses, and they have never had less incentive to unlock it by selling.
What they’re doing instead is borrowing against it without giving up the underlying rate.
ICE reported homeowners withdrew $47 billion in home equity during the first quarter of 2026, the strongest first-quarter total since 2021, driven almost entirely by second-lien loans and HELOCs rather than cash-out refinances.
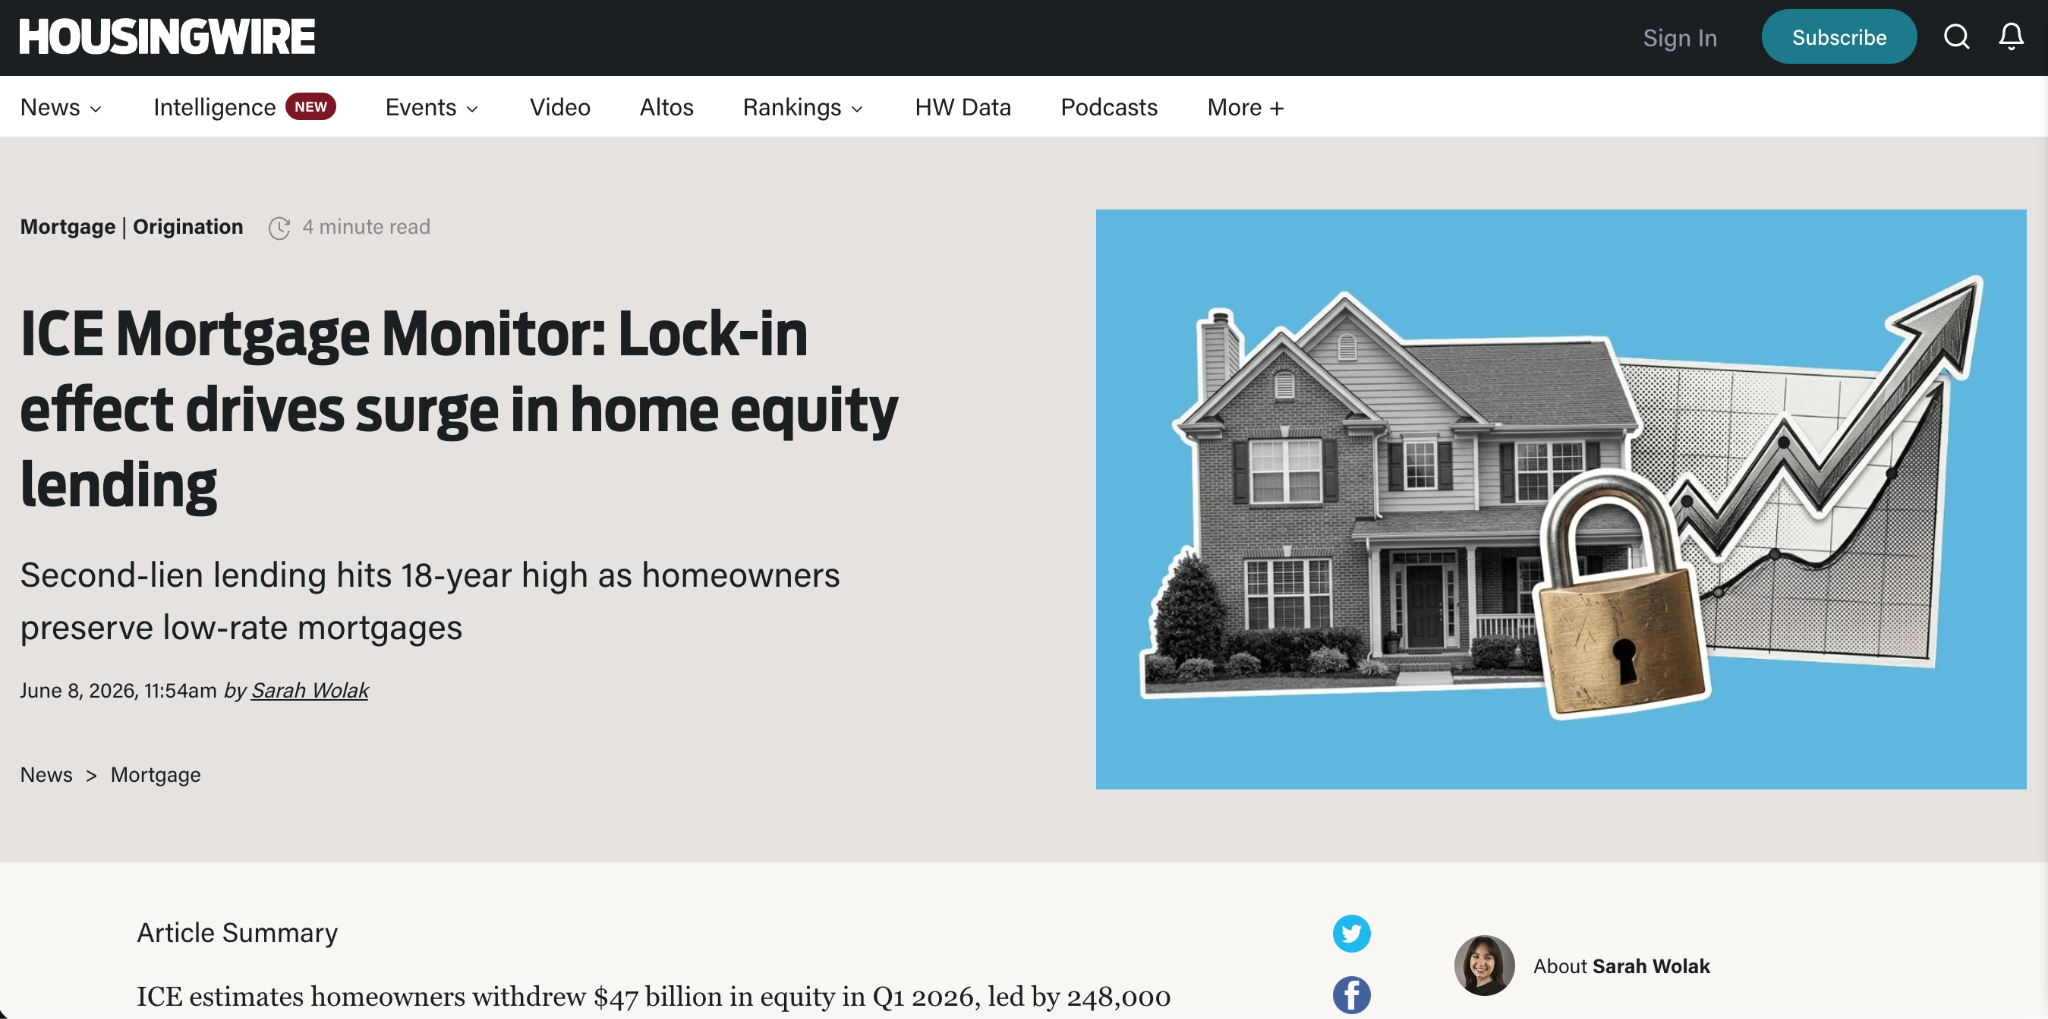
Borrowers who locked in rates during 2020 through 2022 accounted for nearly two-thirds of all second-lien originations in the quarter.
As Andy Walden at ICE put it, millions of homeowners are sitting on first mortgages “well below current market levels, making second liens and HELOCs an attractive way to access equity without giving up those loans.” This is the mechanism holding the entire supply side of the market hostage: rational individual behavior that adds up to a structurally broken market.
It’s why national active inventory is still running somewhere between 9% and 14% below pre-pandemic 2019 levels depending on the month you measure, even three years into a demand slowdown that should have flooded the market with listings.
It’s why year-over-year inventory growth has decelerated from nearly 29% to under 2% over the past twelve months.
Buyers without home equity of their own are stuck bidding on a shrinking pool of homes owned by people who bought before the rate shock, or on new construction from builders who are increasingly desperate.
And there’s another cost eating into affordability that has nothing to do with the Fed, nothing to do with Wall Street landlords, and nothing to do with any bill Congress could plausibly pass in an election year: insurance. And it’s structural in a way rates aren’t, because a rate cut can’t fix a wildfire.
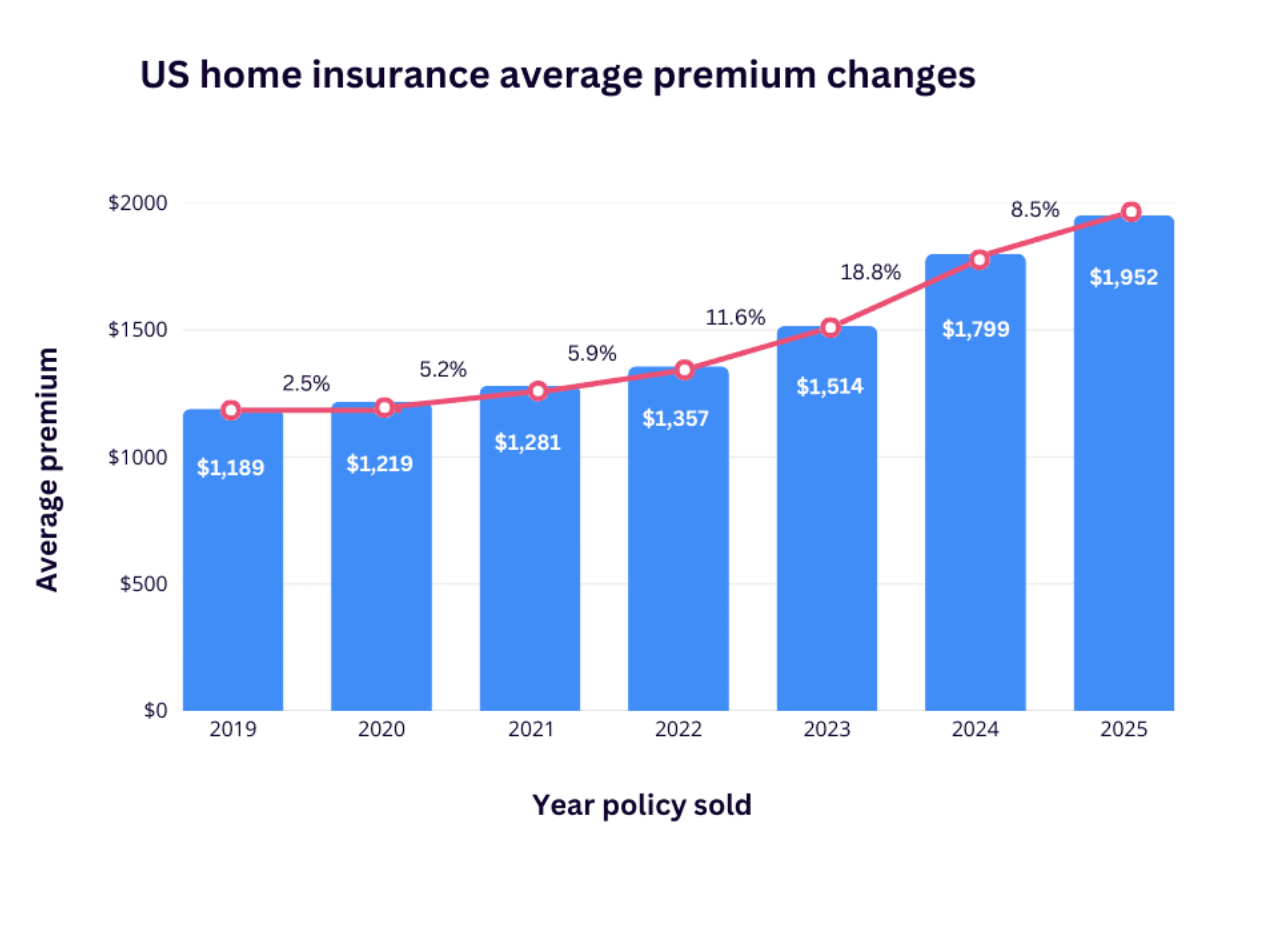
The average U.S. homeowners insurance premium is projected to hit roughly $3,057 in 2026, the fifth consecutive year of increases, after a 12% jump in 2025 alone. Since 2021, premiums are up 46% nationally, roughly triple the pace of inflation. Insurance now represents 9% of the typical homeowner’s monthly mortgage payment, an all-time high, a cost that shows up whether you financed the house at 3% or 7%.
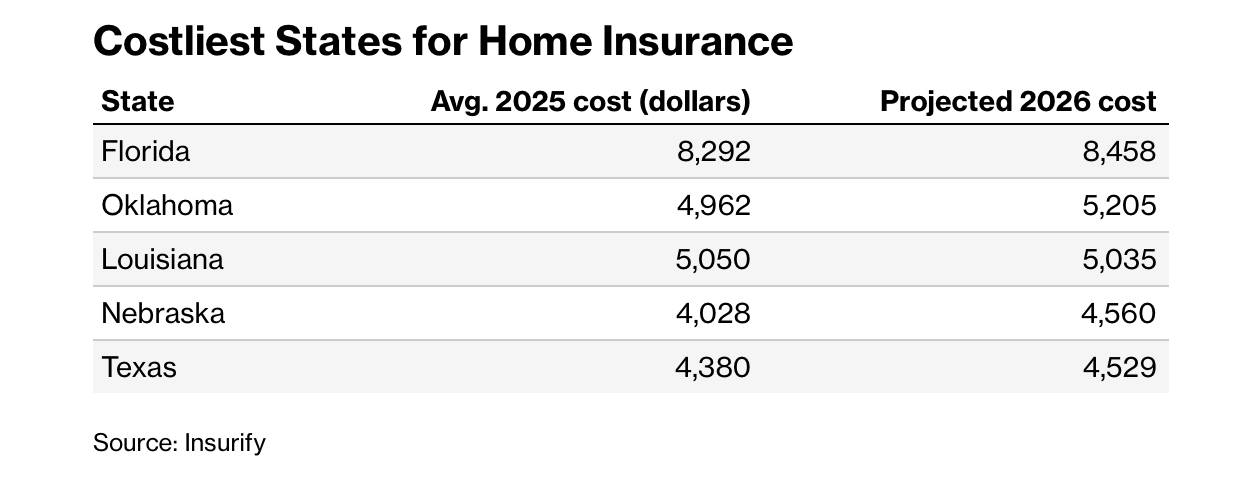
Florida remains the extreme case: an average premium near $8,292 a year, close to three times the national figure, even after state-level tort reform Governor DeSantis has touted as a fix. Independent tracking from Insurify shows premiums there actually rose 14.3% since those reforms took effect. California’s FAIR Plan, the insurer of last resort, now covers more than 451,000 policies and is seeking a 36% rate increase after the Los Angeles wildfires. And the crisis has quietly spread to places that never used to think about it: Minnesota premiums jumped 34% in 2025, Colorado 33%, Oklahoma 24%, driven by hail and severe convective storms rather than the hurricanes and fires that dominate the national conversation.
The economics behind this aren’t a mystery. Insurers paid out $1.11 in claims for every $1.00 they collected in premiums in 2023, a business model that cannot survive without much higher prices or a retreat from risk, and carriers have been doing both. Standard insurers have been quietly exiting the riskiest zip codes, pushing homeowners into the surplus lines market instead: in California, Florida, and Texas combined, excess and surplus policies made up roughly 16% of one major broker’s book by the end of 2025, up from under 2% two years earlier, a market with no rate caps at all. Every dollar added to a homeowner’s insurance bill is a dollar that never shows up in a mortgage rate headline and never factors into whether a buyer “technically” qualifies for a loan at closing. It just quietly makes the FHA delinquency chart above look worse every year.
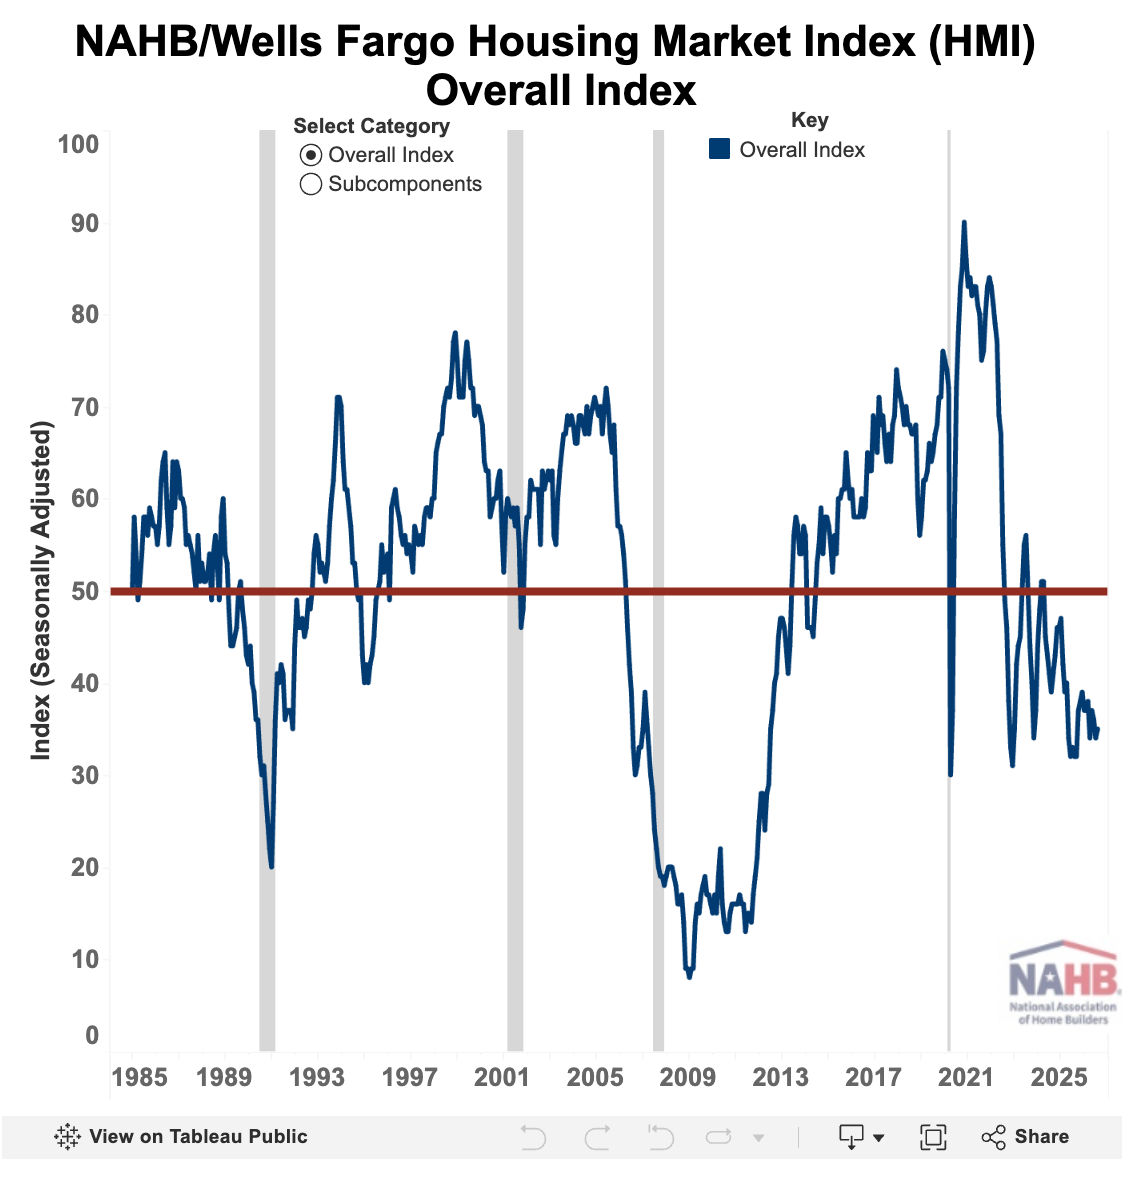
If existing owners are frozen by golden handcuffs and buyers are getting squeezed by rates and insurance simultaneously, you’d expect builders to be the pressure release valve. I
nstead they’re drowning in their own unsold product.
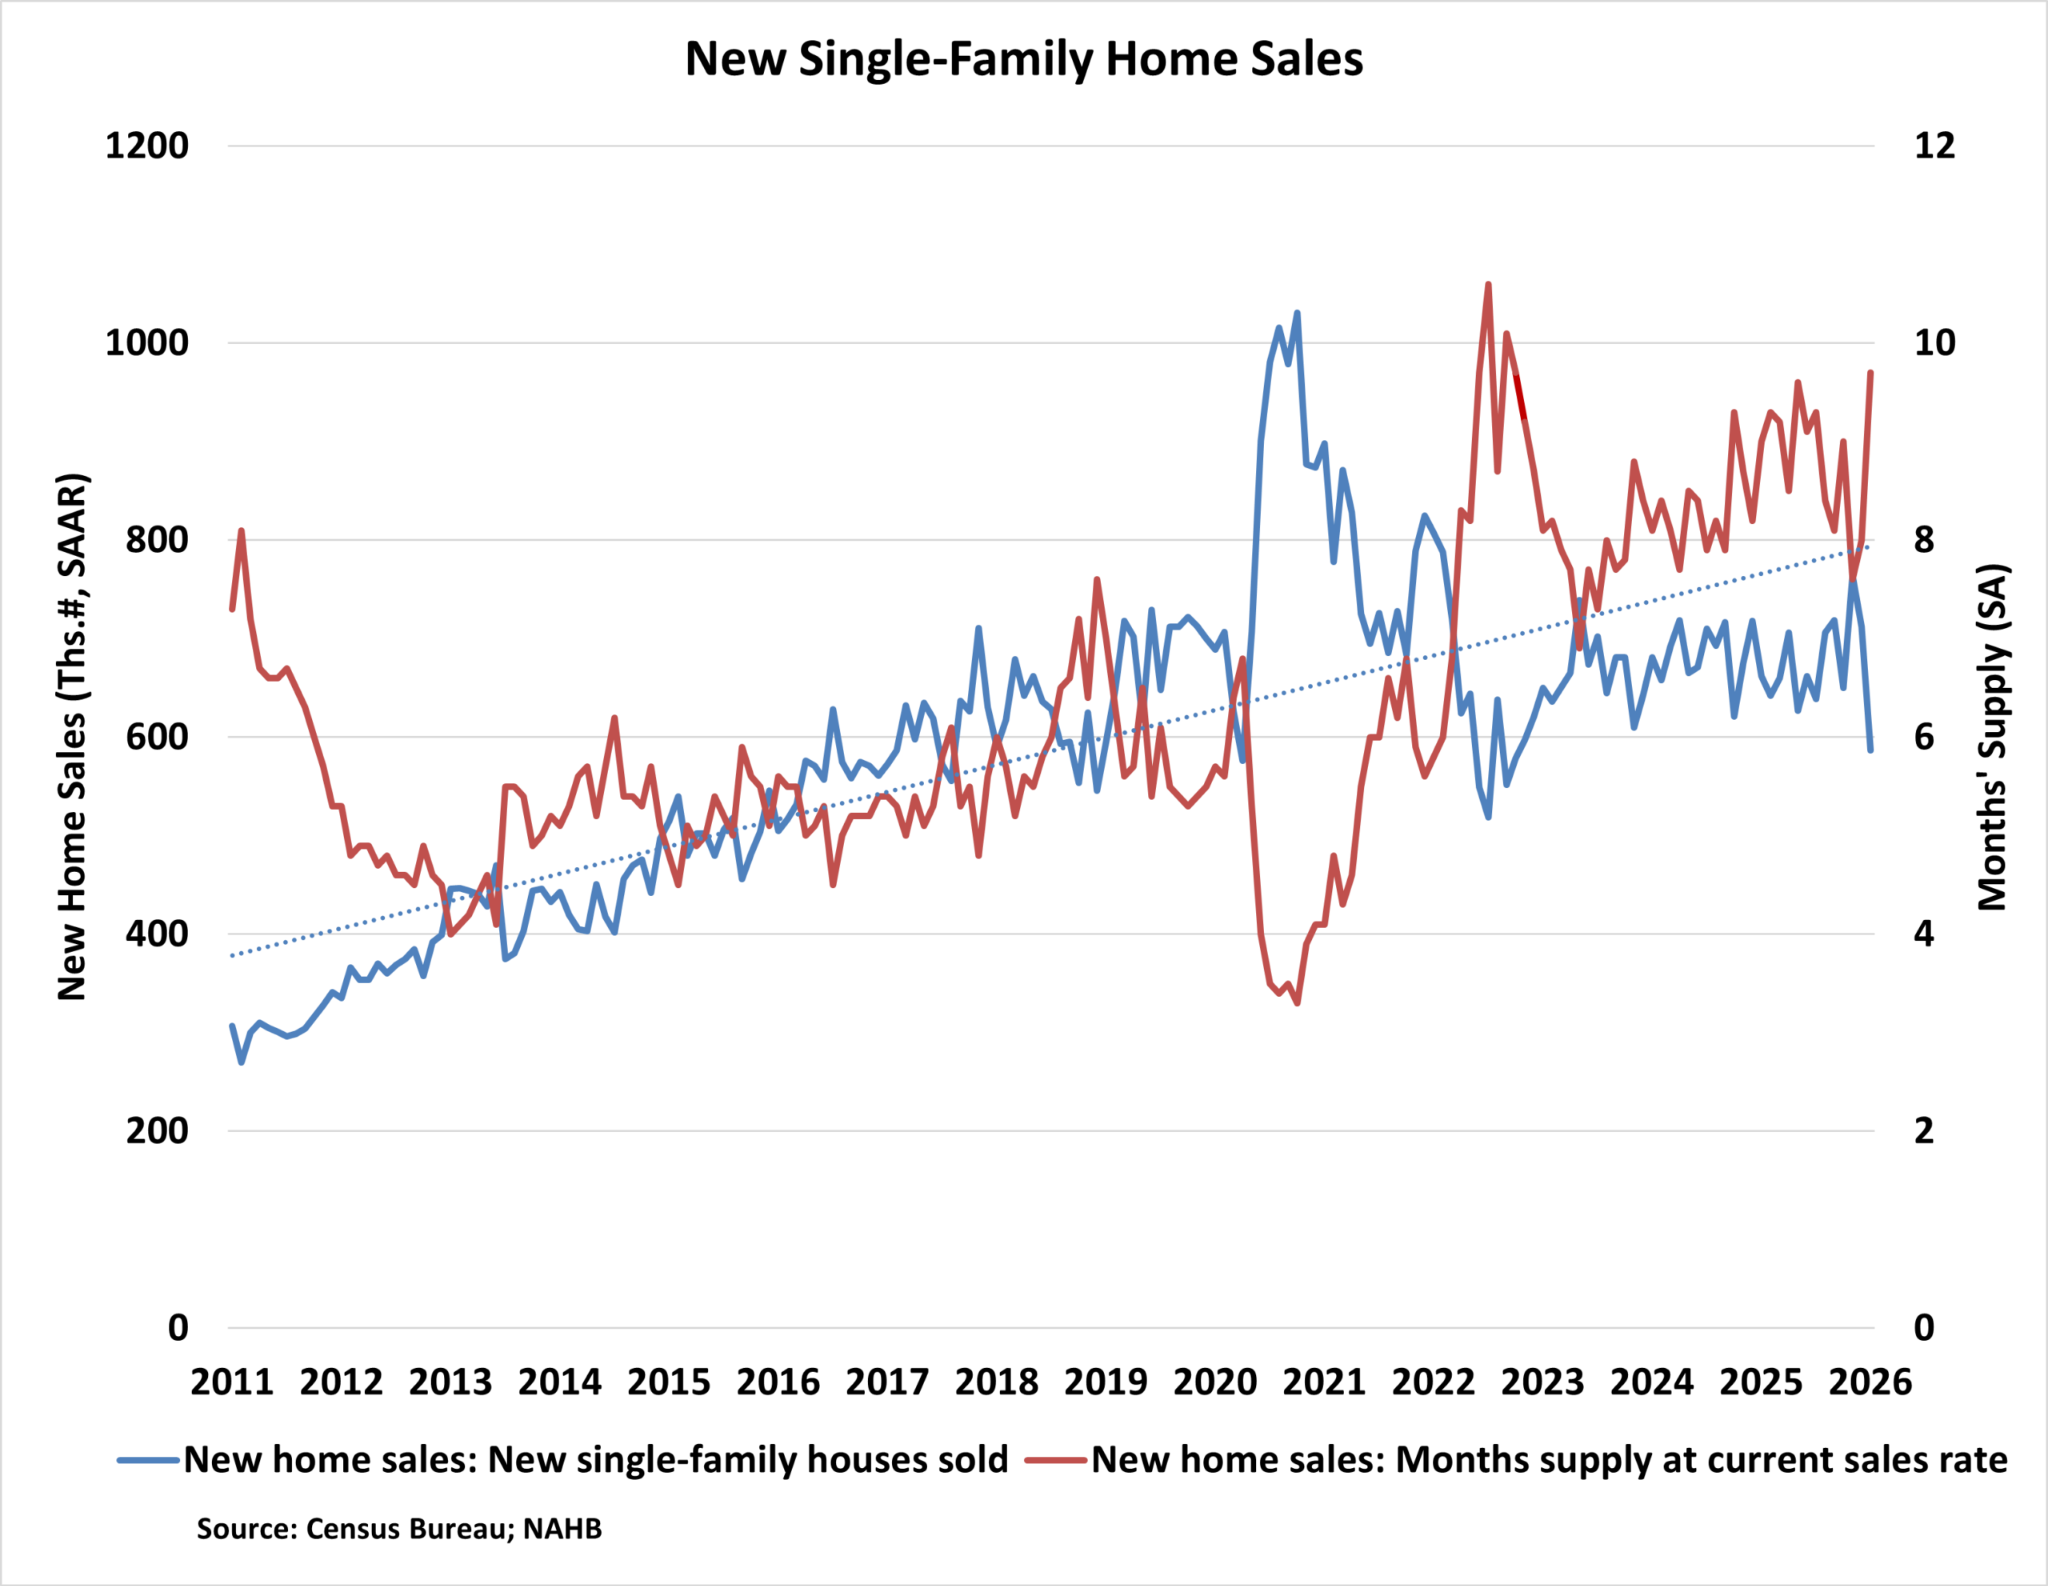
The NAHB/Wells Fargo Housing Market Index fell to 34 in July, the fifteenth straight month below the neutral reading of 40, the longest such stretch since 2012, back when the country was still digging out from the last housing bust. Thirty-seven percent of builders cut prices in July, and 63% are now offering some form of buyer incentive, the sixteenth consecutive month that figure has topped 60%. Rate buydowns, closing cost coverage, straight price cuts, whatever it takes to move inventory that isn’t moving on its own.
New home sales tell the same story from a different angle.
June’s pace of 628,000 annualized units was down 5.6% from a year earlier, even as the median new home price fell to $398,300, its lowest reading since July of last year. Builders are cutting prices and volume is still shrinking year-over-year, which tells you the discounting is chasing demand downward, not creating it. Zillow’s own economist pointed to weak household formation as the real culprit: more young adults staying put, doubling up, sharing housing rather than striking out on their own.
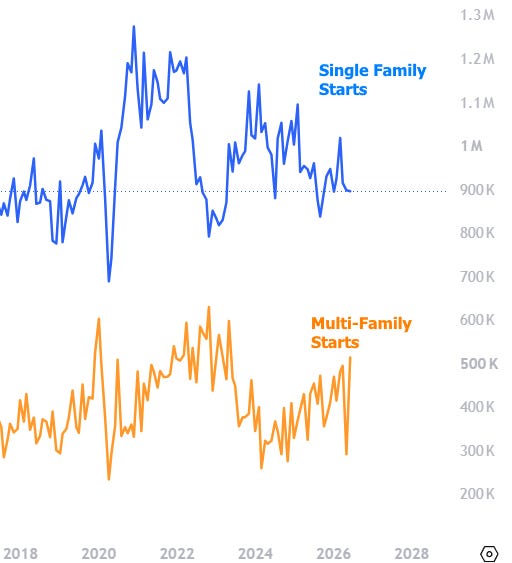
Single-family housing starts fell 3.2% year-over-year in June even as permits, the forward-looking indicator, dropped 2.4% month-over-month, builders pulling back on breaking ground on anything new, exactly the kind of decision that shows up as a fresh shortage two or three years from now, once everyone’s forgotten this correction happened.
Total housing starts still jumped 19% in June, but almost the entire move came from apartment buildings, not single-family homes, developers building rentals for a generation that can’t clear the FHA bar or won’t touch a 6.7% rate.
None of these threads exist in isolation, and none get fixed by whatever the Fed does with rates this fall. Kevin Warsh’s committee held rates again in July, as I covered in The Family Fight, and nothing about an eventual cut solves an insurance market that’s structurally repricing for a warmer, stormier climate, or a mortgage bifurcation where FHA borrowers are already defaulting at four times the conventional rate before rates even move.
A rate cut would loosen the golden handcuffs just enough to let some equity-rich sellers finally list. It would do almost nothing for the household already 90 days behind on an FHA loan in Odessa, Texas.
That’s the part most easing-cycle optimism misses.
Lower rates unlock the top of the equity pyramid first, the sellers who’ve been waiting three years for a rate in the fives before they’ll list, and that inventory unlock would show up fast. It would take far longer to reach the bottom, where FHA underwriting and insurance escrow do the actual gatekeeping, not the rate on the note.
The aggregate stats would improve well before the bifurcation underneath them closed at all.
Comments
Nothing yet. Say the first thing.
Sign in to join the conversation.