
This post is probably gonna get some outraged comments if it ever breaks out of our nerd sphere!
And given it’s about ratios, maybe getting ratioed was foreordained, who knows?
So this is inspired by Cartoons Hate Her’s recent post about waist ratios, and more importantly, Eurydice restacking it surprised that only 5% of 20-24 women qualify for a <=.74 ratio.
A <=.74 ratio, as CHH points out, was the standard of hotness for a long time, and featured such luminaries from our past as Marilyn Monroe, J-Lo, Halle Berry, and more.
I proposed in Eurydice’s comments that it’s because you need a waistline to have a WHR, and lo ~80% of American women are fat and do not have a waistline, therefore it’s natural to think that not very many women would qualify.
And I posted the distribution of NHANES waist circumference data I had laying around for women and men to show the lack of waistline with actual data:
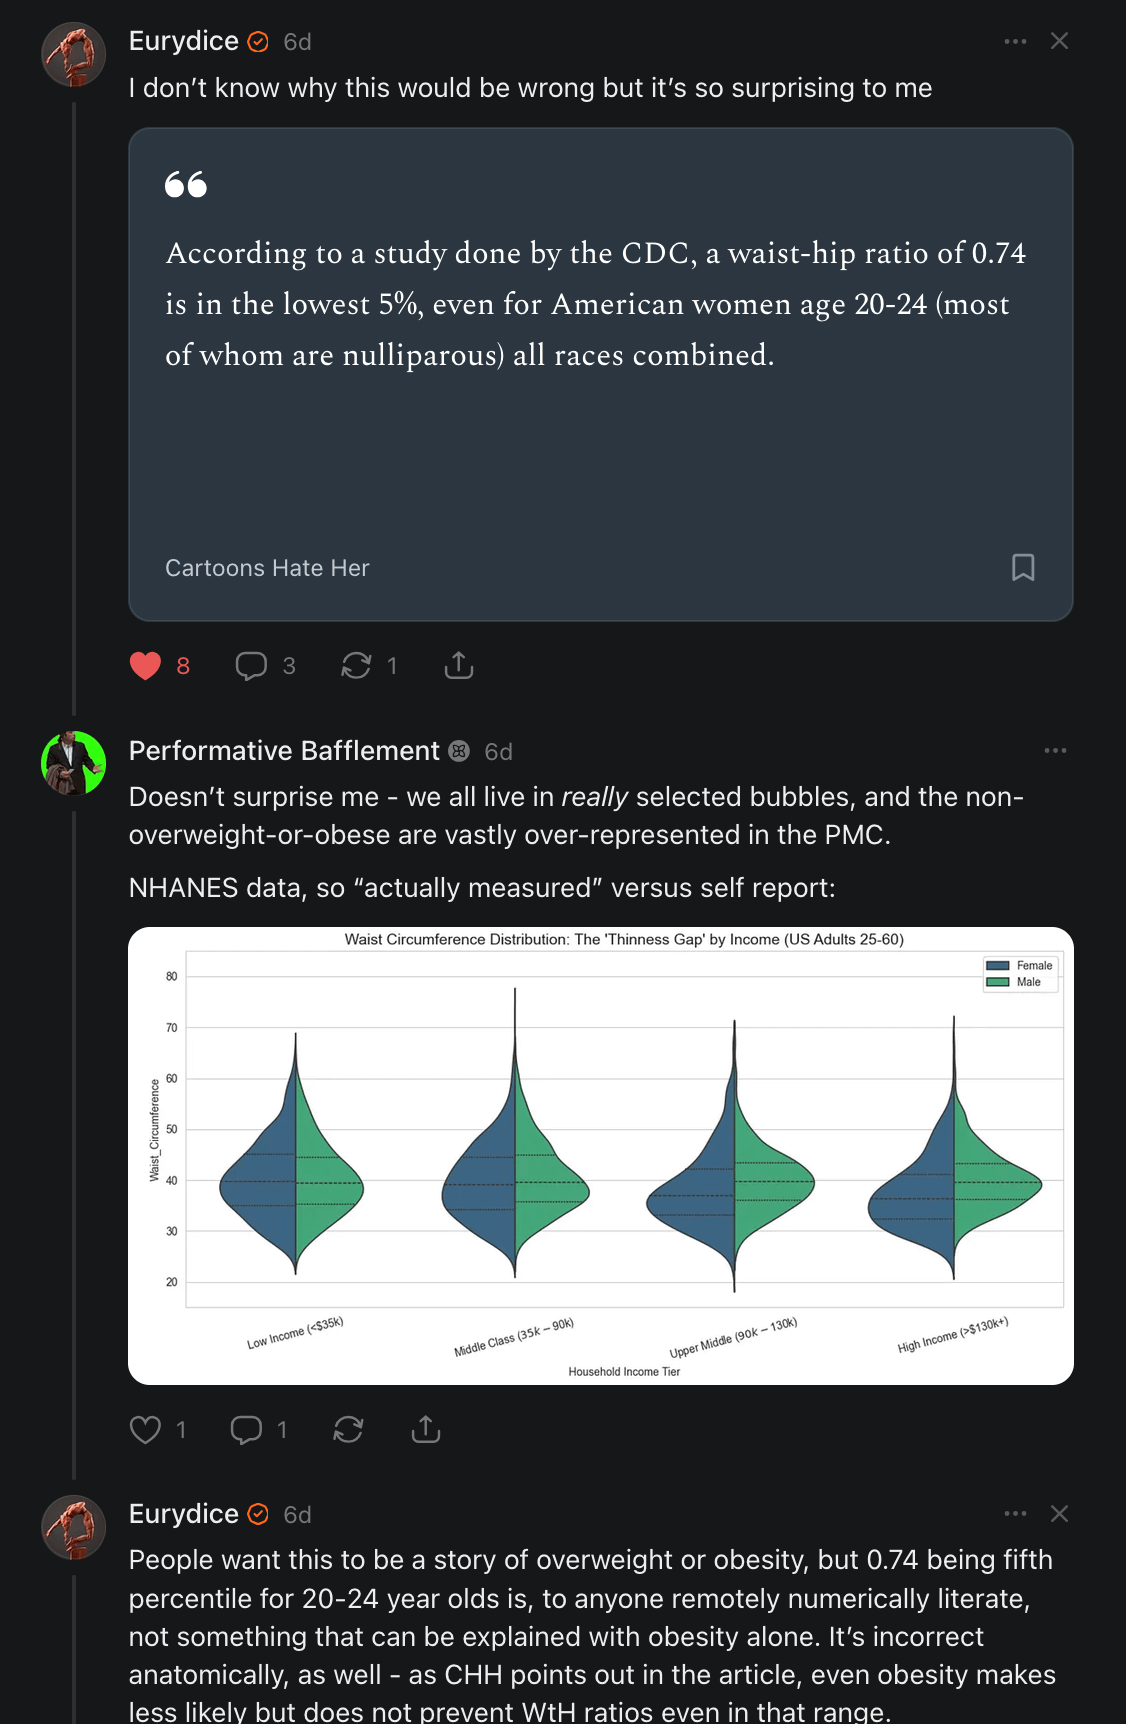
So to summarize her reply, basically that’s stupid, waist circumference or BMI has very little to do with good WH ratios, fat women can OBVIOUSLY be <.74 queens, and I was clearly innumerate. To which, lol.
Oh, you done did it now - what happens when you call a physics-then-math grad who led data science teams for a decade innumerate?
Let’s mathematically prove that waist circumference / fatness is what matters, and along the way, let's show that “hot at any size” is fake and that the BMI caste chart is real.
Rather than opinions and heated hand gestures, so this shouldn’t be too hard. We have NHANES data with BMI and waist circumference data. Then we have hip circumference data in NHANES microdata at smaller samples, and some population distribution information in FitnessNorms / NCHS data.
This next section is relatively boring math and framing the question stuff, so if you want to skip the math and get to the results, just click here.
So originally, before data and this analysis, I was thinking of this erroneously. I was operating from heuristics based on observation, and had a distribution and incidence in my head that turned out to be right, but my explanation for what was driving that distribution and incidence was wrong. And that wrong explanation was: “a good WHR is driven by having a noticeably narrow waist coupled with noticeably wide hips, and this is in obvious tension.” So you’re trying to make a conjoined draw from the gaussian tail of women with small waists, and the gaussian tail of women with wide hips, and obviously that conjoined draw would be rare.
But lo, if you run the correlations on rho, the pairwise correlation between hip and waist circumference in the data, they have a 90-95% correlation! So this was not the story. It’s basically the same draw, and the problem is you’re trying to stack all the variance in the residual term, which you could naturally think of as the “residual shape,” or how a woman deposits fat and other things. I think Eurydice might have tried to make this point somewhere in our exchange, but she only spent a handful of words on it and it wasn’t quite clear to me if she was making that specific point. But if so, she was right about that!
But also, if they’re 90%+ correlated, that means your only hope is likely to be having a small waist, and I’d be right about my waistline point. So how do we determine this? We need to find some way to look at how much “a good WHR” is driven by waist, and how much by “everything else.”
So what I want to do here is look at the variance in WH ratios, and look at the amount of variance driven by waist circumference, and the amount driven by hip, and then we can do a decomposition into “what percent is explained by waist circumference” and “what percent is explained by everything else,” which I’ll call “residual shape” and that’s basically “everything else” including things like the genetics of how and where a given women adds fat as she gets heavier. Basically, how much does “being skinny” explain qualifying at <=.74, and how much does “everything else” explain it.
Our first hurdle is that nobody publishes WHR percentiles for the US. So this is something we’ll have to estimate the distributions for using our respective data sources, or calculate for ourselves.
I can’t do latex or markdown in Substack apparently, so I’ll just take a screenshot from my jupyter notebook:
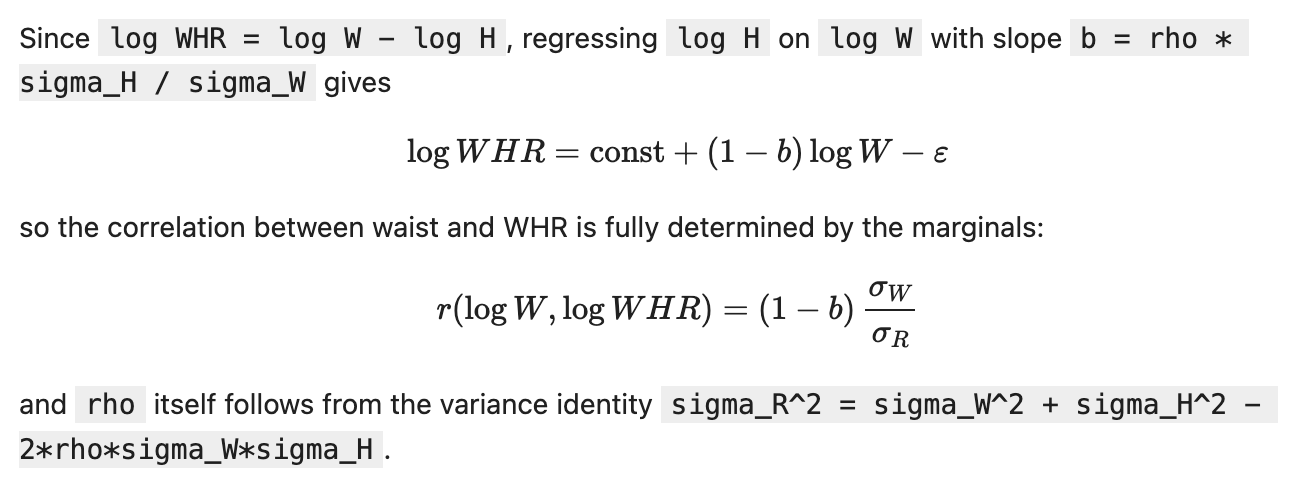
This was an equation with two unknowns, sigma_H and the slope b. But we can get sigma_H by either the FitnessNorms / NCHS data, or calculate it from actuals in the microdata sample we have of about 300 women with both hip and waist data. I do it both ways.
Actually I do it 3 ways, the first time estimating a lognormal fit with IQR’s, which turns out to be an over-estimation because both tails end up really mattering, but it’s still a decent first pass triangulation method.
So:
I estimate the variance in hip distribution from FitnessNorm / NCHS data and do this math
I estimate the variance in hip distribution from NHANES actuals, and map it back to the full NHANES data set to get an 8k sample
I calculate all the numbers directly from the ~300 women we have both hip and waist data for in the microdata
And I’m doing all this to tease out and estimate how much waist matters and how much “residual shape / genetics / everything else” matters.
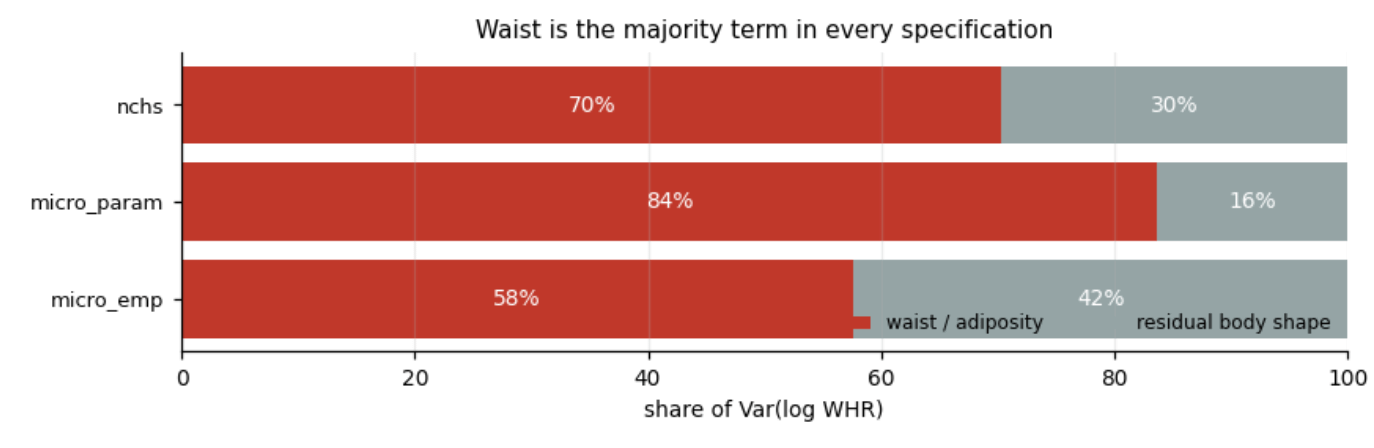
Just waist circumference generally explains 60-85% of having a good WH ratio! It is the most important term! Broadly it looks generally 70/30 - in other words, waist circumference explains ~70%, and “everything else” explains ~30%.
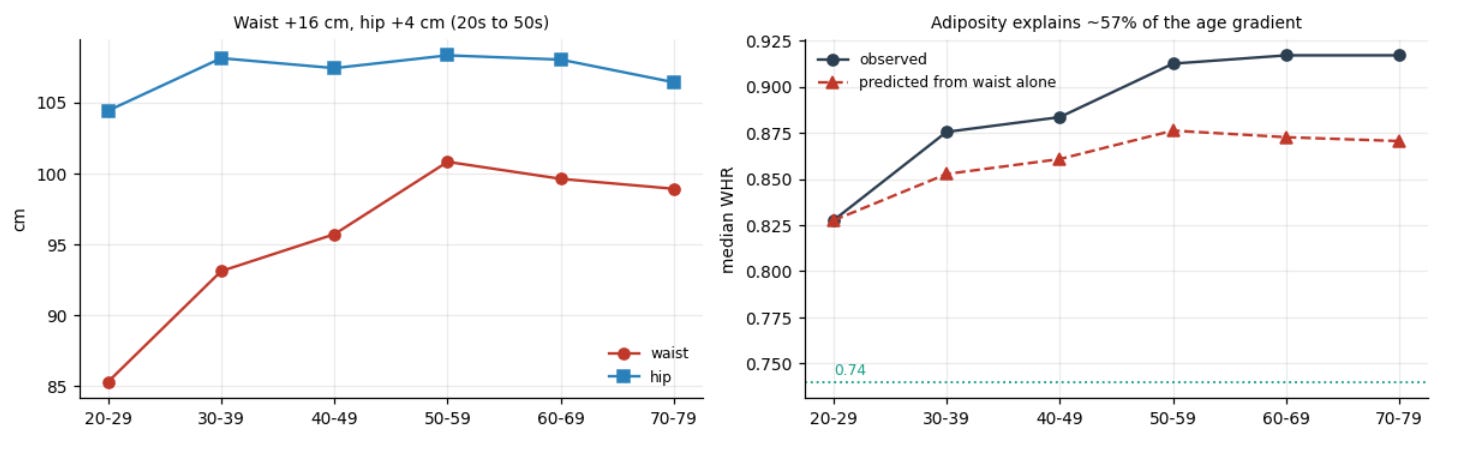
Another fun point that surfaced while exploring the data, average hip circumferences are basically the same for 20-24yo and the broader population of women. I guess hips are driven more by skeletal structure than adiposity patterns overall!
But what this means is that the general pattern is “women start off with the best WHR they’ll ever have, and then obliterate their ratio as they age and their waist gets fatter,” which definitely jibes with what we see in the world:
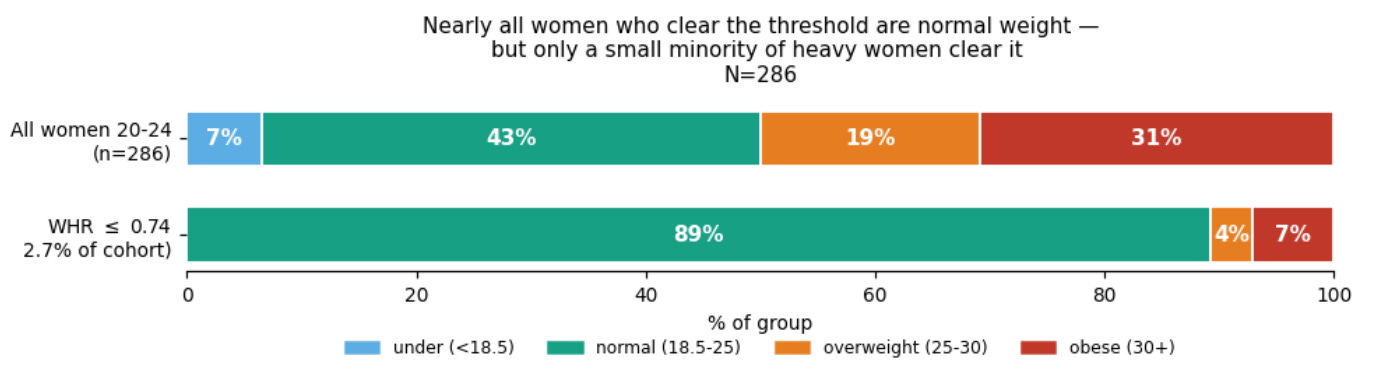
But the fun doesn’t stop here. Let’s look at who qualifies for a good WHR in the “has both” data, and see how they stack up, fatness-wise, by category:
Got-DAMN!
Okay, so in this particular microdata sample of 20-24yo women, it’s basically 50/50 “underweight or normal” and “overweight or obese,” although in the broader pop that’s 40/60.
NINETY PERCENT of our qualifiers come from normal weight women! You could literally throw away every single fat woman, half your sample, and only give up 10% of your qualifiers!
In other words, draw two women, one from the normal weight pool, and one from the fat pool; a normal weight woman is NINE TIMES likelier to qualify for a good ratio than a heavy woman.
Not looking good for team “hot at any size.” I’m sure there are beautiful fat women out there with a great WHR, but they are 9 times rarer than normal weight women with the same, at a minimum.
Hilariously, I showed this data to Eurydice and summarized other findings verbally and she says in response:
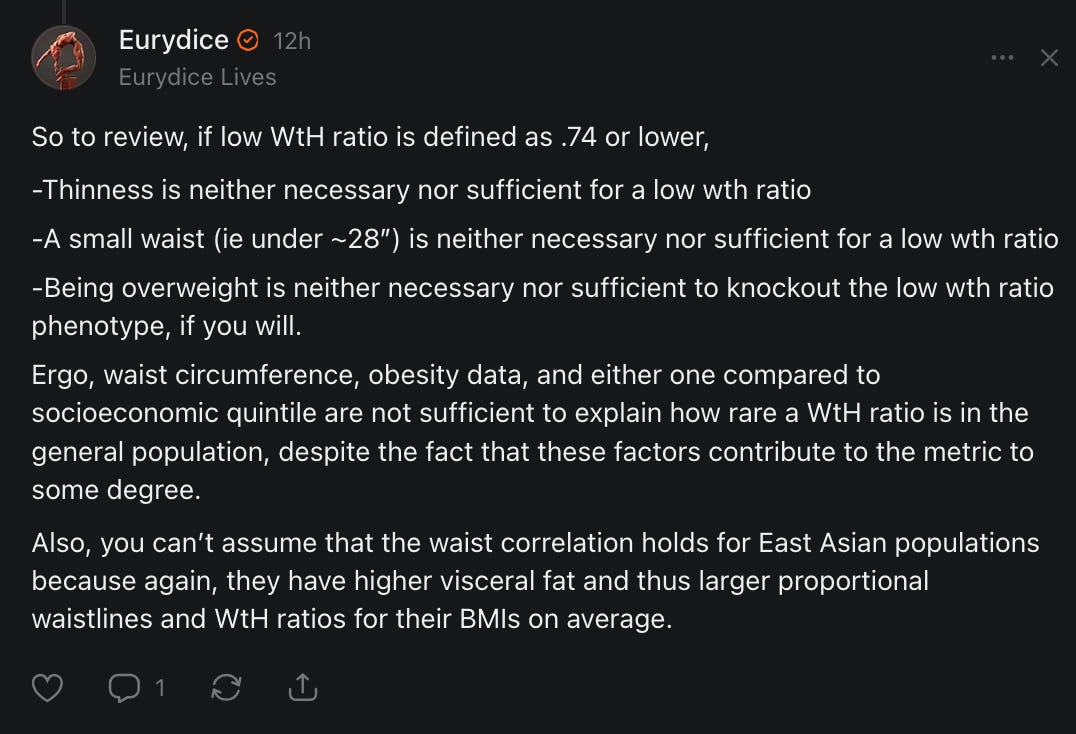
Which is literally the opposite of what I said, what I showed her, and what the data and charts say!
Man, getting called “innumerate” for posting a chart explicitly showing how rare “having a waistline” is, and now this. I’m beginning to suspect an ideological commitment that won’t be moved by facts or figures within my esteemed interlocutor.
But okay, let’s make it even more obvious.
Let’s look at the waist circumferences of the qualifiers:
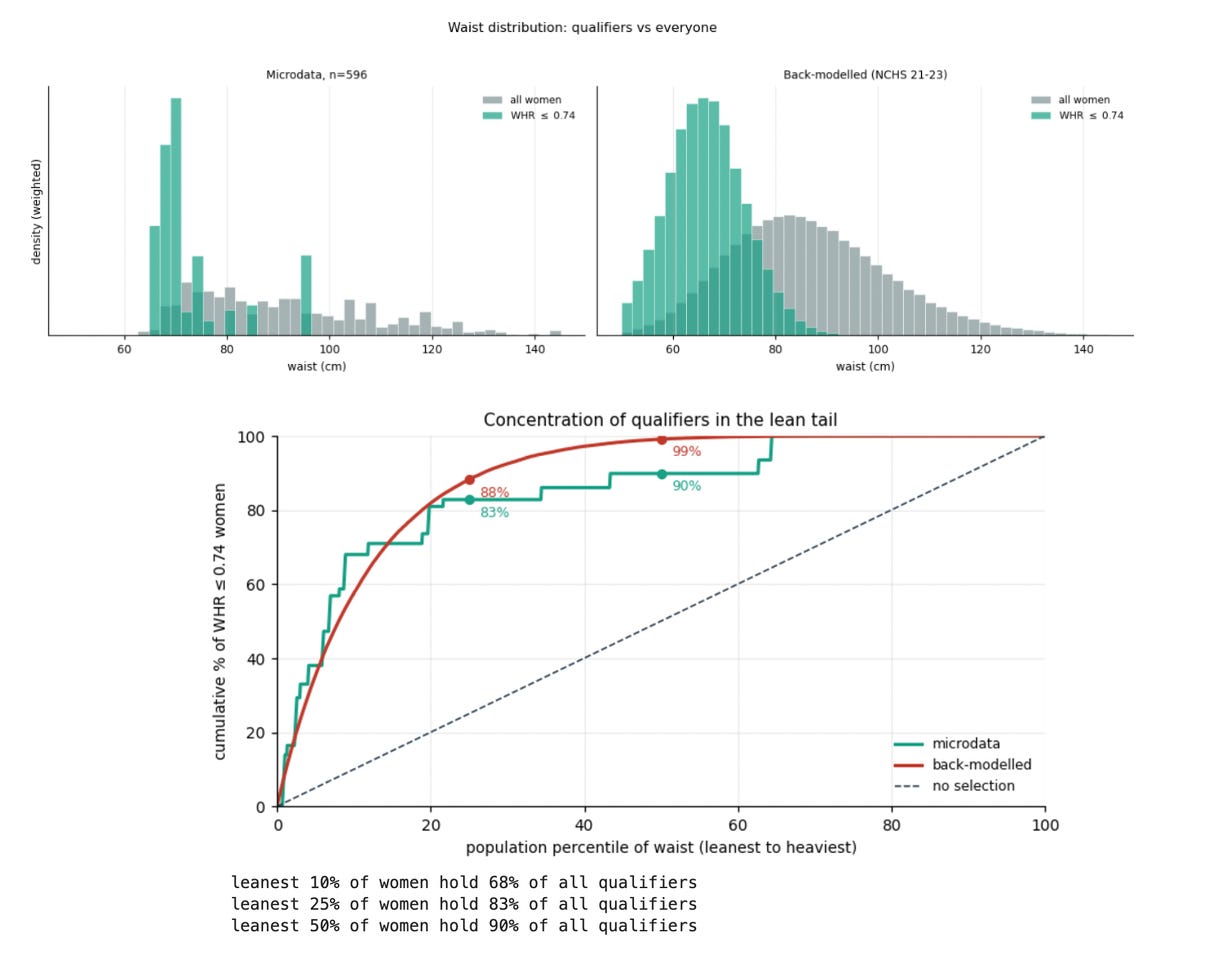
Staggeringly, a full ~85% of qualifiers come from the skinniest 75% of women!
After throwing out all the fat women, you could throw away the fattest 50% of normal weight women, and STILL keep ~85% of your qualifiers!
You could throw out all the fat women and the fattest 80% of normal weight women and still have ~70% of your qualifers!
This is ridiculous. It’s an effect size so huge it’s just hitting you over the head.
Basically if you were trying to max your chances of hotness / a good WHR, if you just started by selecting from only the top decile slimness women, throwing away 90% of your sample right away, including 80% of normal weight women, you will keep ~70% of the hot women / qualifiers!
This is ~5% of women qualifying overall, let me remind you. Throwing away everyone but the top decile slimness women concentrates your qualifiers by nearly 14x.
“Hot at any size” is in a long term coma and hooked to tubes in the hospital at this point.
Let’s directly test Eurydice’s contention that BMI or waist circumference don’t matter much to explaining how rare a good WHR is for a woman / population.
So my position from the very beginning has been “this is because you need a waistline to have a good WHR, and nobody has a waistline, only the top 5% having one makes sense to me. Here, here’s the gaussian of waistlines, see?” Which obviously wasn’t enough.
An AUC is “area under the curve,” ranges from 0-1, and measures how well a classification model distinguishes between different classes, in this case “qualifier vs not.”
If you run the AUC statistics with ONLY waist circumference or only BMI, you get ~70-90% discriminatory power:

Which is to say if you evaluated two women for qualifying and knew nothing else but their waist circumference, you could sort them correctly ~90% of the time.
If you had nothing else about a pair of women but BMI, you could get it right ~70% of the time.
In some domains, you’d want to map this to a Somers d statistic, in which case they’d be d=.37 or d=.72 for BMI and waist circumference respectively. Those are absurdly massive Somers d’s! Any scientist would fervently pray to the gods of almighty atheism / agnosticism / simulationism for a Somers d as good as either of those in their paper!
But Eurydice might justifiably reply here - “you still haven’t spoken to the rarity!” And she’d be right, AUC or Somers d does nothing for us on that front, it’s just something that I wanted to see for myself, to put “just how big / relevant is this” into the terms we typically see in modeling or the literature.
So let’s look at the distribution (again, given I led with it), but this time let’s look at the CDF. I thought it would be obvious that “you need a small waistline to qualify, and lo, those don’t exist in the actual distributions” but it wasn’t and I didn’t communicate clearly. Part of the reason it wasn’t obvious is probably Eurydice’s increasingly apparent ideological commitment that fatness doesn’t impact WHR / beauty at all.
But THIS:
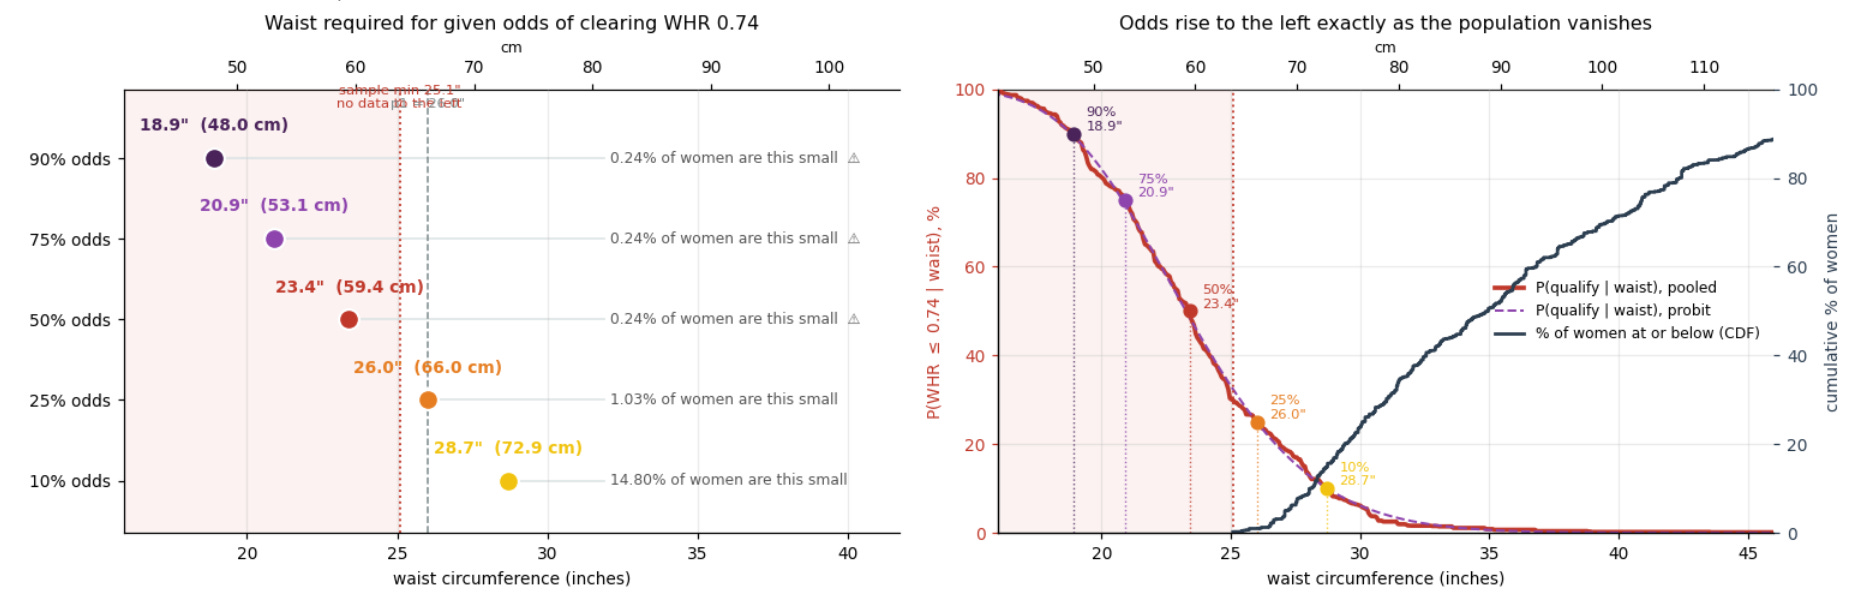
We plainly see that the merely 1-in-a-thousand waists in NHANES peter out well before any meaningful chance of qualifying. You’re at 26 inches to even have a 25% chance of qualifying, and this is only 1% of women. The top percentile slimness women only have a 25% chance!
Let’s see the rarity another way.
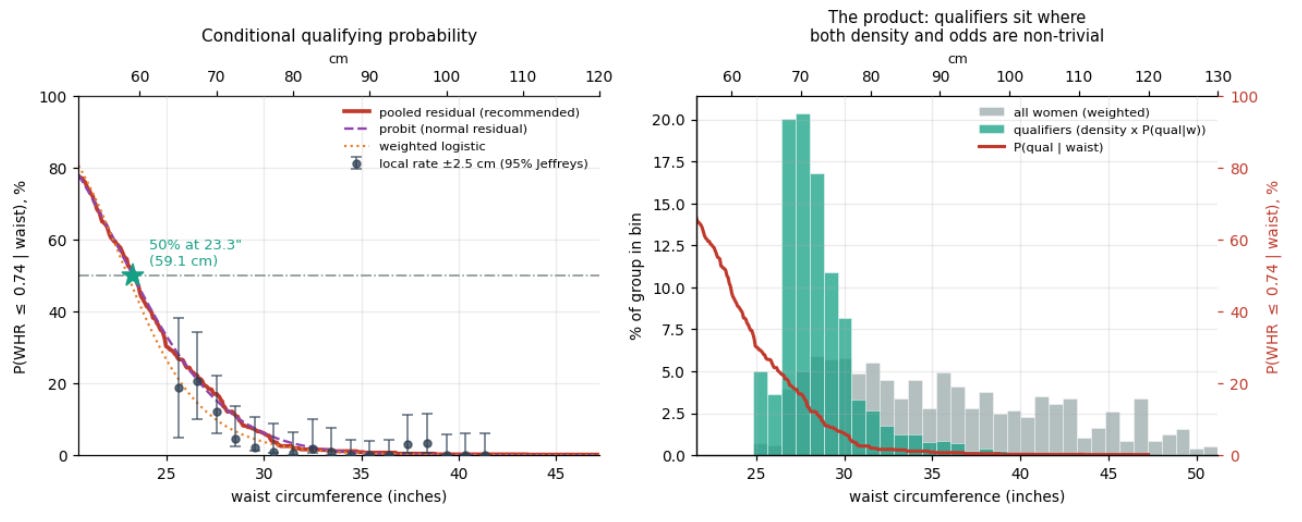
To have a 50% chance of qualifying, you would need to have a 23” waist, which is well more than 1/10k rarity even in our 20-24yo population.
The slimmest waist in all of NHANES is 25”, by the way. If you want a 20” waist woman, you’re going FAR out in the tails, probably 1/100k+.
I will say that being surprised that only 5% of women qualify when literal top percentile slimness women only have a ~25% chance is pretty clearly the graver epistemic error here, and that my priors, and initial instinct that it’s driven by nobody having a waistline, was basically correct.
With a d=.72 floor, a <1%-er only having a 25% chance, and a categorical incidence that lets the heuristic “throw away all but the 10% skinniest women” concentrate your winners by 14x, I will say that “waist circumference has 70%-90% of the predictive power” is a solid heuristic here.
At the individual woman level, or within a population, waist circumference absolutely dominates good WHR, directly discriminates 70%-90% of who qualifies, and you can vastly increase your odds of a qualifier by throwing away as many non-top-decile-or-percentile waist women as you can.
In the US population, if we could increase the number of women with <=28in waists, you would unambiguously max your number of qualifiers. If we could shift the weight distribution down in the US by 1SD, to match where we were in the 70’s, it would literally 4x the number of qualifiers.
Obviously we need GLP-1’s, at scale, for free. Make America Hot Again!
What about at the “across population” level? This comes from me pointing out that asian women are way skinnier on average, so we’d expect more qualifiers there. Indeed, I modeled it using the distributions I had and some East Asian data from the literature and saw that East Asians, at ~1SD lower on waist circumference (if we’re being generous to the American women) would have between 3x and 7x the incidence of good WHR, depending on the method.
And she pushed back, saying that we can’t say that because residual shape, or adiposity patterns / everything else, varies too across populations, and asians have worse adiposity patterns, and pasted a snippet about asian fat deposition. This is fair, and it’s a good objection.
So let’s see what the data says, we can proxy this with race differences in the US, which are a good representation for “how much do different populations diverge on this attribute.”

“b,” the unknown parameter we were solving for, is actually quite stable! What was “b” again? It was the slope of the line dictating how much “waist circumference” explained for qualifying versus “everything else.” A change in this slope across populations would mean that there IS a material difference in how much “everything else” matters in terms of qualifying. Similarly, sigma_log(h) is basically the log variance in hip distributions across races.
But in the data, white and black, the two race / populations with the biggest sample sizes and which we’d expect to have the most variance, have essentially the same slope “b” and the same sigma_log(h).
Asians and “Other Hispanic,” with lower samples, wreck our stability, and persuade us that okay, maybe the slope really can materially change in different populations, although some of this will be due to sample size / noise.
If you do some cuts of the data, there really is an “adiposity penalty” for Asians, they don’t put on fat on their hips the same way other races do, and their hips start off notably narrower and with lower variance, and this will affect cross-population comparisons. It’s much harder for an asian to get broad enough hips to qualify with these starting points.
For instance, a white or black woman with the same waistline would have a 1.5x greater chance of qualifying. So that’s definitely a point to Eurydice, “everything else” can definitely matter in different populations! Fat deposition patterns and shapeliness really do differ across races and populations!
BUT if that waistline incidence is ~10x less likely to happen in those women than in asians, that doesn’t actually help you much in real life!
And indeed, that’s basically how it shakes out. Waist circumference is still a strong enough driver that there will be many more WHR qualifiers in an Asian country by rate, including in the US itself:
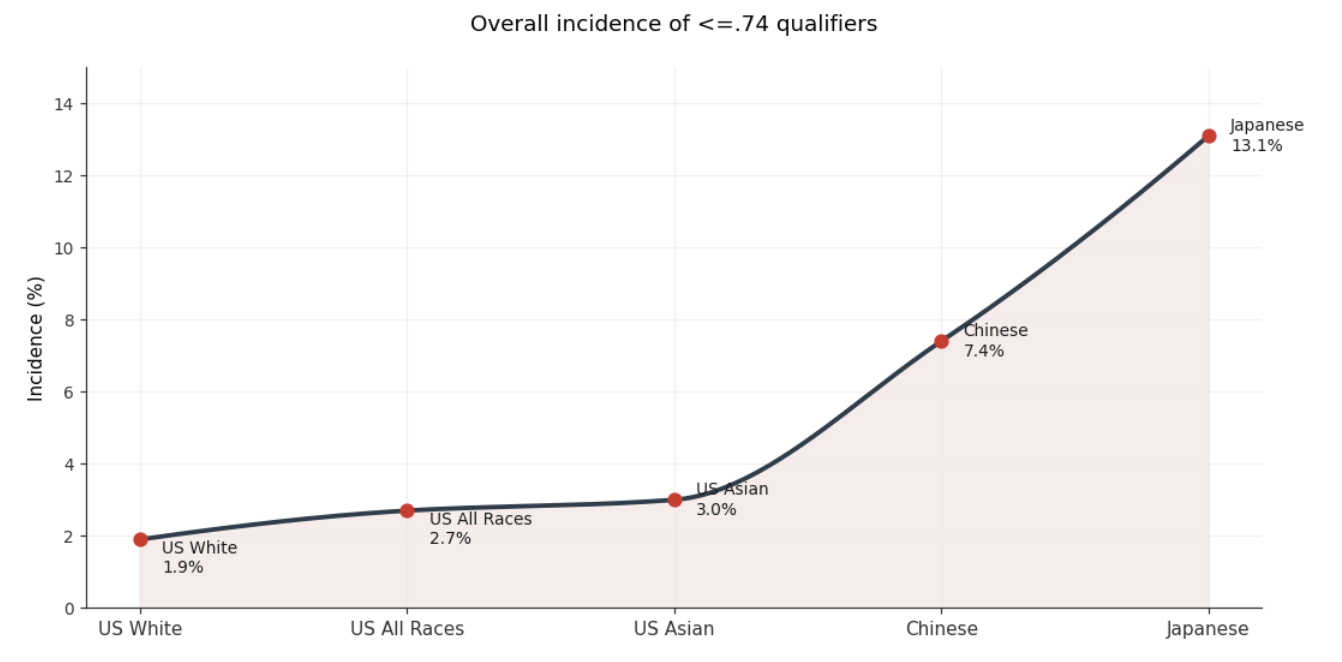
And we still arrive back at my initially modeled 3-7x figures, by a different and more nuanced route.
Even in the same obesogenic environment AND with a “residual shape” penalty from coming with much narrower hips that don’t vary as much and different adiposity patterns, a given asian woman will be 1.5x more likely to qualify than a white woman, and if you go to countries that don’t have 80% overweight-or-obese rates, your incidences go up 3.5x - 7x the rates of white women.
So to be clear, asians overcame a 1.5x headwind versus white women at the same waist, and still came out 1.5x ahead, simply by having more narrow waists in the asian population.
So if we take the clustering of “b” across different race / populations and the fact that even a narrow hip population that doesn’t vary nearly as much still has 1.5x - 7x the qualifiers, my initial heuristic of “just filter by waistline” proves true basically everywhere. Both within a population, and across populations.
My “there will be more in Asia” heuristic also held out, which given I’ve done business there for a decade plus and live there a good chunk of the time, is more a testament to “using the Mark 1 eyeball” than having done all this math, but now we’ve also mathematically shown it!
Back to that “waists grow into obliterating the ratio” point, you know which race alone among all races doesn’t do that as much?
If we look at US BMI trajectories by age, there’s quite a difference.
“Other” means “Asian:”
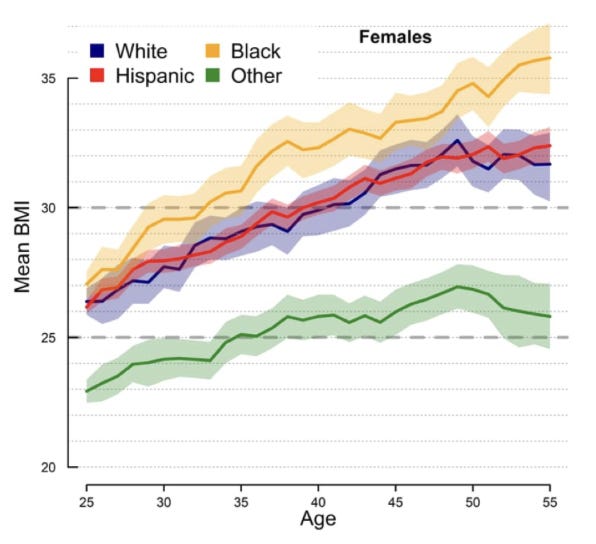
We once again find “always marry an asian” to be a solid heuristic.
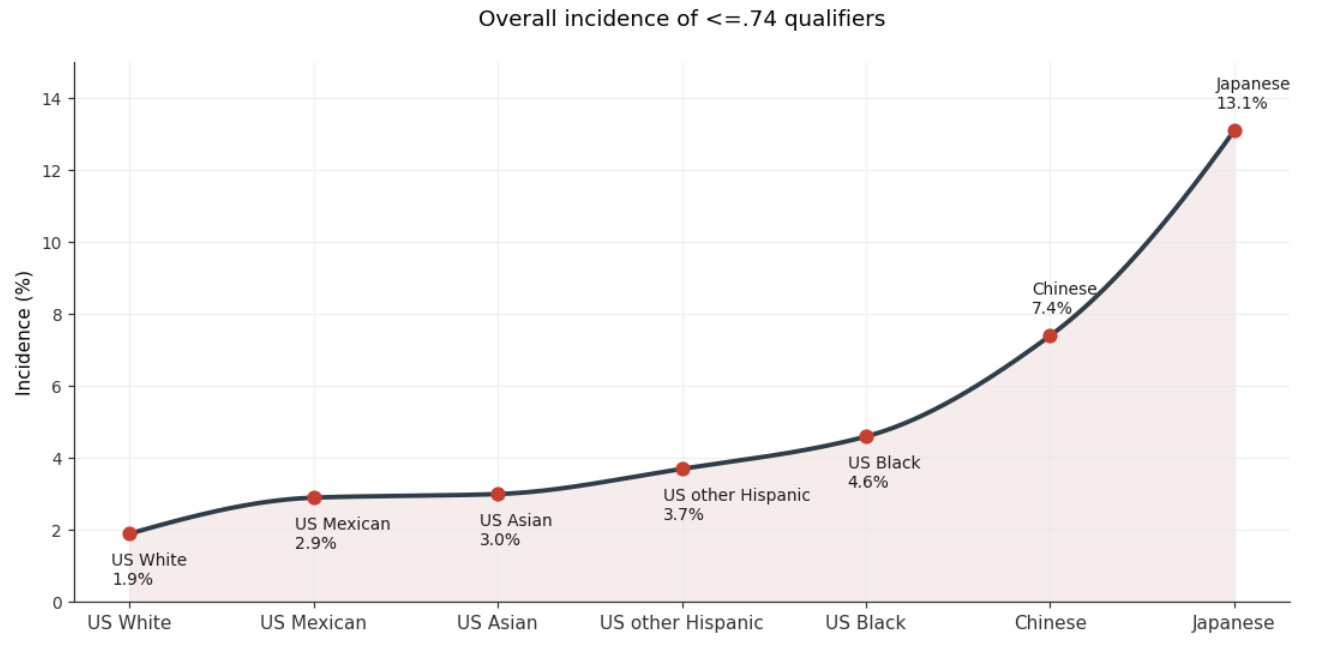
Basically, choose any race BUT white women, and you’ll be doing better. With the high black incidence, this probably implies that if you went to non-obesogenic countries with primarily black populations, the overall incidence would be even higher than the East Asian countries! So that’s fun.
But per the “BMI trajectories by age” chart above, every other ethnicity is also going to obliterate their ratios faster than an asian, if you’re in the US. If you’re in it for the long haul, an asian is still the much better bet. Always marry an asian if you can, boys.
So I’ve been pretty glibly mixing “hot or hotness” with “qualifying WHR” in descriptors here. Is that justifiable?
Here I will turn to the literature, as it’s abundantly supported. It’s actually worse than the <=.74 threshold, and that’s what CHH’s post was actually about.
Her whole post was about “okay, these women are already <=5% of the population, and people don’t even consider them-in-their-prime hot any more!”
And yes, in the microdata, only ~2.7% of women qualified for this with actual data. Triangulations with the other methods put the 95% CI at ~2-6%, so 5% is directionally fine.
But CHH’s whole point is that in our modern world of Tik Toks and Instas and a long, long tail of young hot women worldwide crowding into the attention sphere, <=.74 doesn’t even ping the meter!
Men only consider <1% or maybe <.001% women actually hot these days!
And yeah, probably. 1/100k is probably a decent centroid estimation for how rare a given Insta model’s or Tik Tok hottie’s phenotype is.
And she’s right that this is what men find attractive, it goes well below “.74:”
“Although there is variability in the features that individual men consider attractive, women with WHRs of .60 to .70 are more consistently rated as highly attractive by men, and women with WHRs higher than .85 are less consistently rated as attractive (e.g., Bleske-Rechek, Kolb, Steffes-Stern, Quigley, & Nelson, 2014; Dixson, Dixson, et al., 2010; Dixson, Dixson, Li, & Anderson, 2007; Furnham, Tan, & McManus, 1997; Henss, 1995, 2000; Singh, 1993a, 1993b, 1994; Singh & Luis, 1995; Sugiyama, 2005; Thornhill & Grammer, 1999)”
Just how rare is a .60 - .70 WHR today?
In our sample of ~300 actually measured 20-24 year olds, the lowest in the entire sample is .70. So even the upper end of the range is already ~1/300 or 0.3%.
We can model this with a general pareto distribution model, and what do we find? Basically we’re trying to extrapolate the arc of the line, starting from where we have data at .74, taking it to where the data runs out at ~.70, and continuing the trend to make our best guess at how much rarer each successive threshold is:
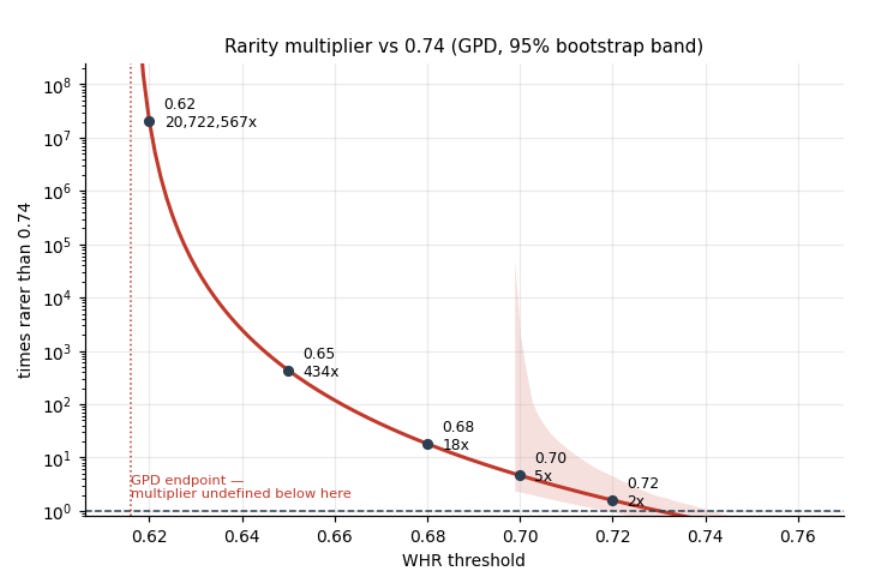
So a .62 WHR woman is roughly 1/1M, .63 is ~1/100k, and .7 is roughly <=1%.
This is the range the literature is telling us men find most attractive! You’ve got to be better than top 1% to even get in there, and around 1/100k to be noticeable!
Does that jibe with our earlier social media phenotype estimation? It does.
Moreover, corroborating all the analysis we just did, if you want to max attractiveness, you want to minimize waist above all!
In the relatively few studies that have considered the possible independent role of waist size, it has been a strong predictor of attractiveness (Brody & Weiss, 2013; Brooks, Shelly, Fan, Zhai, & Chau, 2010; Brooks, Shelly, Jordan, & Dixson, 2015; Crossley et al., 2012; Forestell, Humphrey, & Stewart, 2004; Grundl, Eisenmann-Klein, & Prantl, 2009; Horvath, 1979; Pokrykwa, Cabric, & Krakowiak, 2006; Prantl & Grundl, 2011; Rilling, Kaufman, Smith, Worthman, & Patel, 2008; Rozmus-Wrzesinska & Pawlowski, 2005). In the single prior study that directly compared BMI and waist size as predictors of attractiveness, waist size was the stronger factor (Rilling et al., 2008).
And do we see this in the distribution of who qualifies for these lofty and rarer HWR? We do:
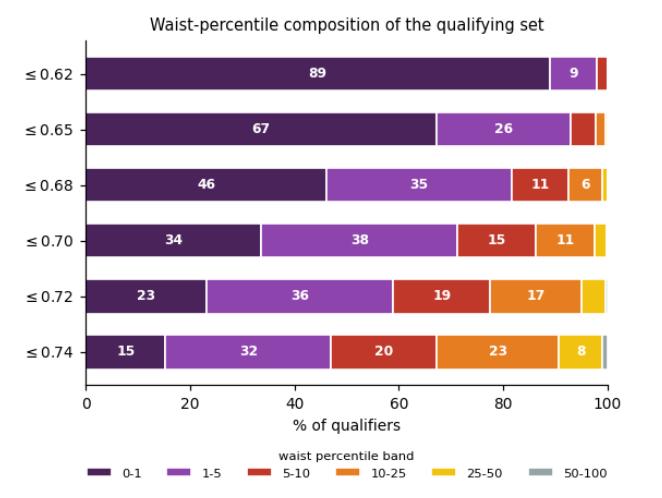
By the time you’re getting to the 1/10k range, you’re 2/3 driven by the top percentile-or-better of waist circumference women. At the floors, you’re 90% driven by this slimmest 1%.
So to even have a chance at being in the band at all that men collectively have rated as the hottest in the literature over decades, your best shot is being, at a minimum, <5% slim, and ideally <1% slim.
Let’s go that extra mile, too. Astute commenter Rick points out I showed men will find lower WHR hotter, but said nothing about finding higher WHR unattractive. Thank you, Rick, that’s a great callout!
Remember this, from the literature? “women with WHRs higher than .85 are less consistently rated as attractive.” Just how common are .85 and higher ratios, how many women are under THIS threshold?
Well, in our 20-24yo women sample, the median was pretty close to .85. Which is to say, this is a tiny slice of the female population, and they are the skinniest they will ever be in their lives, and they are already sitting right there, with half falling into “unattractive” WHR’s.
But what about the whole population?
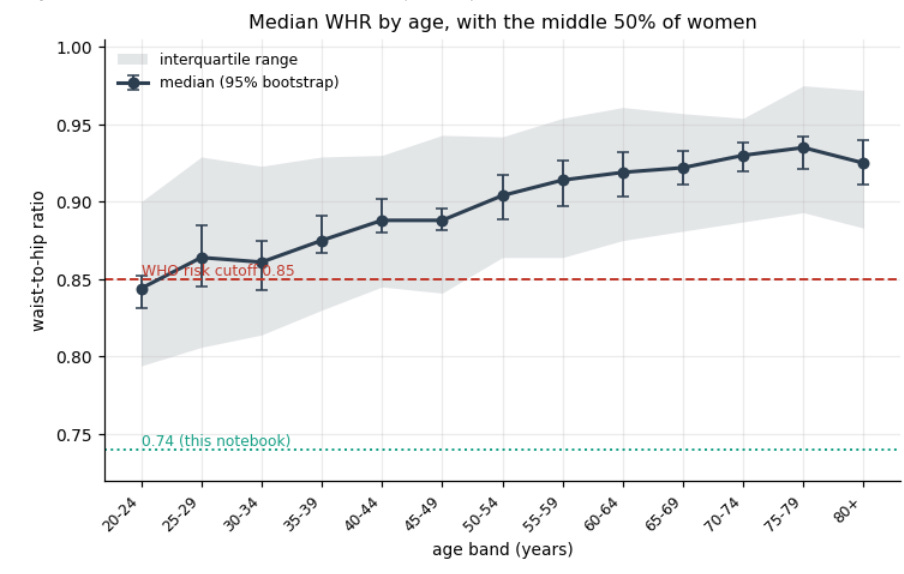
The supermajority of women, at nearly every age, are above the “men find this unattractive” WHR.
The shaded portion is the IQR, or interquartile range, and it shows the 25-75% band, so anyone outside of the lower shaded area is already top 25% or better.
Whew! Harsh! “Hot at any size,” what do you think?
Huh, no response. I hope they’re not ailing.
So basically what’s happened is that every woman in the world has been steadily getting fatter for the last 6-7 decades, AND at the same time, the long tails of young female hotness has crowded into the attention sphere. We’re seeing more 1/100k and 1/1M and 1/10M women nearly every day than any person on earth before us would have seen in a year, or even a lifetime.
Helen of Troy wouldn’t just be mid today, she’d be “lol, as if.”
A top OnlyFans star brings in $1 - $10M a year, and the general pattern for stuff like this is “10% pay and 90% coast on free stuff.” Even at a very loose “$1 a load” proxy, these women are inspiring the release of ~10M - 100M loads per year from their loyal simps, individually.
I’m not quite sure what the load-to-ships conversion rate is, but I’m definitely gonna give this one to the OF girls over Helen. A thousand ships? That’s nothing! Try launching a hundred million orgasms, in a single year, all in tribute to your beauty!
At the same time, the actual population of real women in real life everywhere has been steadily diverging from that tail, with the averages getting ever-fatter and less shapely.
So as CHH bemoans, our standards of hotness have steadily crept up, fed on a steady diet of unattainable long tails, all while the standards of women at large have been steadily drifting away.
Now, even that top 5% is “mid.” Now, you need to be 1/100k to even ping the register!
And I’m sorry to say that the overwhelming majority of men, no matter how rich, hot, high status, or desirable, can generally only get a 1/1k to 1/10k mate, simply due to search costs and other factors, which I wrote about here.
So possibly another contributor to the Vibecession: everyone stares at hot millionaires living amazing lives 7-9 hours a day in their phones, while real life keeps receding ever farther away from those tails and lives every year.
But directly relevant to AI-driven changes looming on the horizon, can we do even better than the 1/10M+ social media girls?
I bring you Gaulin and Lassek (2016), What Makes Jessica Rabbit Sexy?
This study is fun, because it decides to refer to fictional cartoon characters to determine how low the WHR preference goes. Apparently arbitrarily low!
It’s not just .6 - .7 in the literature, which comes from men and women rating pictures of actually human women.
The literally inhuman / unattainable WHR’s of ~.4 - .5 dominate the list of hottest cartoon women!
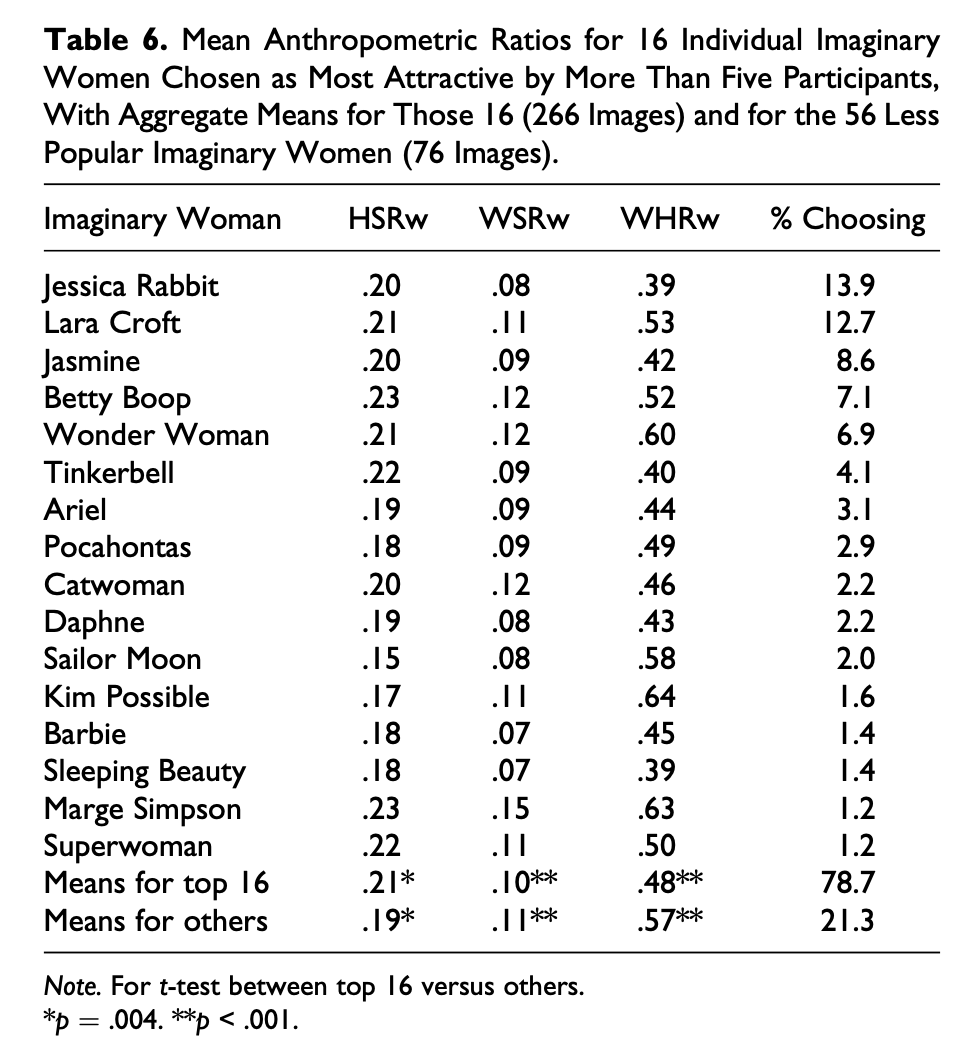
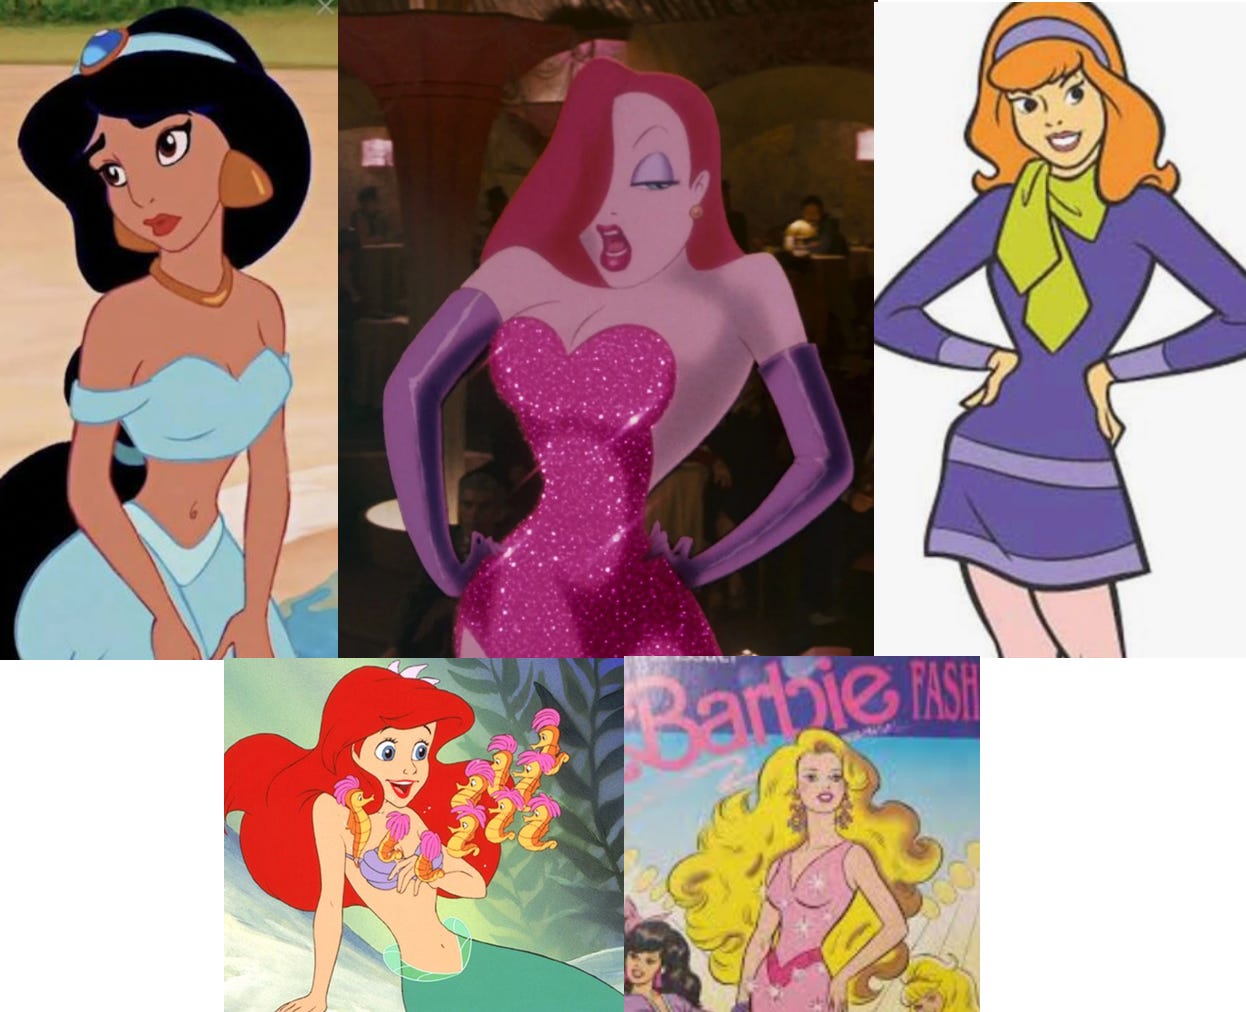
Also, look at the bottom row on that table! Out of the entire sample, only 20% of men chose cartoon women with ratios close to the barely human-attainable ~.6, and 80% of men chose lower ratios, with 42% of all men choosing the top 4 women, ranging from .39 - .53!
If men COULD get lower, they would absolutely take it, they just can’t find that in actual humans, so the hottest humans get rated at the .6 - .7 you can actually find in the world.
Hot at any size?
<deathly stillness and silence, then EKG flatlining sound>
Have you ever heard those studies about how if you artificially make a turkey’s or grouse’s parts extra red or attach extra long tail feathers to birds that use that for sexual selection, the superstimuli always win?

We’re not so different than the birds and the bees, apparently.
We like our WHR’s as low as possible, well below what is human attainable. Even .6 is barely attainable to US women in 2026, and that’s already 1/10M+ or more, and you saw the trajectory of that line! Ain’t nobody attaining a .4, anywhere.
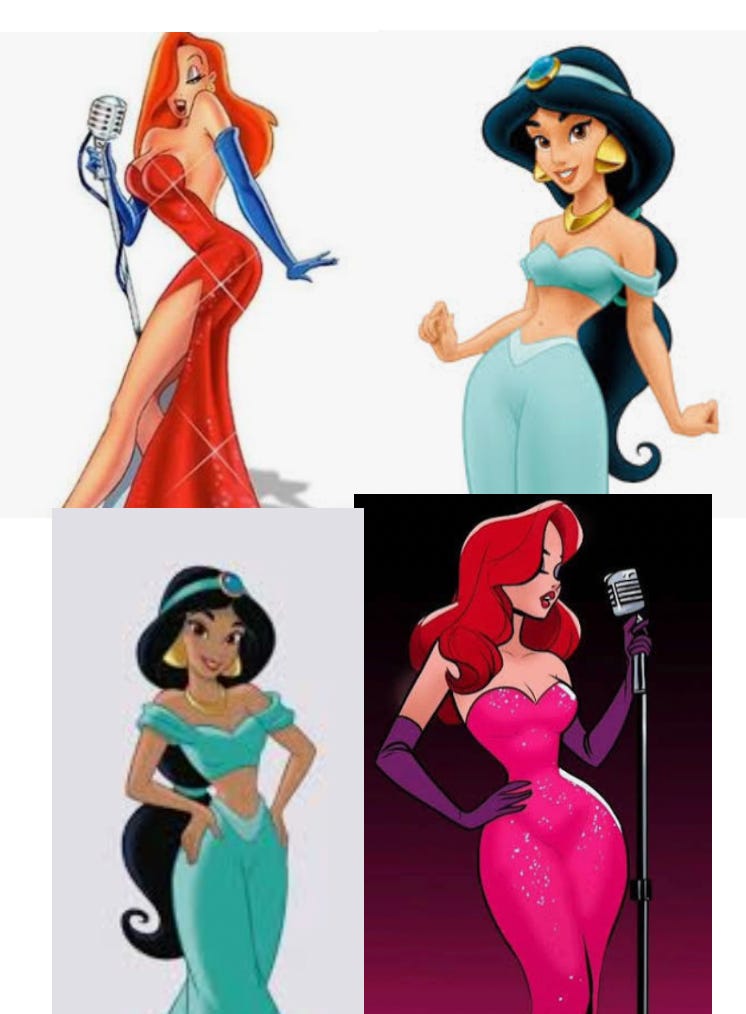
But this is surely attainable in the upcoming infinite jests! Soon AI will be feeding us super-porn and super-tik-tok with literally biologically impossible superhuman women, doing whatever you want, custom tailored to your own individual responses, which I’ve written about before. That’s going to be fun.
Let’s head back to planet earth for a wrap-up.
Okay, so what have we seen? That only a top 5%-or-better woman qualifies for a .74 ratio. That throwing away all women except the top 10% slimmest women is the best rule to follow to find these qualifying women, and increases your chances by 14x.
Not looking too good for team “hot at any size” so far.
But wait, it keeps going!
Then we see that in the literature and in real life, even this isn’t enough! The majority of men find WHR of .6 - .7 the hottest in the literature, notably lower than the .74 threshold, with only <1% of women qualifying at the upper end of that range, and the lower ranges well past 1/1M incidence.
And we see this corroborated in real life, in Tik Tok and Insta and other places, where 1/100k or rarer phenotypes dominate.
We also find that finding a lower WHR attractive goes down even into depths unattainable by actual humans! Only 20% of men chose cartoon women with ratios close to the barely human attainable ~.6, and 80% of men chose lower ratios, with the top women ranging from .4 - .5!
This is a very clear indication that in the aggregate preferences and sensibilities of men, they have been wired to find “lower WHR” essentially always hotter.
And then we see in the data, that only vanishingly smaller slices of the overall population of women qualify for these lower WHR thresholds, and that those same women get ever slimmer and rarer, with only the slimmest <1% having a real chance of hitting even the human attainable .62 - .68.
We see in the data that very close to the majority of 20-24yo women are above the “unattractive” WHR threshold, and that generally the supermajority of women are above it.
“Hot at any size?” Being lowered into the ground.
The BMI caste chart is real. From the deep internal wiring of men’s attractions we see a drive for ever lower WHR, and from the data and from social media, we see that only ever-skinnier women can hope to ping that meter.
What do a lot of women want? An educated, high earning, high prestige husband! There’s only so many of those to go around, so this really matters, and is a zero sum competition.
Will achieving a good WHR facilitate this? And how!
For each step of male SES, their marriage rate goes up, topping out at 90%, and the slimness of their wives, as measured by BMI, also increases.
Indeed, the BMI results keeps going to the very tippy top, as women get progressively skinnier the higher income or richer their husbands are, and the effect is still seen right up to the top 1%, with incomes >$500k and wealth averaging $3M+ in wealth, after which the data thins out enough you can’t really say anything past that:
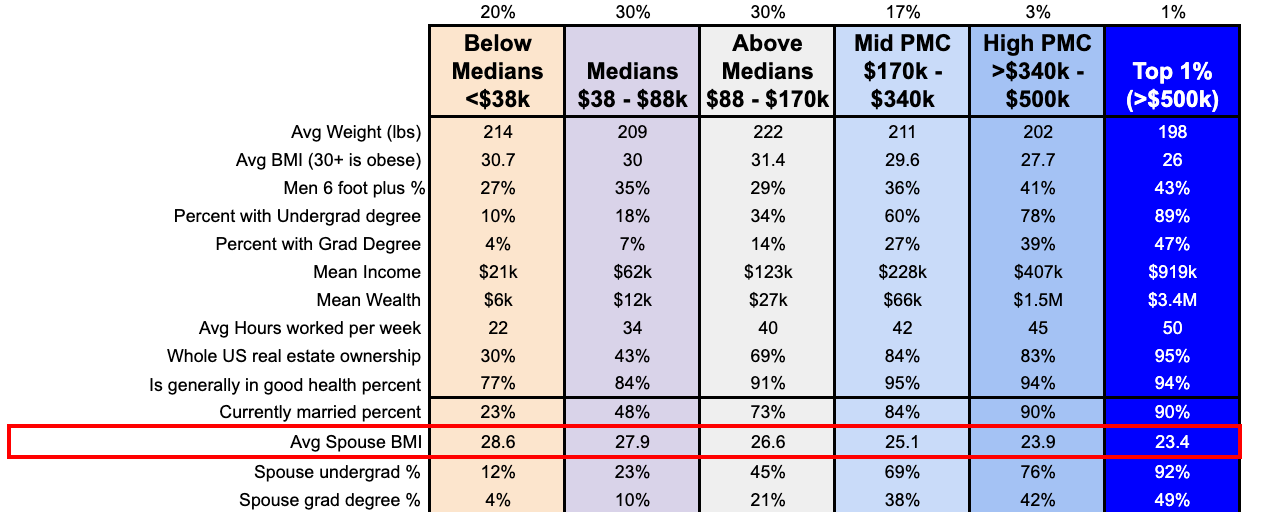
At population averages with the sample sizes I have there, that is a gigantic, and stastically significant, effect.
If you want a high earning, college-educated husband, being slim helps a lot.
On the evergreen topic of “landing a high income or wealth husband” I’ve got more graphs, analysis, and data-driven advice on this front coming up soon in a future post.
If you could choose only a single variable to predict “qualifies for a good WHR,” either in individual women, in a population, or across populations, waist circumference is the single best variable you could choose by far.
If you wanted to follow a simple rule to maximize your chances of finding a qualifier, “throw out every woman who doesn’t have a top decile slim waist circumference” is the single biggest thing you could do, and would 14x your chances of finding one.
That the literature and social media shows us that men are wired with WHR preferences such that they nearly always consider a lower one more attractive, and that this remains true going well below “human attainable” levels.
That male preferences and social media are dominated by 1/100k and 1/1M and 1/10M+ rarity women.
That the majority of women at every age, and often the supermajority, are now above the “unattractive” waist hip ratio range.
That based on the above points, “hot at any size” will only be true for an ever-dwindling rounding error amount of women, that the BMI caste chart is clearly real, and that it being real matters to important zero sum contests and life outcomes.
Well, I feel like that’s enough to lay this one to bed. I doubt I’ll change Eurydice’s mind, but you, my always perceptive and astute readers, now have a much better idea of the importance of slimness to attractiveness, how rare that is, and how deep those drives go.
No posts
Comments
Nothing yet. Say the first thing.
Sign in to join the conversation.