
Thanks for reading Paulsen Perspectives! This post is public so feel free to share it.
Payroll Fridays, when the first significant economic data for the new month is reported – the jobs numbers – often proves dramatic. With shockingly different numbers than anticipated and substantial revisions from previous months, suddenly at 7:30 am CDT, conventional financial wisdom can be turned on its head! In reality, as seasoned investors come to appreciate, any “single” payroll Friday should be taken with a grain of salt since there’s a good chance that next month, more “shocking revisions” will be forthcoming.
The consensus expectation for July nonfarm payrolls was an increase of 80k, but payrolls actually “declined” for the month by 23k and shockingly the previous two-months payroll gains were revised lower by 103k. Although the unemployment rate declined, it only did so because of yet another concerning decline in people leaving the labor force. Overall, what most had perceived as a growing vitality within the U.S. jobs market so far this year, suddenly appears far less robust. It could be that July’s job numbers will prove to be just a one-off which will be revised away in the coming months.
Nonetheless, emotionally driven unanticipated payroll Fridays do sometimes mark lasting economic and financial market sentiment shifts. Looking beyond last Friday’s jobs report, U.S. economic activity – at least across the consumer sector -- has been losing momentum again in recent months. Overall, Friday’s payroll “shock” could, with other supporting reports, suggest that the collective financial market mindset may – for the first time since the pandemic inflationary burst -- be shifting from primarily focused on fighting inflation to becoming more concerned about supporting real economic growth.
Consumer Economy Weakening?
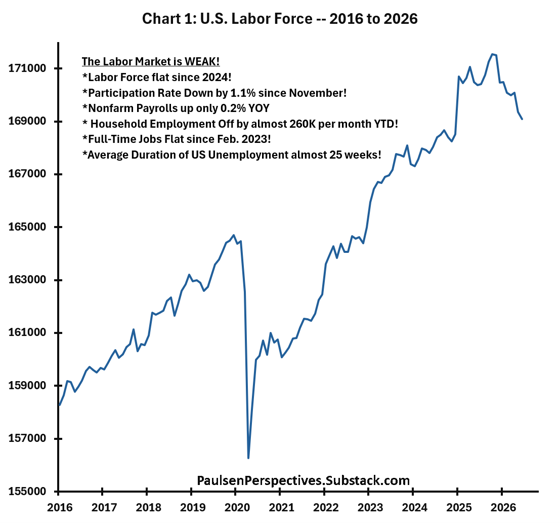
It’s not just a bad month; the U.S. jobs market has been disappointing for some time. As demonstrated in chart 1, labor statistics have been poor across the spectrum. The chief problem is too many are “leaving” the jobs market. The U.S. labor force has uncharacteristically been steadily declining since last October – off by 1.4%! It’s difficult to sustain any meaningful consumer health when the available labor supply is contracting this fast. Indeed, the U.S. labor force has now been unchanged since January 2025! Rarely, outside of recessions does the labor force contract by this much for this long. The overall participation rate is down by 1.1% since November and even the core 25- to 54-year-old participation rate is off by 0.6% since January (i.e., it’s not just aging baby boomer retirements). In May, the average trailing 3-month payroll employment gain was 142k – during the last “3-months” it has only been a paltry 20k. Annual payroll employment growth is only 0.2% in the last year and has been hovering near zero all year long. Indeed, annual payroll employment growth has not been above 1% in two years! Household employment has declined by an astonishing 260k per month since the start of this year! Fulltime jobs in the U.S. have not risen since February 2023 and the average duration of unemployment in this country is close to half a year! How can anyone suggest the consumer sector is in good health, when the jobs market report card looks like this?
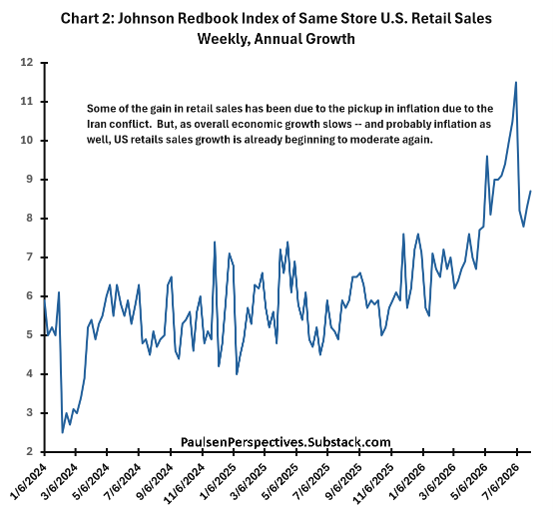
As shown in chart 2, although retail sales did pick up earlier this year, they too have started to moderate again. Much of the improvement in retail sales occurred in April & May suggesting it was boosted primarily by higher inflation from the Iranian conflict. In any event, the temporary surge in retail spending – much like the jobs market -- does appear to be returning to its more tepid trend of recent years.
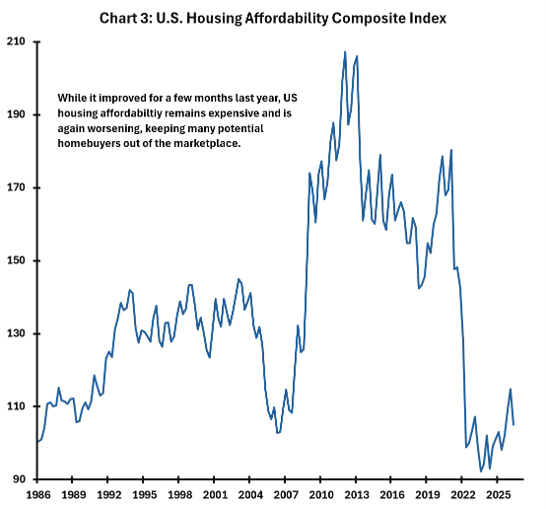
Housing remains out of reach for many Americans. While housing affordability (chart 3) improved for a few months last year, it remains expensive and is again worsening. Indeed, the 30-year average fixed mortgage rate was 6.1% in early March but by Friday it had risen to almost 6.8% -- its highest level in a year. Affordability is nearly as bad today as it was prior to the 2008-09 housing crisis and shows no signs of improving anytime soon.
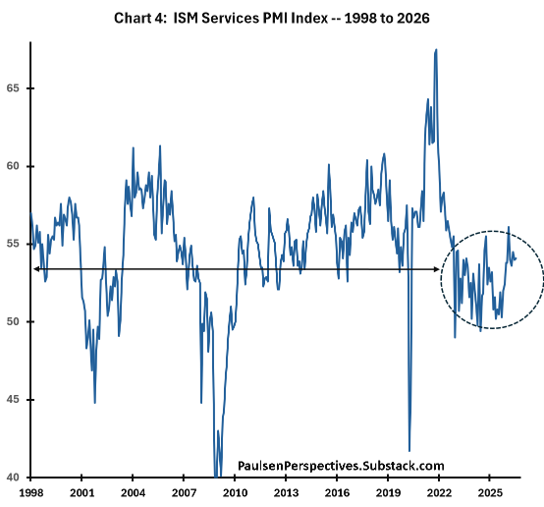
The U.S. manufacturing PMI index rose to 55.6 in July from only 47.9 at year-end. Benefitting from the AI boom in capital investment spending, U.S. manufacturing has improved this year. However, as shown in chart 4, the services PMI Index (impacted more prominently by the consumer) remains fairly tepid. Although, the services PMI has improved since late last year (due importantly to its nominal components tied to price hikes), its current level is still below where it has often resided during expansions since it has been recorded.
Under pressure from prolonged weakness in the U.S. jobs market and from higher inflation, the real purchasing power of the U.S. consumer has declined substantially. Chart 5 highlights that excluding government subsidies, real personal income growth has declined by almost 4% in the last year – something traditionally only seen during recessions. How can consumer spending sustain when real private sector buying power is contracting this significantly?
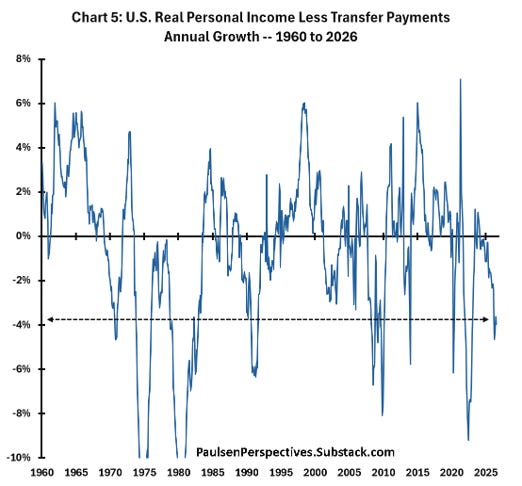
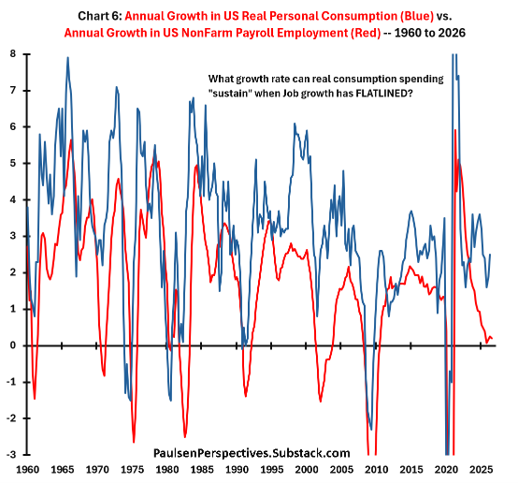
Chart 6 demonstrates the pressure on personal consumption produced by a lack of job creation. With extremely weak real private sector personal income growth and with annual job growth seemingly stalling near zero this year, how long can real consumption spending sustain at an above 2% pace?
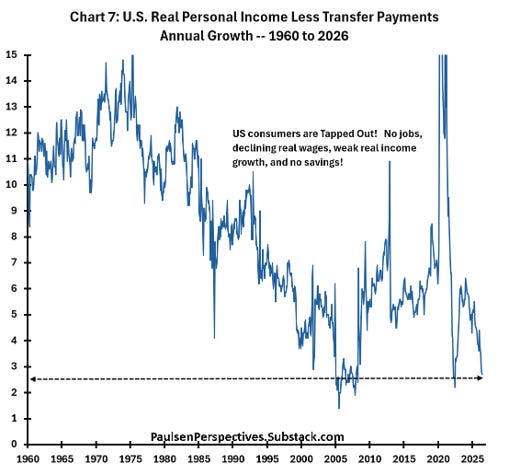
Finally, although upper income consumers may be able to maintain consumption trends with stock market gains, most middle to lower end consumers do not enjoy that luxury. Consequently, as suggested in chart 7, the US consumer appears increasingly tapped out! No jobs, declining real wages, weak real income growth, and no savings!
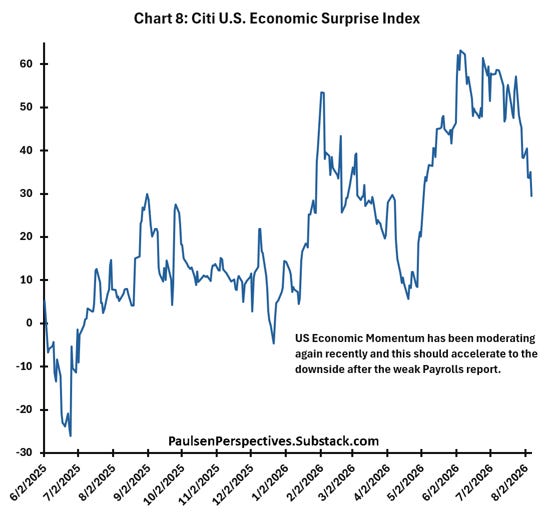
It’s not just that jobs were weaker than most had anticipated last Thursday. The overall economy, particularly the household sector, has been getting weaker again during the last few months. Consequently, despite strong corporate earnings (last quarter) fueled by massive capital spending, overall U.S. economic momentum has recently been slowing again and will likely continue moderating in the coming months. The Citi U.S. economic surprise index (a proxy for U.S. economic momentum) shown in chart 8 peaked in early June and has fallen considerably during the last few weeks. Often when jobs are weaker than expected, economic reports during the entire month prove to be disappointing. Expect the economic surprise index to continue trending lower during the rest of August and into the Fall.
A Change in Perceptions?
A single bad jobs number is generally not enough to broadly change perceptions. Nonetheless, it has sometimes marked a turning point in economic sentiment. Today, it’s not just a single bad jobs report which could alter expectations. The household sector has recently been showing more vulnerability and Friday’s unexpected poor jobs report will only add to this downward momentum.
Moreover, the Iran conflict appears to be winding down (or not?!?). Even if “negotiations” drag on, oil prices do seem to have peaked. Currently near $78, WTI crude oil prices have essentially been flat since early-March suggesting energy price pressures on the CPI index will likely ease in the coming months. Combined with lower wage pressures (also showing moderation in Fridays report) and slower overall real economic growth led by a weaker consumer, inflation fears – at the Fed and among economists and investors – may finally fade. Should inflation concern moderate while real economic growth reports disappoint, consensus fears may shift away from inflation towards supporting real growth and avoiding a recession. If a sentiment shift is forthcoming, how may it play out in the financial markets?
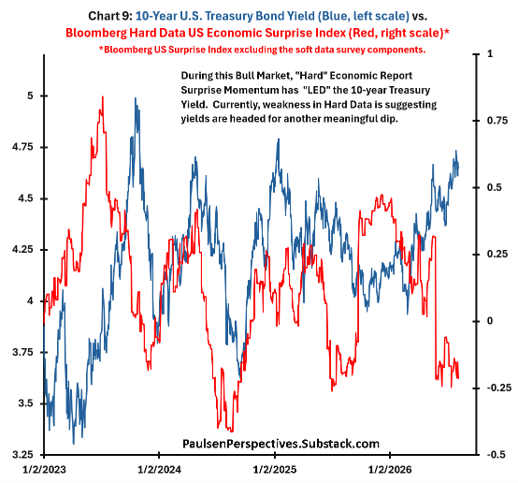
Chart 9 highlights the sensitivity of the bond market to changes in real economic momentum. It overlays the 10-year U.S. Treasury yield with Bloomberg’s Hard Data U.S. Economic Surprise Index (based on economic surprises only from actual economic metrics while excluding any survey results). As demonstrated, during this bull market, the Hard Surprise Index has proved to be a great “leading” indicator for bond yields. As demonstrated, “every” major rise and fall in the 10-year bond yield since 2023 has been “preceded” and foretold by movements in the Hard Surprise Index. The Hard Surprise Index has collapsed significantly since late May suggesting the 10-year Treasury yield may again soon “surprisingly” decline in the coming months. Based on fading U.S. real economic momentum (and also by fading inflationary concerns), could the 10-year Treasury yield soon break back below 4% again?
How will the Stock Market React to “Falling Yields” should Perceptions Shift from Inflation to Growth?
The surprisingly weak jobs report last Friday caused bond yields to decline and the stock market to rally. That is, lower yields are still being perceived as indicating “less inflation risks” and therefore a positive for the stock market. The reaction of stock investors to yield movements is implied by the recent correlation between stock and bond movements.
Chart 10 overlays the 10-year Treasury Bond yield with the trailing 1-year correlation between daily percent changes in the S&P 500 stock price index and daily changes in the 10-year bond yield. The correlation between movements in stock prices and bond yields highlights whether investors are primarily worried about inflation or economic growth. A positive correlation — when stock prices and bond yields most often move in the same direction — indicate investors are worried about weak economic growth. Rising yields are only positive for the stock market when they connote “stronger” real economic growth lessening worries about a recession. Likewise, an environment characterized by falling yields with falling stocks prices reflects the type of stock-bond relationship normally seen before heading into a recession. That is, a positive leaning stock-bond correlation exhibits when investors are worried about the potential for weak real economic growth.
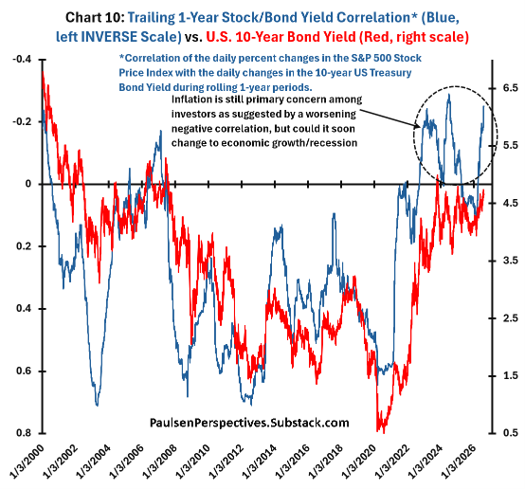
Conversely, a negative leaning stock-bond correlation implies investor concerns are mainly centered on inflation risk. The stock market often declines when yields rise if stock investors fear inflation pressures are pushing yields higher and price-earnings multiples lower. And, when the correlation is negative, lower yields connote lower inflation risk tending to elevate stock prices like what occurred last Friday. Since 2022, as the CPI inflation rate peaked at 9.1%, investors have been primarily worried about inflation, and the stock-bond correlation has mostly been negative.
As shown in chart 10, not surprisingly, bond yields tend to mirror movements in the stock-bond correlation (in inverse fashion). That is, bond yields tend to rise when inflation fears intensity (i.e., when the correlation is trending more negative) and yields tend to decline when recession/weak growth fears heighten (i.e., when the correlation trends more positive). If the decline in bond yields last Friday becomes more pronounced in the coming months, the question facing investors is how will the stock market react? The answer depends on whether the stock-bond correlation stays negative (reflecting ongoing worries about inflation) or trends more positively (suggesting increasing concerns about real economic growth or recession).
Chart 11 demonstrates the importance of the stock-bond correlation for future stock market performance. This chart overlays the stock-bond correlation (red line shown on an inverted scale) with the S&P 500 Index (blue line, log scale) since 2000. Clearly, the stock market has done best when the stock-bond correlation is tending more negatively (i.e., where the stock market usually rises as yields decline and declines mostly when yield rise). This is the correlation usually present when investors are more concerned about inflation than they are about real economic growth. However, when the stock-bond correlation trends more positively (i.e., indicating investors becoming more concerned about the pace of real economic growth or recession risk), the overall S&P 500 has usually struggled. Indeed, since 2000, for all trading days when the stock-bond correlation becomes more negative (red correlation line rises on the chart), the average annualized percent price gain in the S&P 500 index is 20.1% compared to only a 2.2% average annualized S&P 500 percent price gain during all days when the stock-bond correlation becomes more positive (red correlation line declines on the chart). Obviously, the stock market is “highly sensitive” to whether inflation expectations or recession concerns are top of mind!
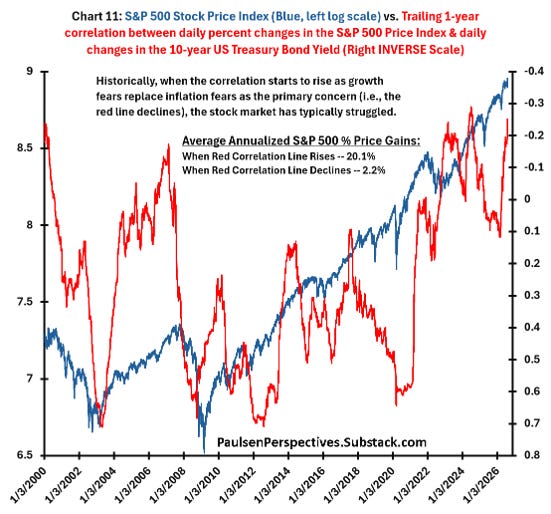
Since March 5th, the red correlation line has risen from +.12 to -.25. The increasingly negative correlation between the stock market and bond yields (i.e., rising concerns about inflation and decaying concerns about a recession) since early March has bolstered the stock market. However, should investors soon become increasingly worried more about the sluggish pace of economic growth than they are currently about inflation risks, and the correlation starts declining again, the stock market could suffer a correction.
Final Comments
My guess is the shockingly weak jobs report last Friday is just another sign among a growing host of economic indicators suggesting the pace of U.S. real growth is again slowing. Higher yields, a flatter 10s to 2s yield curve, a slow-growing real money supply, a contracting federal deficit to GDP ratio, a stronger U.S. dollar, and higher energy prices have combined (with a lag) to slow economic momentum – both real and nominal.
Expect inflation fears to moderate in the balance of this year and for real economic growth and recession fears to broaden. Last Friday, “inflation obsessed” stock investors were still perceiving “lower yields” to be a positive sign for stocks. However, before long, should bond yields continue declining, I suspect they will no longer be perceived as a positive for the stock market. Rather, expect the correlation between stocks & bond yields to trend more positively (i.e., the red line on chart 11 to decline) and for both bond yields and the stock market to decline in unison for a period as recession fears heighten.
I don’t anticipate an actual recession, just a period of scary “recession fears” – intense enough to cause an S&P 500 correction and an S&P 500 technology sector bear market before the end of this year.
Thanks for Taking a Peek! Jimp
Thanks for reading Paulsen Perspectives! This post is public so feel free to share it.
Disclosures________________________________________________________________
Please note that stocks are inherently risky. Any stock can lose most of its value at any moment, including any stock I mention here. You should never rely on a single source for investment decisions, including me. I am a retired investment strategist offering opinions and observations on the markets, the economy and companies. You should do your own research and also consult a qualified financial planner and investment advisor before making investment decisions.
This communication has been prepared for your informational purposes only. This material is for illustration and discussion purposes only and are not intended to be, nor should they be construed as financial, legal, tax or investment advice. This material presents information through the date indicated, is only a guide to the author’s current expectations and is subject to revision by the author, though the author is under no obligation to do so. The views expressed herein are solely those of the author. This material should not be construed as a recommendation, or advice or an offer or solicitation with respect to the purchase or sale of any investment. The information in this report is not intended to provide a basis on which you could make an investment decision on any particular security or its issuer.
Certain information has been provided by and/or is based on third party sources and, although such information is believed to be reliable, no representation is made is made with respect to the accuracy, completeness or timeliness of such information. This information may be subject to change without notice. I make no obligation to maintain or update this material based on subsequent information and events or to provide you with any additional or supplemental information or any update to or correction of the information contained herein. Any opinions and assumptions expressed herein are made as of the date of this communication and are subject to change and/or withdrawal without notice. No liability is accepted by the author for any losses that may arise from any use of the information contained herein.
Any financial instruments mentioned herein are speculative in nature and may involve risk to principal and interest. Any prices or levels shown are either historical or purely indicative. This material does not take into account the particular investment objectives or financial circumstances, objectives or needs of any specific investor, and are not intended as recommendations of particular securities, investment products, or other financial products or strategies to particular clients. Securities, investment products, other financial products or strategies discussed herein may not be suitable for all investors. The recipient of this report must make its own independent decisions regarding any securities, investment products or other financial products.
No posts
Comments
Nothing yet. Say the first thing.
Sign in to join the conversation.