
Dear Investors,
Every year, thousands of stocks get sorted the same tired way.
Cheapest first.
Highest yield first.
Lowest debt first.
Most oversold first.
Screens like that are built to answer a narrow question:
“What looks like a bargain right now?”
And bargains are fine — until you realize that almost none of the market’s greatest fortunes were built on bargains at all.
A vanishingly small number of companies are responsible for nearly the entire net wealth the stock market has ever created. Everything else, on average, barely kept pace with a T-bill.
Once you sit with that fact, the whole exercise of screening for stocks changes. You stop hunting for what’s cheap today and start hunting for what has the traits of tomorrow’s exceptional business.
That shift in thinking is what built the tool below.
Conventional screeners are optimized for the rear-view mirror.
Low P/E.
High dividend yield.
Low debt-to-equity.
High ROE.
A favorable PEG ratio.
Analyst upgrades.
Useful data points, all of them. But none of them explain Amazon, Nvidia, Visa, Apple, or Microsoft in the years before the world caught on.
Some of the market’s best-ever investments looked overpriced by every conventional measure at the time. Often paid no dividend whatsoever. Many traded at multiples that made value investors wince.
And yet they went on to compound wealth for decades.
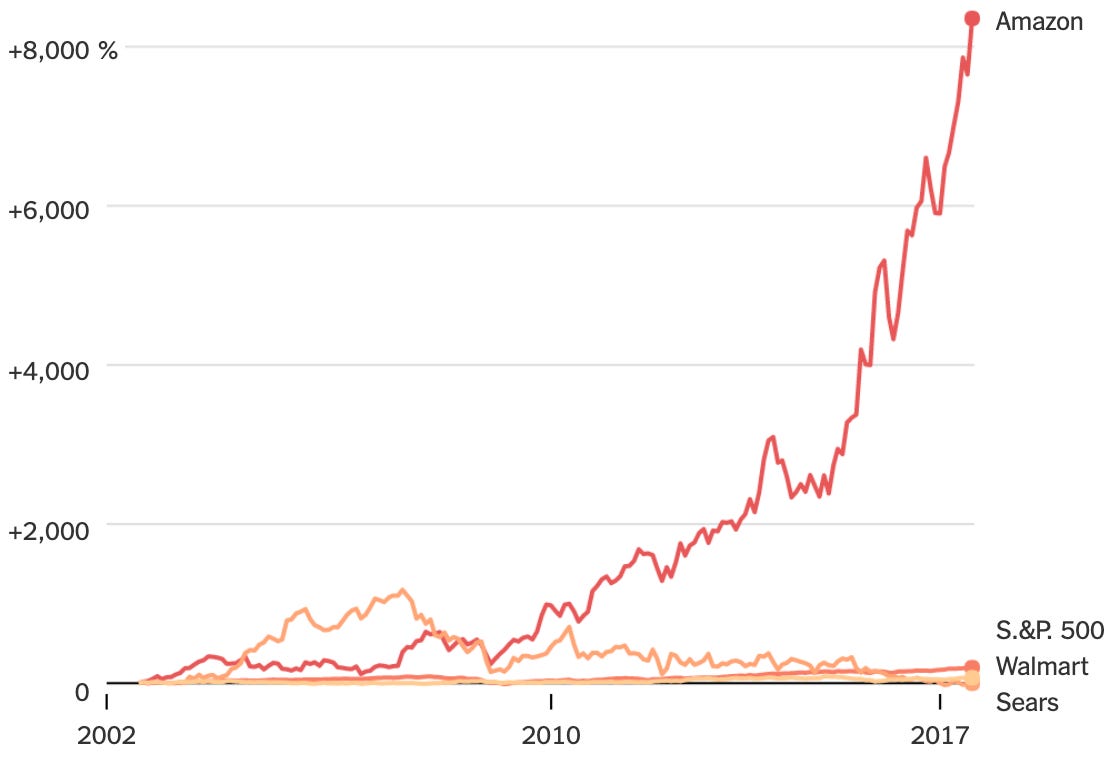
Cheapness was never the variable that mattered. Business quality was.
So rather than ask the standard question —
“What’s cheap right now?”
— I built a screen around a different one:
“Which companies show the strongest signs of becoming tomorrow’s great wealth creators?”
That question can’t be answered with a valuation multiple. It requires a completely different framework.
The result is what I call the Pareto Wealth Creators Screener — not a bargain hunter, but a compounder detector.
Step 1: Cut the Field Down
The vast majority of publicly traded companies will never become exceptional compounders, so the first pass is purely a quality filter: adequate size, a multi-year record of actual profitability, consistent revenue and earnings growth, and a balance sheet that isn’t propped up by goodwill from serial acquisitions.
Step 2: Prove the Business Is Actually Compounding
What survives round one then has to clear a much higher bar on business quality and growth durability:
Net Income CAGR of 8% or higher
Average ROA of 8% or higher
Current-year ROA of at least 5%
Revenue CAGR of 5% or higher, where the data exists
Goodwill kept under 50% of total assets
None of these thresholds are generous. They’re built to exclude anything riding a single good year rather than a genuine multi-year trend of turning capital into profit.
Step 3: Rank What’s Left
Every company that survives gets scored on a weighted composite:
Net Income CAGR — 50% of the score
ROA Trend (is capital efficiency improving or fading?) — 35%
Revenue CAGR — 15%
What comes out the other end is a tight, high-conviction list — businesses showing quality, growth, and improving momentum all at once, not just one of the three.
Join 18,000+ Investors Using the 80/20 Rule to Build Smarter, Higher-Returning Portfolios
The Pareto Investor delivers a proven, systematic framework to apply the 80/20 rule to stocks — focusing only on the tiny fraction of companies that drive nearly all market gains.
Membership Tiers for 2026:
Premium — Everything you need to outperform the market with less effort:
Full access to all live Pareto portfolios (Alpha, Permanent & Momentum)
Monthly portfolio updates with exact stock selections
Rebalancing alerts & detailed review framework
Exclusive investment insights & advanced portfolio optimizations
Elite — Everything in Premium, plus permanent ownership of the most powerful tools:
Pareto Elite Sheet — Fully automated annual rebalancing, real-time portfolio dashboard, and live tracking.
50+ Years of Historical Stock Data.
Pareto Watchlist & AI Stock Screener.
EXCLUSIVE Ultra Alpha Portfolio — Immediate, exclusive access to my highest-conviction wealth-creation framework. Available only to Elite members.
Only 4% of stocks account for nearly all net wealth creation in the market. Why settle for mediocre index returns held back by thousands of underperformers? Join 17K+ investors focusing only on the rare winners — and upgrade your returns with the Pareto Principle today.
Forty companies worldwide cleared every hurdle. Here’s the full ranked list:
Comments
Nothing yet. Say the first thing.
Sign in to join the conversation.