
Something happened on Friday’s close that has only mattered a handful of times since I built this system. The Dashboard’s regime classifier flipped from Quad 2 to Quad 3 - from inflationary boom to stagflation.
It’s important to keep in mind that this classifier is mechanical. It asks two questions over a 126-day window: is credit making money, and are long yields rising? For months the answer was yes and yes, the definition of an inflationary boom. As of Friday, credit’s 126-day return went negative while the 10Y is up 43bp over the same window, and hit 4.7% yesterday.
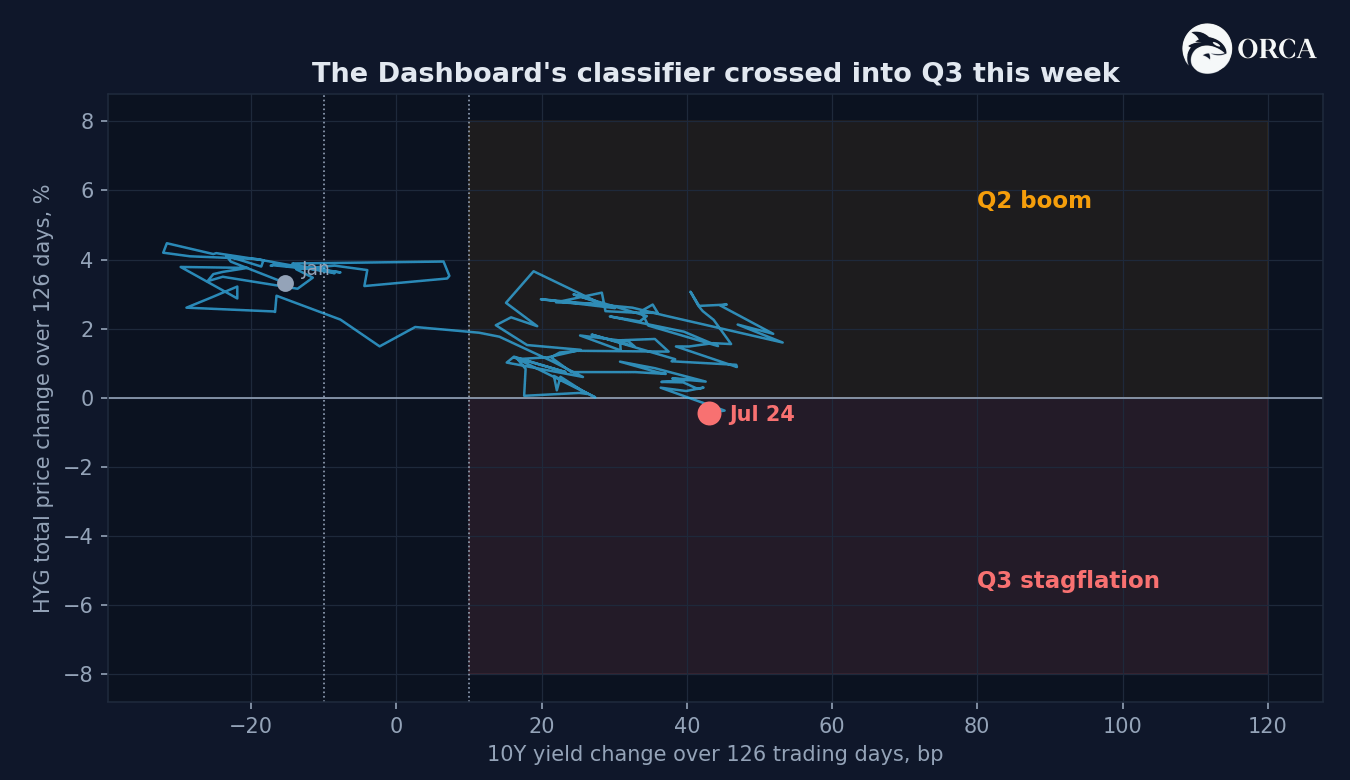
Before anyone panics, two honest caveats. The crossing is shallow - HYG is down 0.4% over the window, sitting practically on the line, and a two-day bounce in credit un-flips it. And the main monthly macro classifier, the ISM-against-CPI on the Dashboard’s front page still reads Quad 2, because ISM is at 53.3 and still expanding. What flipped is the market-based read. The market is voting on the regime before the economy confirms it, which is what markets do.
The timing is the actually the main story. The Fed meets Wednesday, July 29, and this piece is the playbook I promised last week.
Start where I always tell you to start: the bond market. The 2Y yield closed Friday at 4.34%, straight through the 4.26% line I flagged as the level that re-arms the hike. It ran five straight sessions higher into Thursday’s 4.35% peak. The 10Y closed at 4.68%, the yield curve at +34bp, and TLT fell another 1.5% - further below its 200-day. The 2Y now trades some 60-80bp above the funds band. In the FOMC rulebook, that is the bond market instructing a hike.
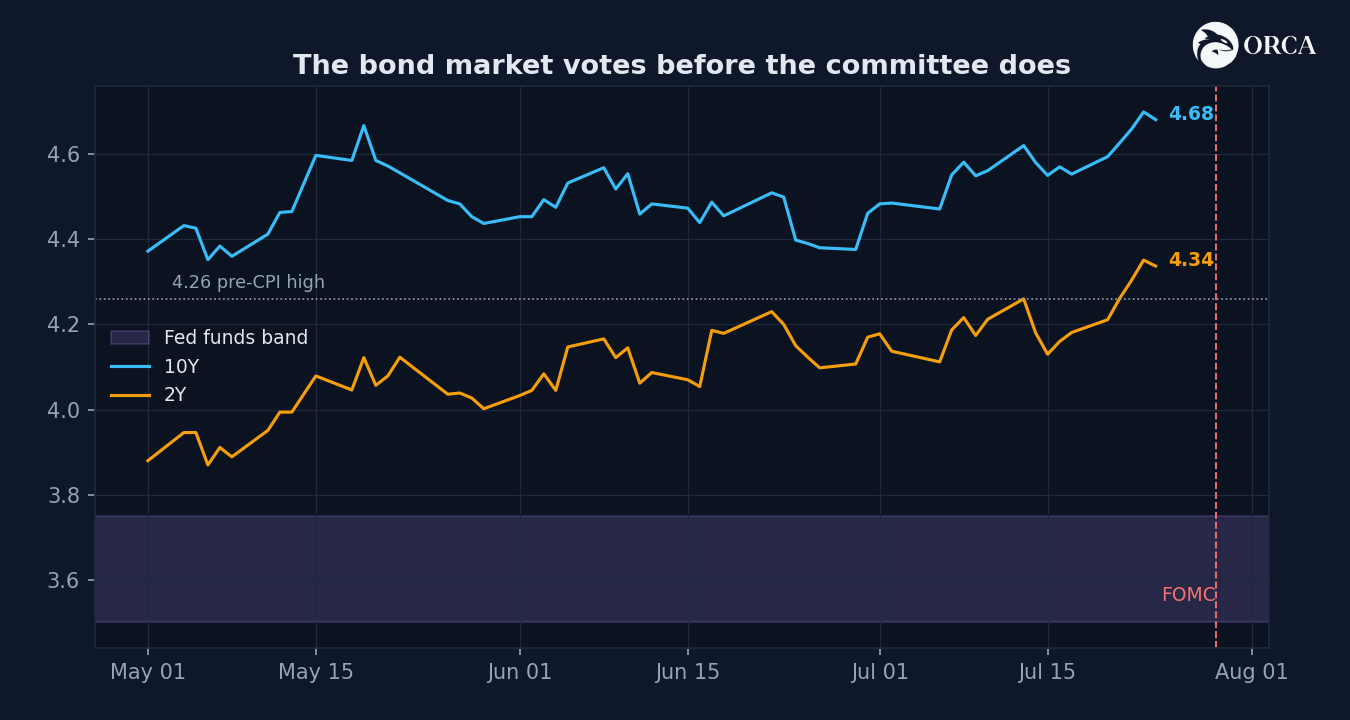
But we knew all that by now.
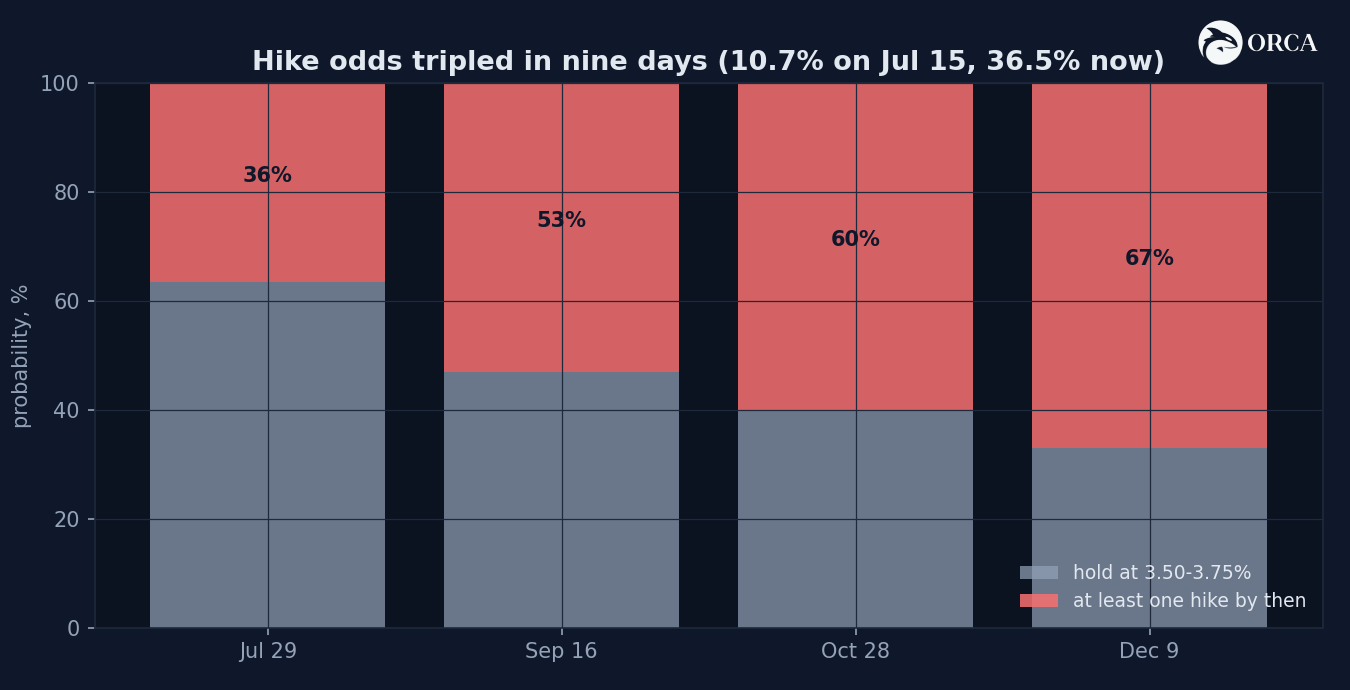
Except this week, the markets finally listened. On July 15 the expectations on a July hike was at 10%. As of Thursday it’s 36.5%, tripled in nine days, with the entire debate confined to hold-versus-25bp hike. By December the market still leans about two thirds toward at least one hike.
And the reason is obviously, oil.
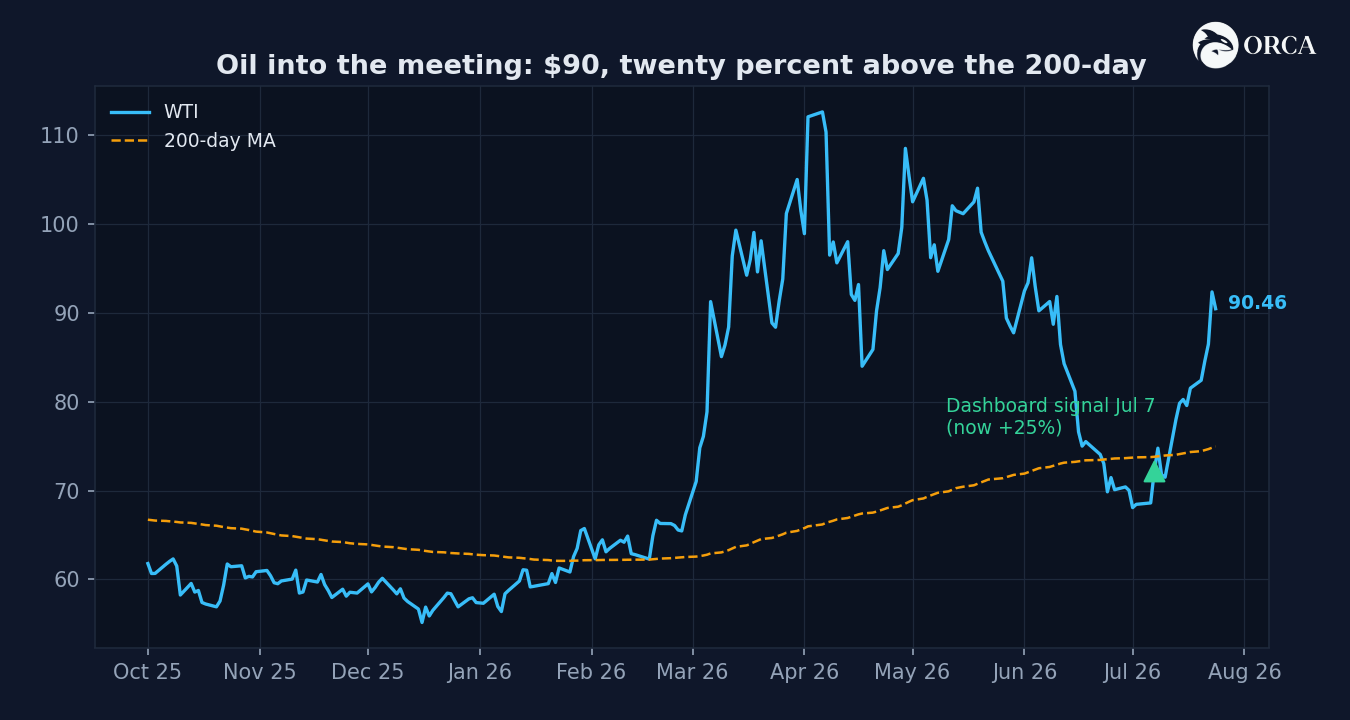
WTI closed Friday at $90.46, up 11% on the week, after touching $92.35 on Thursday. The US has now bombed Iran for nine consecutive nights, tankers keep getting hit in the Strait of Hormuz, shipping traffic through the Strait has slowed, and analysts are openly writing $100 targets. Gasoline is back at $4 a gallon, which is precisely the input that made the June CPI’s 26.7% twelve-month gasoline number look tame.
The Dashboard was on this before the strikes escalated. The July 7th oil signal I wrote about (the MACD bull cross on a reset RSI, eight winners in nine occurrences, mean +12.7% over 60 days) is now up +25.3% in thirteen sessions - double its historical average move, with most of its window still ahead. I ring-fenced those gains two weeks ago and I’m keeping them ring-fenced. The story was unfolding for a while now, and the Dashboard caught it well in advance.
Here is the mechanism to keep straight: the August 12th CPI print will carry this $90 oil in it. So Wednesday’s committee is deciding whether to move against an inflation impulse everyone can already see on a chart but nobody can yet see in the official data. Warsh killed the dot plot precisely so the committee could react to data instead of steering expectations. The uncomfortable joke is that the data is now arriving through a war.
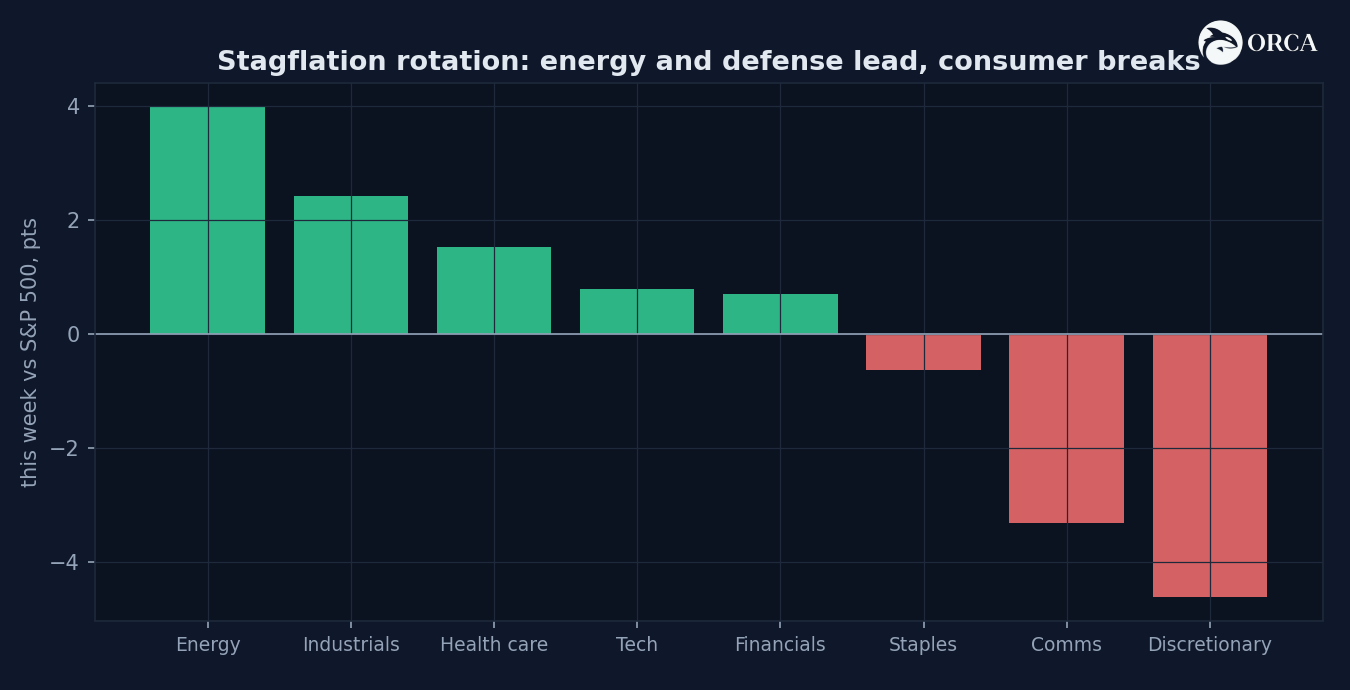
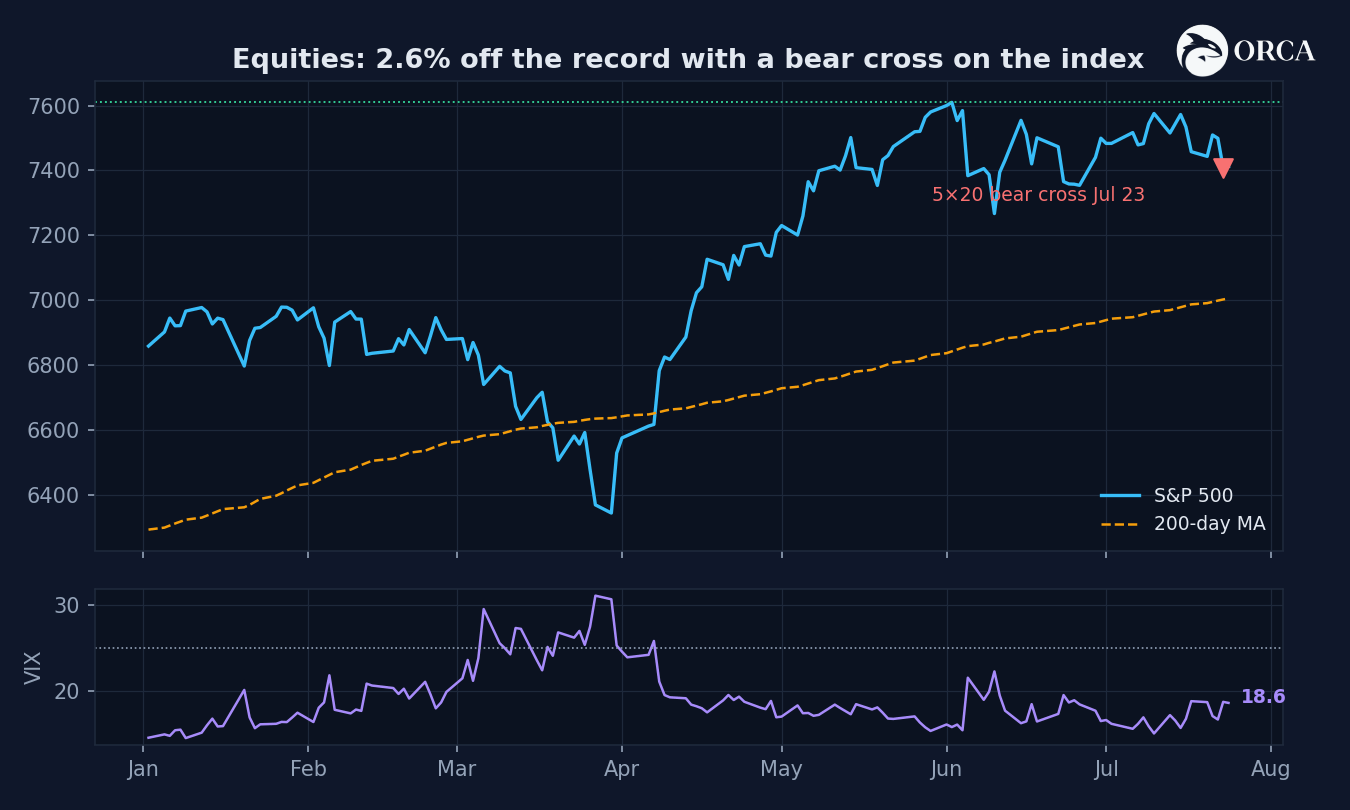
The S&P closed the week at 7,412, down 0.6% on the week and 2.6% below the June record. The Dashboard fired a 5×20 bear cross on the index itself on Thursday (see the technicals sections), the first since June. Consumer discretionary fell 5.2% on the week and sits 6.5% below its 200-day. Communications lost another 3.9%. QQQ gave back 1.6%.
And what led? Energy, up 3.4% against a falling index. Industrials. Health care. Equities are re-sorting for exactly the regime the classifier just named: own the commodity beneficiaries and the defensives, sell the consumer.
The Dashboard’s own firing list tells the same story in a different way: last week ten signals were live, this week three. Part of that is the regime gate itself - signals now have to clear a Q3 filter with much thinner history. But that collapse is information. In the regime the Dashboard now believes we’re in, its index base rate drops to +1.2% per three months with a 59% hit rate, the weakest quadrant on the board, and it has essentially benched itself. The three survivors: a bull signal on the 2Y yield (69% hit rate in this regime), and the two index bear crosses - which, note well, have historically resolved higher six times in ten even in Q3. The Dashboard is telling us to be careful, nothing more.
Under Q3 conditioning, the sector playbook flips hard: staples (+3.4 points relative per quarter, 68% hit rate), utilities (+2.9, 64%), health care (+2.8, 62%) and energy (+1.6, 56%) on the long side, with discretionary (-3.6, 31%), financials (-2.8, 38%) and tech (-2.4, 39%) the historical losers. Just something to keep in mind if you wanna get defensive.
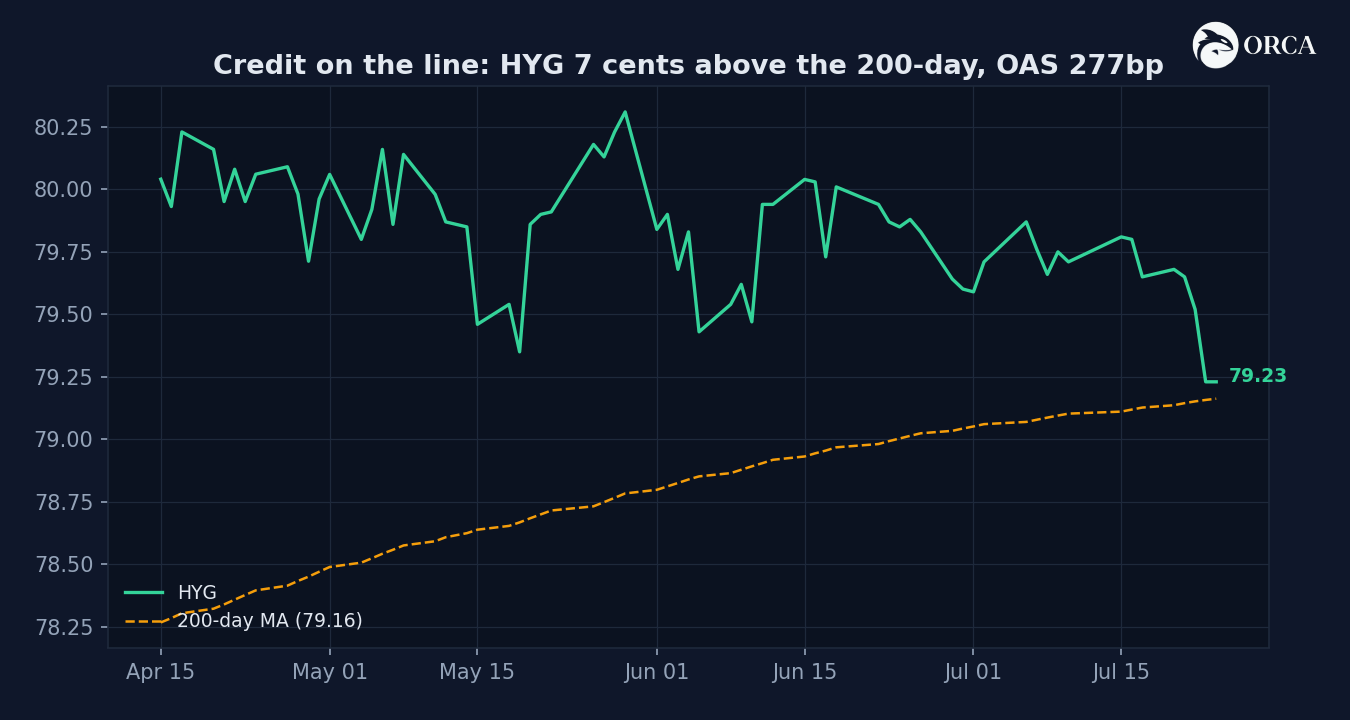
For six weeks credit was the calmest asset on the board and I kept telling you its failure would outrank every other signal. On Thursday high-yield spreads jumped 9bp in a single session to 277bp - the biggest one-day widening since the April tariff scare, and three points from the 280 warning line I set five weeks ago. HYG closed Friday at 79.23 against a 200-day at 79.16. Veeery close (see chart). Last week’s 80% Dashboard buy signal on credit is being stress-tested at the exact worst moment, and whichever way HYG resolves through that line during FOMC week is worth more than anything the statement says.
For completeness, the week’s other data leaned against the stagflation read: Atlanta Fed GDPNow was revised up to 1.7% for Q2, and the Conference Board LEI fell only 0.2% in June to 99.1, with the first-half decline (-0.3%) far milder than the second half of 2025. Growth is soft, not breaking. The “stag” in this stagflation is still mostly forecast. But that’s exactly why we have the Dashboard, to see this unfolding on markets first before it hits the economy.
Three ways the 2pm statement and the Warsh press conference can go, and what each does to the book:
Scenario one: hold, hawkish mouth (prob 63.5%). The committee stays at 3.50-3.75% and Warsh spends the presser acknowledging oil. The front end gets a relief dip that I would not trust for a minute, because September stays live with crude at $90 and the August CPI unprinted. Equities probably rally the day of and chop after. The regime evidence doesn’t change at all on this path. Rotation stays on, duration stays light.
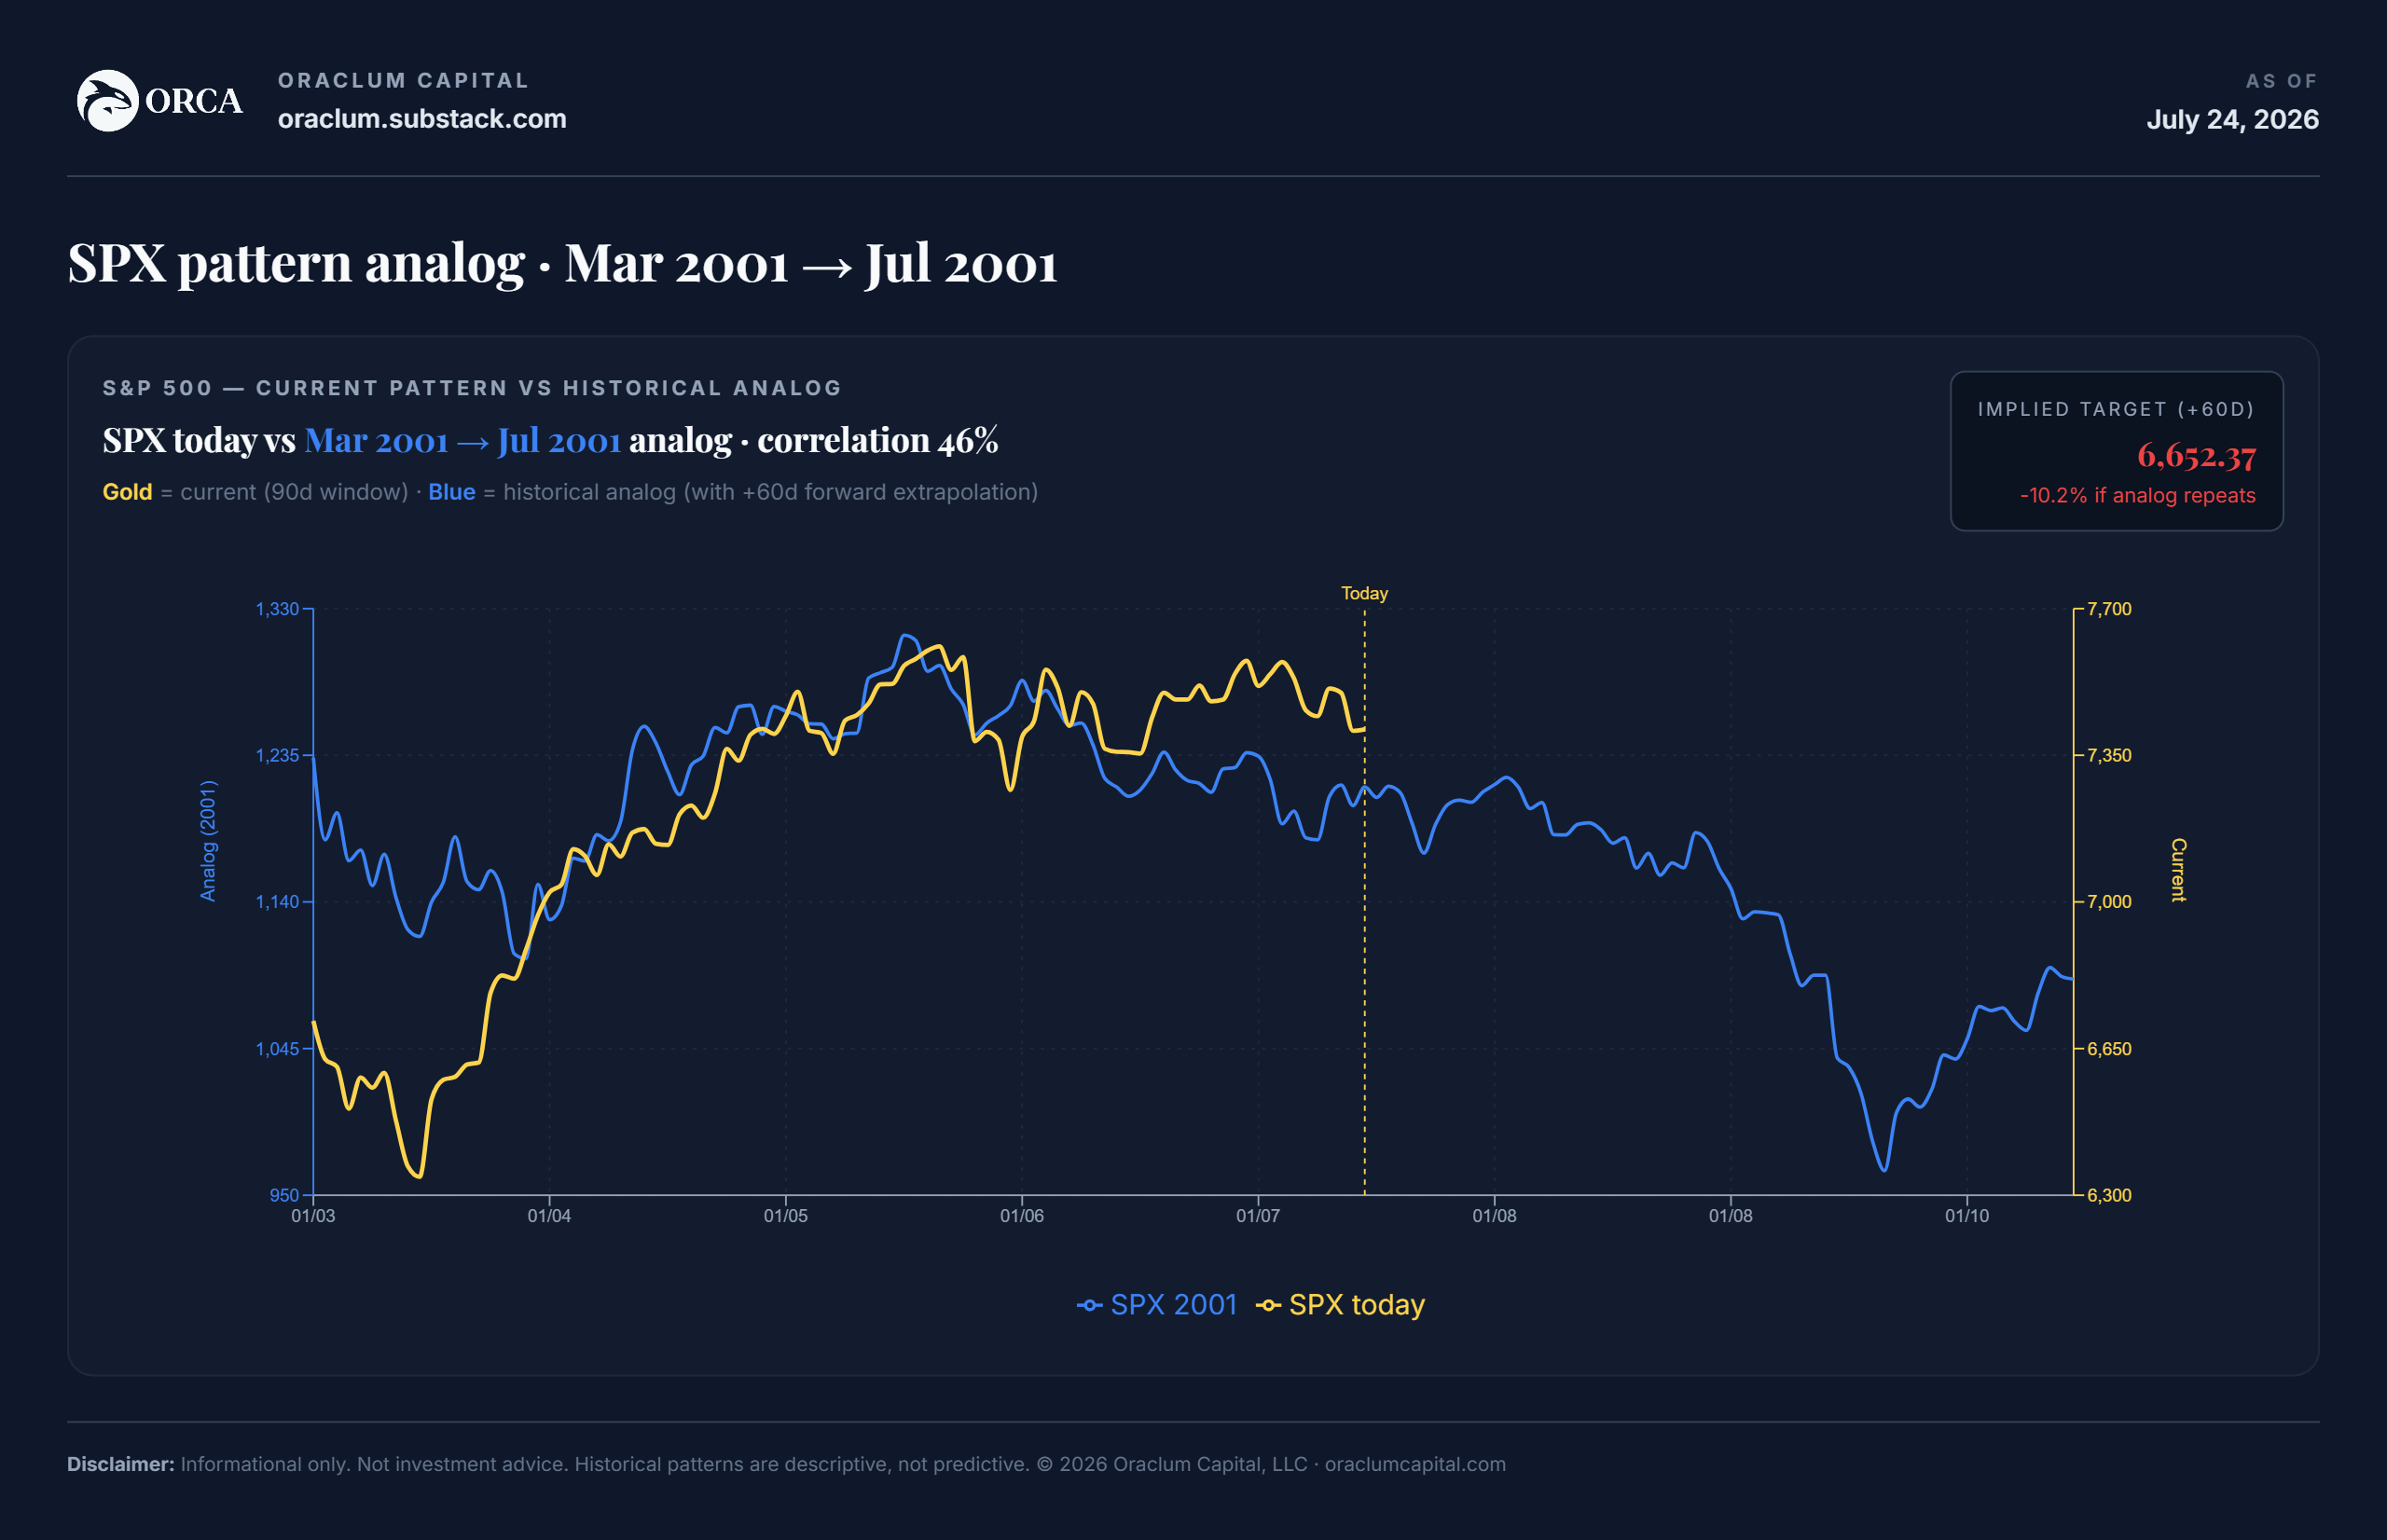
Scenario two: the hike (36.5% and rising all week). First hike of the cycle, delivered mid-oil-shock by a chair markets barely know. The 2Y goes looking for 4.50%, long duration takes a second leg down, and a 20x forward multiple gets re-litigated in public. Before you sell everything, remember what the analog work showed: March 1997 was exactly this - a hike into a boom - and it cost equities 9.6% in six weeks, all of it recovered by May, because credit never broke. The hike is only the disaster scenario if spreads go through 300 with it. Watch the pair, not the print.
Scenario three: the Warsh wildcard. No dots, no guidance, possibly a short statement and a presser that says less than the market wants. The surprise can cut both ways: a hawkish hold (he talks September into the price) or a dovish hike (25bp framed as one-and-done insurance). The referee is where the 2Y trades 48 hours after the presser, never the statement itself. Above 4.34 and the market believes a cycle has started. Back under 4.26 and the whole three-week repricing was one meeting’s worth of insurance, now delivered or postponed.
Ordered by weight. This week the first two can trade places any day.
1. The 2Y after the presser: 4.26 / 4.34 / 4.50. The whole meeting compresses into which side of those lines the 2Y picks by Friday. Above 4.34, the hike cycle is real and the March-1997 clock starts. Between the lines, nothing was decided and August data decides it. Under 4.26, the front end just told you the oil shock gets looked through, and that is the single most bullish outcome available for equities next week.
2. Credit at the line: HYG 79.16, OAS 280 then 300. Thursday’s 9bp lurch to 277 puts the warning line in reach of any single bad session. A weekly close above 280 flips my read from rotation to distribution, exactly as specified five weeks ago, and above 300 the book goes defensive regardless of what the Fed said. Conversely: HYG holding its 200-day through a hike would be the strongest confirmation the 1997 road is the right map.
3. Oil between $90 and $100. Holding a $90 handle into the August 12 CPI makes September very hard for the committee to skip. A $100 print, which the Hormuz math keeps on the table, turns an inflation problem into a political one mid-Jackson-Hole. The retirement level is unchanged: back below the 200-day near $75 and the entire hawkish case dies of natural causes, though from $90 that is a long way down.
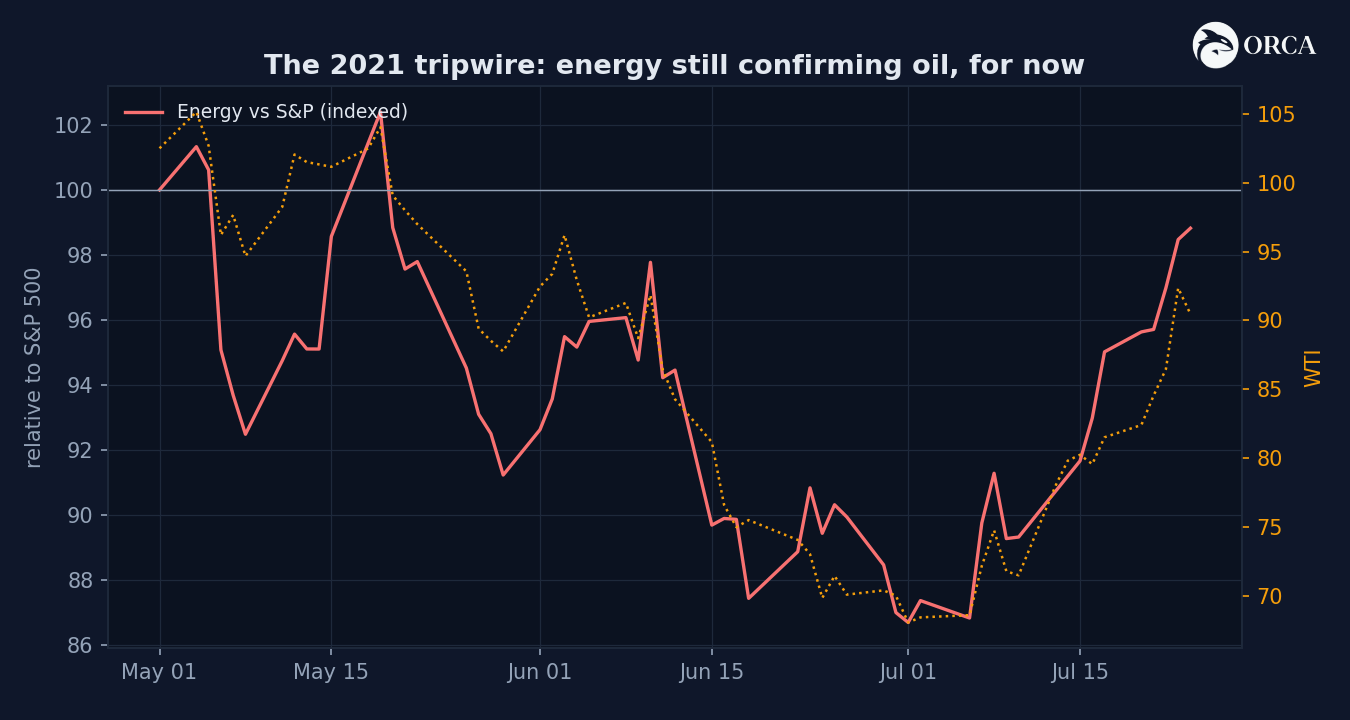
4. The 2021 tripwire: energy versus oil. Not tripped. Energy was the week’s best sector while oil rose 11%, so the commodity and the equities still agree. The signature I’m watching for is XLE relative strength rolling over while oil holds $90 - the week that happens, per the March 2021 analog, I trim energy into strength, stop underweighting tech, and let duration back in.
5. The VIX 25 gate, and the Dashboard’s own silence. Every signal passes a VIX ≤ 25 filter, and vol at 18.6 into a binary meeting leaves less room than the calm surface suggests. The firing list already collapsed from ten to three on the regime gate. If a hike takes the VIX through 25, the Dashboard goes fully dark, and going flat when it does is part of the system’s design.
Core per the Q3 playbook: staples, health care, energy overweights; discretionary and tech underweight; small caps untouched at benchmark. Duration underweight holds while the 2Y signal is live and TLT is below its line. The oil sleeve keeps its +25% with a stop that guarantees the trade cannot round-trip. Index protection sized through Friday of FOMC week, bought before Wednesday, not during the presser. Nothing gets added on Wednesday itself - the Dashboard trades regimes, not press conferences.
The calendar after Wednesday: core PCE July 30, ISM August 3, payrolls August 7, the CPI that carries $90 oil on August 12, and Jackson Hole at the end of August, where a Fed that may have just hiked explains a reaction function it hasn’t published.
Next week I’ll discuss the meeting post-mortem, what the 2Y verdict was, and give you a more long-term overview over the next several months. We could be in for a rocky August and September, once again.
Thanks for reading! And thanks for subscribing to the newsletter.
DISCLAIMER: Neither the survey nor any of the contents of this website can act as investment advice of any kind. The results of the survey need not correspond to actual market preferences or trends, so they should be interpreted with caution. Oraclum Capital, LLC (Henceforth ORCA) is a management company responsible for running the ORCA BASON Fund, LP, and for organizing a survey competition each week, where it invites the subscribers to its newsletter (this website) to participate in an ongoing prediction competition. The information presented on this website and through the survey competition should under no circumstances be used to solicit any investment advice, nor is it allowed to be of commercial use to any of its readers. The survey and this website contain no information that a user may use as financial or investment advice. All rights reserved. Oraclum Capital LLC.
Comments
Nothing yet. Say the first thing.
Sign in to join the conversation.