
A hell of a week to finish off a hell of a month.
Lot’s of things we'll cover today, but first some housekeeping.
NOTE #1: I will be out of office the next two weeks, but the newsletter will still be active. The survey will run as usual the next two weeks. You will get a brief reminder on Aug 4th and Aug 11th, as usual, but without a TA element this time. Just a reminder not to forget to participate.
NOTE #2: The Dashboard and premium access will remain free throughout August as well and the official paywall will be lifted on September 1st. You will continue to get immense value for free until then, especially given that I plan to talk more about expectations coming into September and around the Midterm elections once I come back in mid-August.
NOTE #3: I won’t leave you alone entirely during the next two weeks. Next Saturday I’ve scheduled a long post discussing the monetarist theory of the new Fed governor. It’s an ideal long summer read; an economics piece like I haven’t done in a while, but I think is very important in understanding the long-run context of what the new governor wants to do. I wanted to discuss this today, but too many things happened this week, so I postponed it for next week.
Ok, now we can begin. Today we will cover the following:
The rotation of the decade: high beta momentum stocks experienced their worst month ever (down 38%), while the SPX was only 2-3% off all-time highs.
The decline in the AI momentum trade this past month caused an absolute disaster on the Korean market (the entire market plummeted 40% as its bubble burst), but it also pulled down quite a lot of funds domestically, and even produced a few margin calls. Part of this rout in momentum led to a margin call of a large AI-growth fund, Situational Awareness, led by Leopold Aschenbrenner. I argue that their forced liquidation is what pushed the market down 1.5% on Wednesday, NOT the Warsh press conference and the subsequent reaction of the long end of the bond market.
I would have loved to see ORCA make money during this rout but we unfortunately had our first negative month this year, down 2.8% (still up 16% gross YTD). Not because we were caught on the bad side of the market, but because we had 4 misses in a row in our signal. Another reminder that the market doesn’t care about what I want :)
PCE Inflation came in lower, big tech earnings delivered (MSFT, APPL, AMZN), and the Dashboard pulled back into quad 2. Panic averted for now.
This chart from Hedgeye was widely shared last week on X:
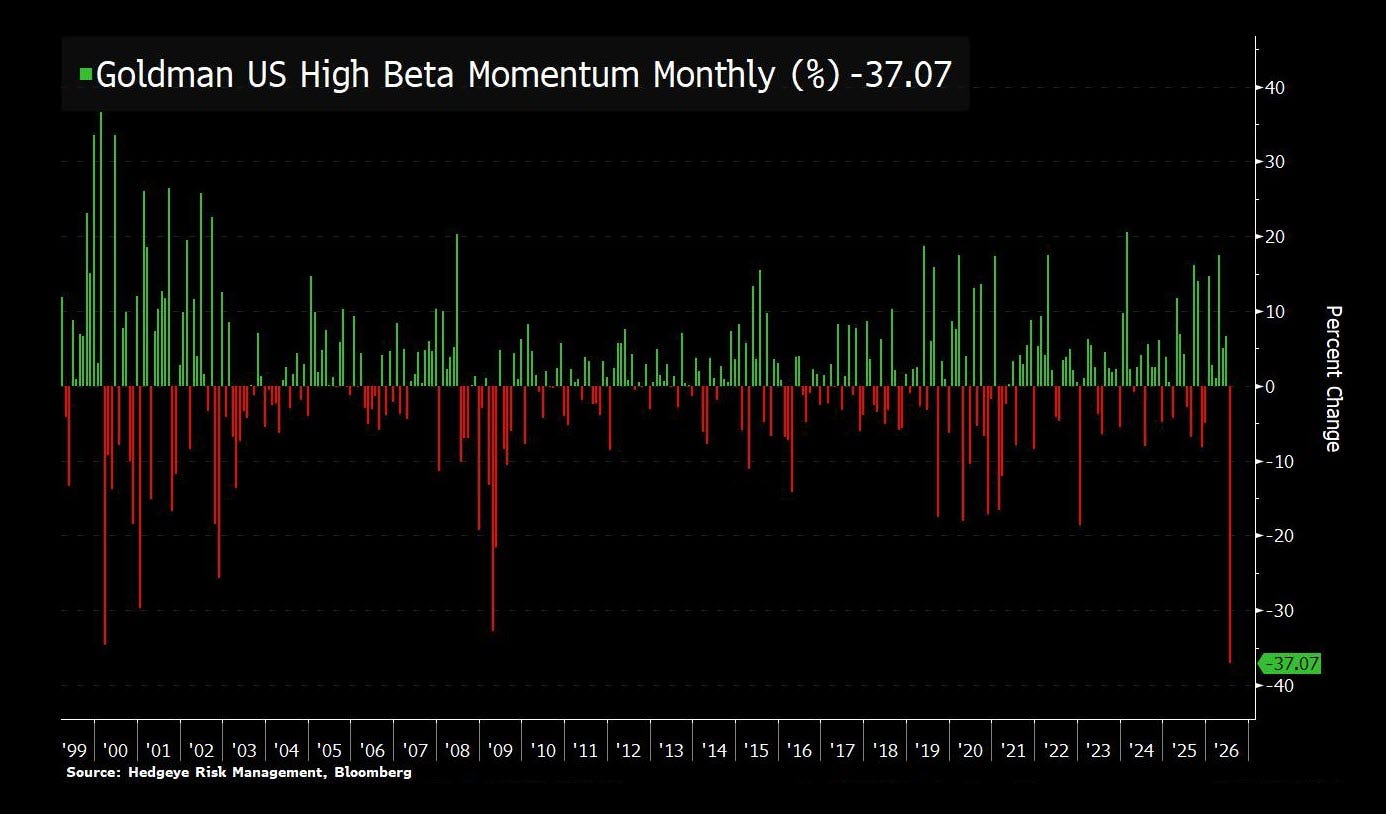
Goldman’s report for high beta momentum stocks performance showed that these stocks (comprised in today’s case with high-growth AI names) had their worst month ever since Goldman collects the data. Worse than 2001, worse than 2008, worse than COVID, or the 2022 bear market. Of course those episodes lasted longer, this is just one month but once momentum breaks it’s anybody’s guess when this might end.
Victims? Two were most prominent.
First was the Korean stock market, which was entering a typical bubble this year, surging on leveraged AI bets (116% growth in H1 2026 - unreal for a composite index of a major industrial country), rising to become the 6th largest in the world based on market cap, until it all came crashing down this week with a total 40% decline since it’s June peak.
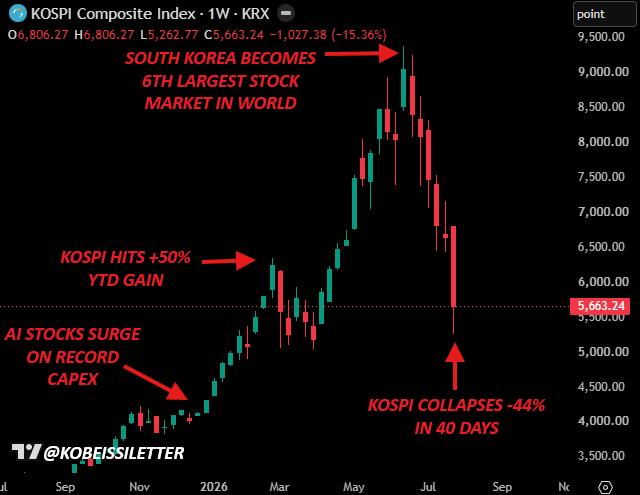
How did it go up and down so fast? Leverage. As you may know, when you grow on leverage, the losses don’t need to be big before you start losing it all. A series of correlated smaller losses quickly accumulate and hit margin requirements and forced liquidations, which implies selling at the worst possible moment, which amplifies losses for everyone else and the spiral becomes deadly.
A JPMorgan report noted that the majority of the highest leveraged ETFs in the Korean stock market - about 90% - have been liquidated in this process:
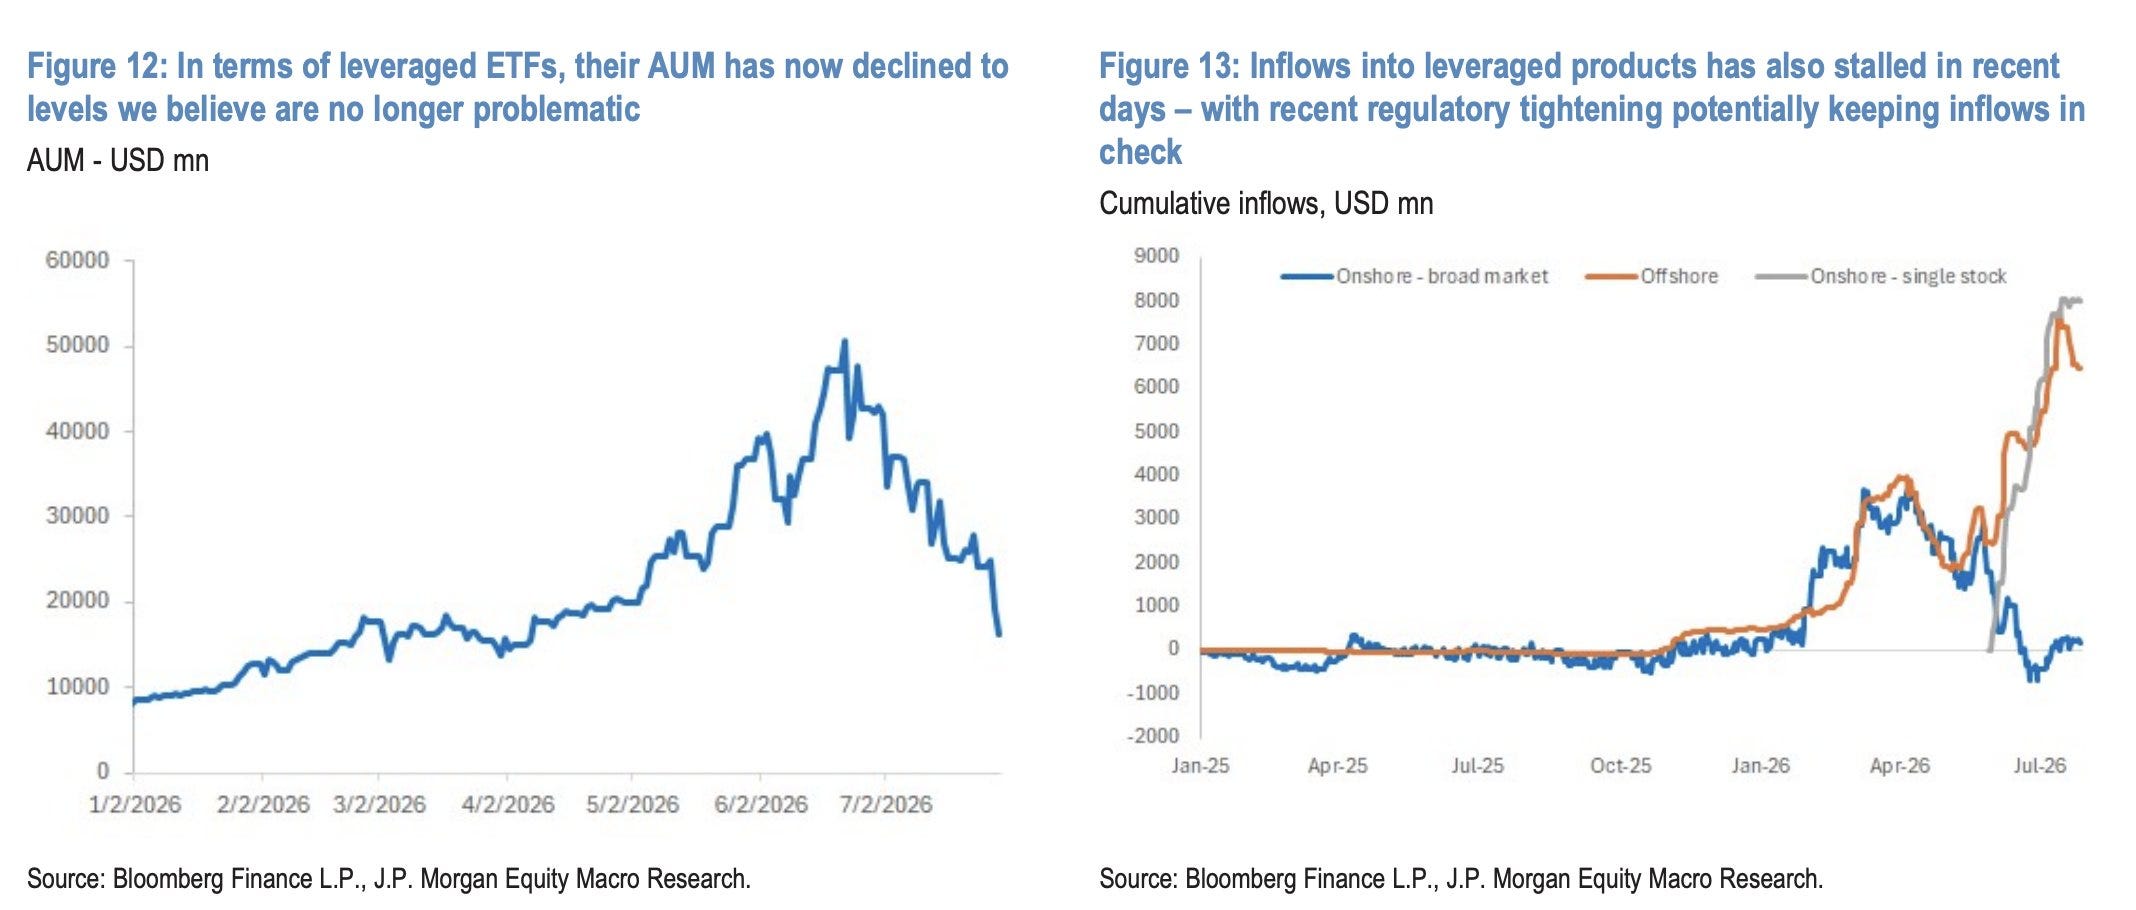
1.6 million Koreans faced heavy losses on their leveraged bets, while almost 400,000 of them got margin called - meaning they lost more than they had in their accounts. These are all retail traders (locals call them “ants”), mostly younger, priced out of owning a home and resorting to leveraged trading to get-rich-quick. They made a shift from crypto into AI this year and they did so in unprecedented volumes. Which makes the crash all the more painful for all these people, and Korea is likely to face another (hopefully smaller) financial crisis.
Leverage was a major player in yet another Fund that found itself in trouble this week - the superstar performer Situational Awareness Fund, led by the 25-y.o. former OpenAI employee Leopold Aschenbrenner. This one was also brewing over the past month, and saw its 30% monthly losses before this week quickly spiral into 67% by the end of Wednesday (as reported by Achenbrenner himself in his weekly letter to his investors).
The SA Fund was a highly leveraged, highly performing AI-momentum stocks growth fund, delivering over 2,000% to its investors since inception, 3 years ago. This year, they were up 400% before the rout in July started. After their 67% loss in July, they are still up 80% YTD, as reported in their Letter. This is very much expected in highly leveraged growth funds like these - volatility will be immense and one has to have excellent risk management tools to stay alive during periods of inevitable drawdowns.
The problem there was that bigger players smelled blood and applied pressure to force them to liquidate positions. Leverage playing out the exact same way as in Korean ETFs - smaller losses can turn into heavy ones very quickly if prices keep falling. Allegedly, other funds began shorting the AI momentum names held in the SA portfolio, which pushed their prices down even more, drawing up margin requirements by their brokers. This forced the $20bn fund to seek more capital to put up with higher margin requirements in order to weather the storm. But it was too late. By Wednesday the book has been forced liquidated. SA had to sell all of its AI holdings on big discounts, and the buyer on the other side was none other than Citadel. Not the first time they are on the other end of such transactions, this is basically their M.O.
In the end, the story generated a lot of backlash against the young PM, mostly on accounts of bad risk management. Still, their investors are making excellent returns, the fund did not blow up, they haven’t done anything illegal, and can very much rebuild from where they are now. This is very far from the stories of Archegos or FTX that many people started to evoke, and the comparison is frankly unfair.
What got me so interested in the story is the sell-off on Wednesday after the FOMC press conference. The presser delivered nothing special: a hawkish pause, slightly reduced rate hike expectations, and a somewhat stronger reaction on the long end of the bond market - the 2Y went down, but the 10Y and 30Y shot up (more on this below)
And yet the sharp sell in the final hour seemed very unusual to me as a mere response to the FOMC presser. Even with the long end reacting the way it did, it did not warrant such a big equity sell-off. This was a liquidation, pure and simple. AI momentum pulling down a bunch of other names along with it. The proof? A massive bounce back the following two days, while the 10Y and 30Y kept going up. If this was a macro-induced sell-off it would have continued. No, this was a liquidation-driven sell, and a bounce after the portfolio has been scooped.
But let’s get back to macro.
The Fed held at 3.50-3.75% on Wednesday, and the decision came with the most hawkish split of the cycle: three dissents in favor of a 25bp hike. Warsh called the hold “especially prudent at these uncertain times” and repeated that 2% is the target, with no soft or implicit target around it.
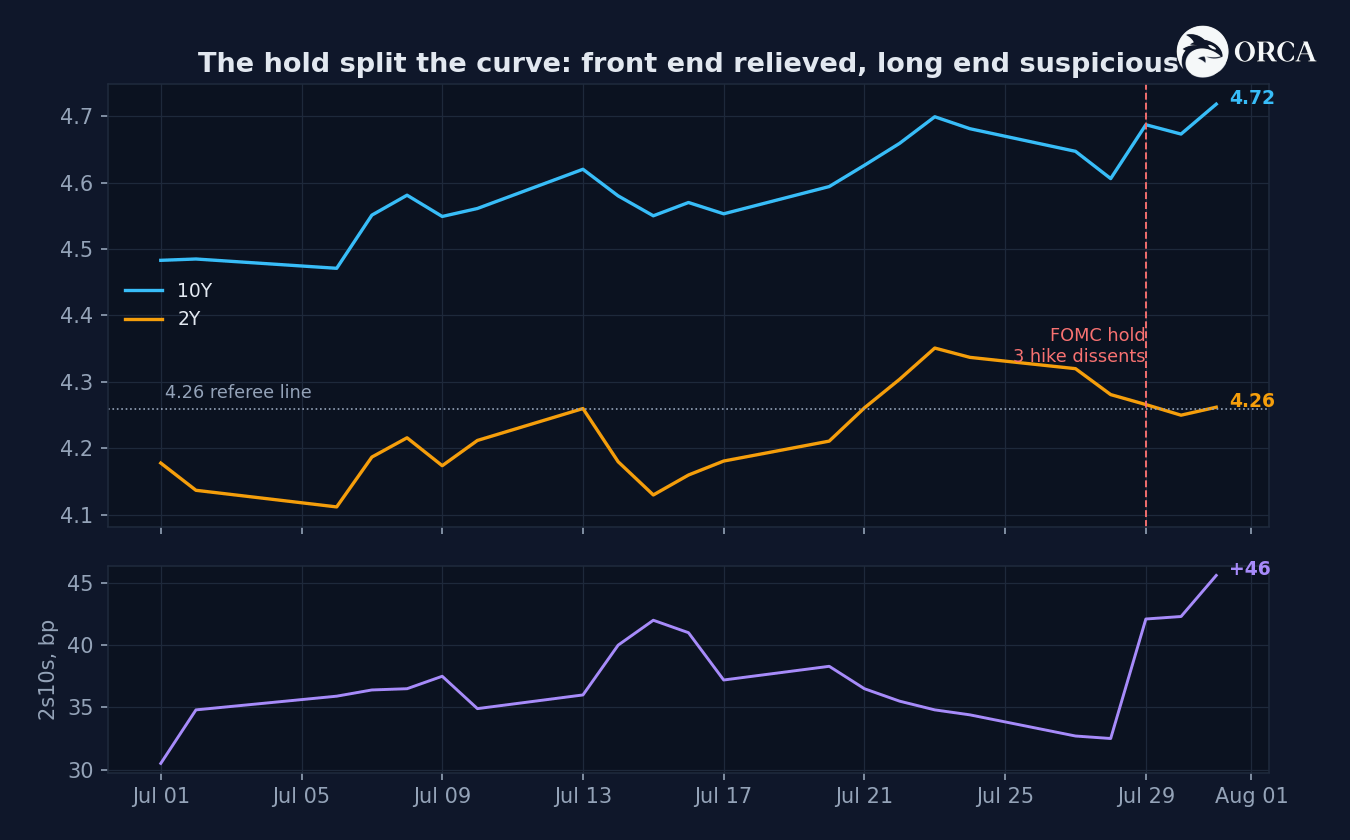
Now recall the referee I set before the meeting: the 2Y, 48 hours after the presser, against 4.26 and 4.34. The verdict came in fast. The 2Y fell from its Monday 4.32% through the meeting to close the week at 4.26% - sitting precisely on the line, having taken the July hike out of the price and left September fully in it. Futures now put 67% on at least one hike by the September 16 meeting. The front end read the dissents as a promise.
The long end read them as a problem. While the 2Y eased, the 10Y went up - 4.61% before the meeting to 4.72% by Friday - and the curve steepened from +33bp to +46bp in three sessions. The 30Y was even more concerning, going up to 5.2%, the highest level since 2008.
That is a textbook bear steepener, and it is the single most important chart of the week: the front end trusts the Fed to move in September, and the long end is charging more for the wait, because a committee that holds with oil at $87 and core PCE at 3.3% is a committee accepting inflation risk in exchange for time. In other words, the oil-driven inflation shock is transitory.
TLT fell another 1.2% and sits well below its 200-day. The Dashboard agrees with the long end - the 2Y bull signal that fired on July 13th is still live, and duration has not earned its way back into the book.
The data around the meeting fed both camps. Q2 GDP printed +1.5% annualized against 1.8-2.1 expected, with the Q2 PCE price index running 5.1% - slowing growth, hot prices, which is the stagflation drift in one release. June core PCE eased to 3.29% from 3.41%, the first real improvement in the Fed’s own gauge since spring. And GDPNow opened its Q3 tracking at 5.0%, which I’d treat as the usual inflated first print rather than a boom call - the model starts every quarter optimistic and earns its way down. Expect it back down to 2-3% soon.
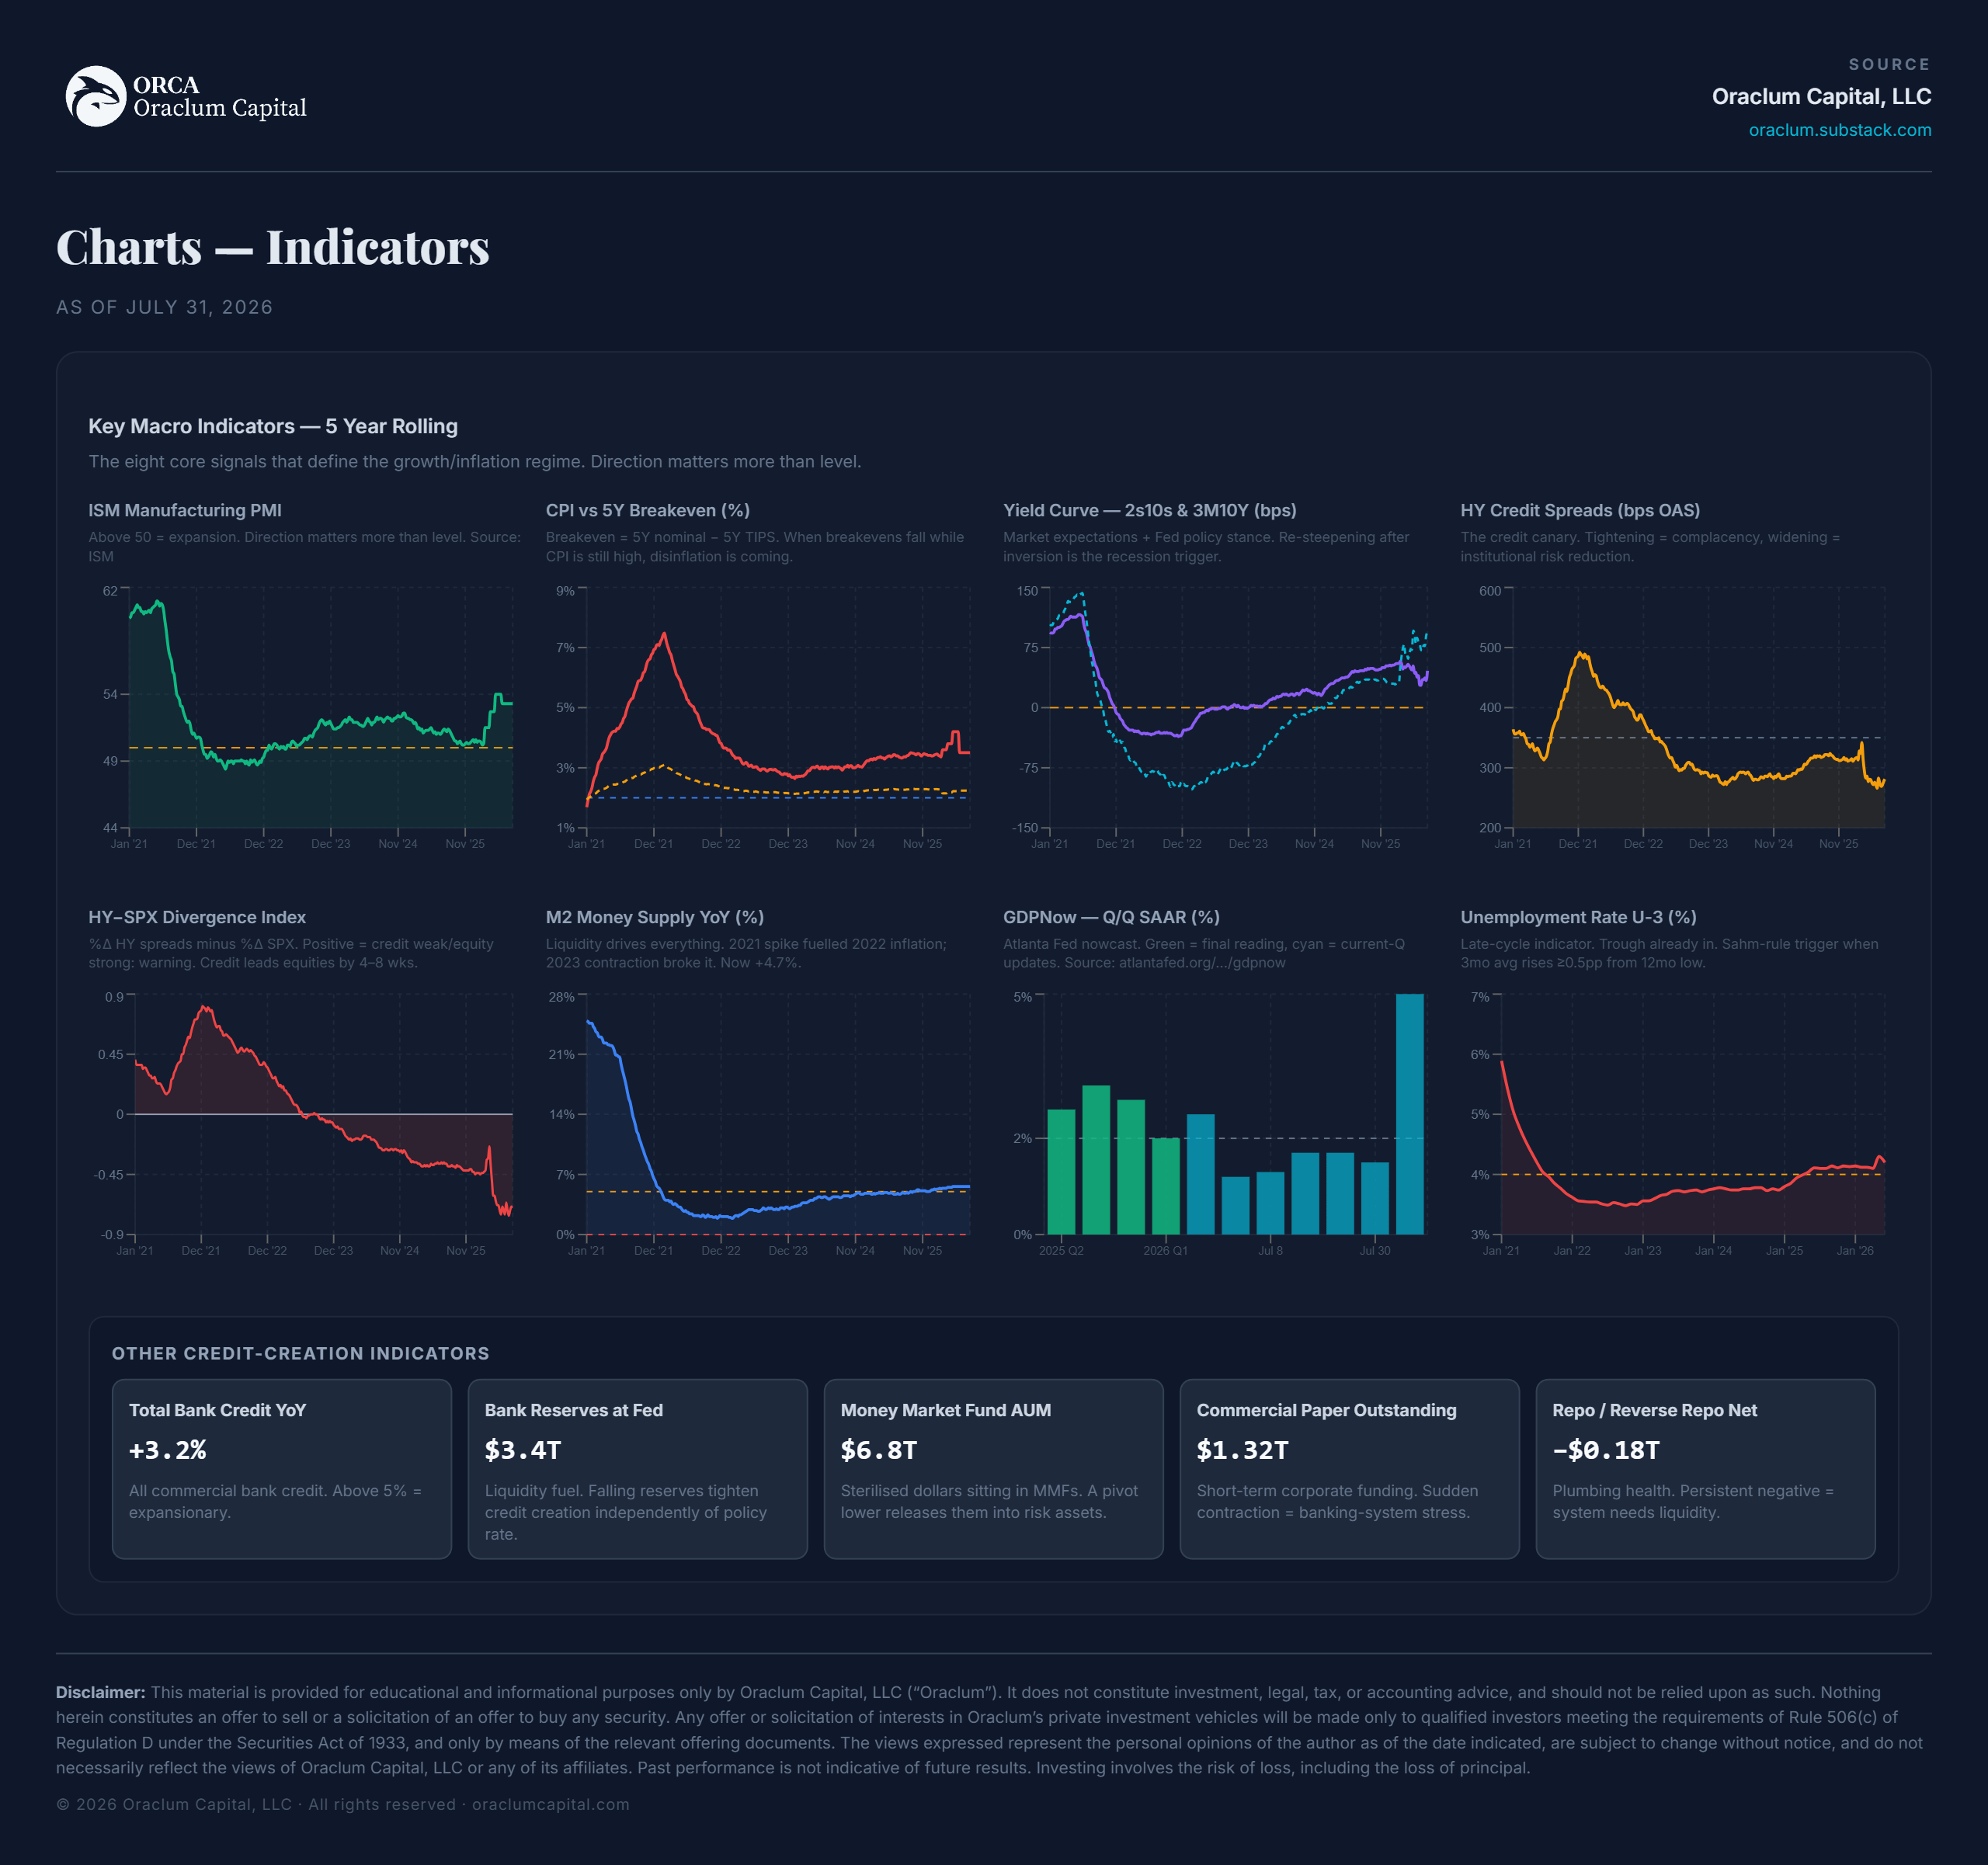
So the bond market’s position, stated plainly: the hike was not cancelled, it was scheduled. September at 67% with two more inflation prints (Aug 12 and Sep 10) and one payrolls report (Aug 7) between here and there. The 2Y sitting exactly on 4.26 is the market keeping its options open, and whichever way it breaks off that line in August is the next verdict.
Last week I told you the Dashboard’s regime classifier had flipped to Quad 3, that the crossing was shallow, and that a two-day bounce in credit would un-flip it. That is exactly what happened. Credit bounced through the Fed meeting, and as of Friday’s close the Dashboard reads Quad 2 again - inflationary boom, six days in stagflation, round trip complete.
I want to be straight about what that was and wasn’t. It wasn’t a false alarm to be embarrassed about; the classifier did its job, registering that credit had stopped making money while yields kept rising. It also wasn’t a regime change, and I said so at the time - the crossing was four tenths of a percent deep, and the whole point of publishing the caveat was so we would both know what a reversion looks like when it comes. Here is what it looks like:
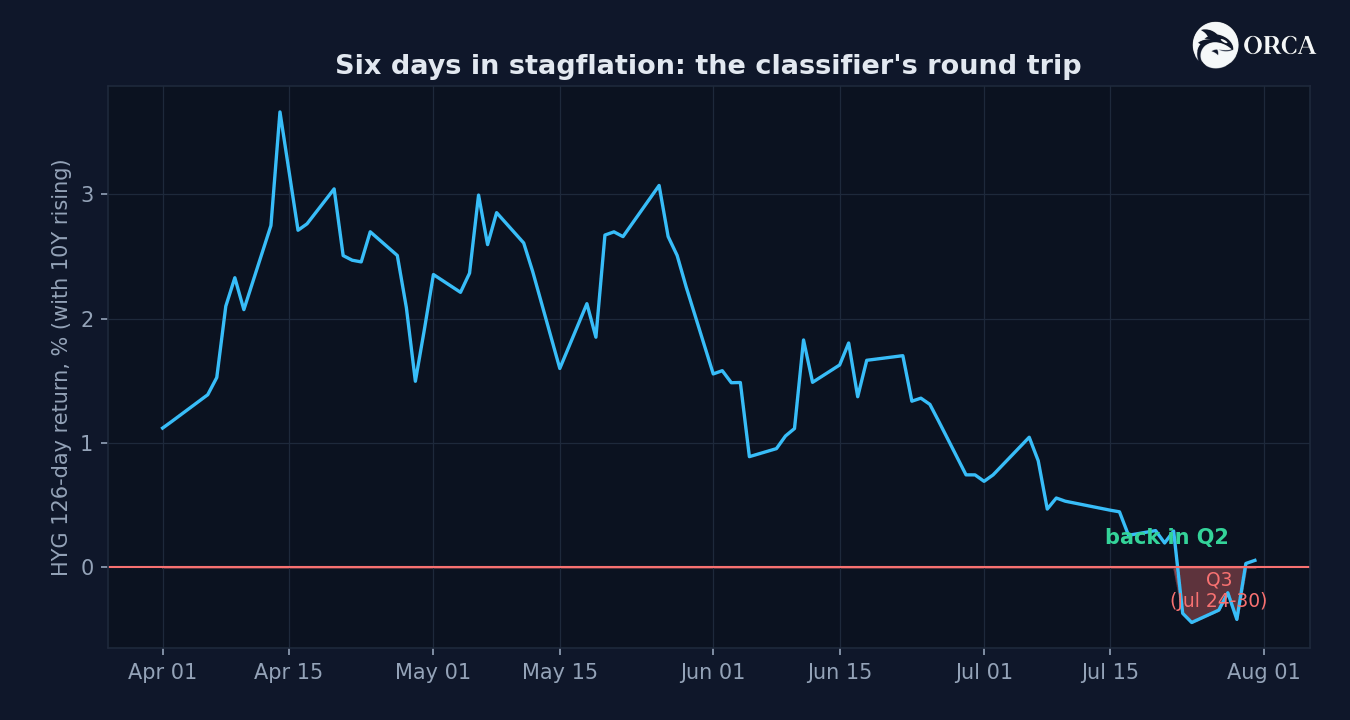
The margin is still paper thin. HYG’s 126-day return is hovering a whisker above zero, so the classifier will live near this line for weeks, and I’d expect at least one more head-fake in August. The signal count tells you what changed in practice: three signals firing under the Q3 gate last week, sixteen under Q2 now - financials (71% hit rate, the top of the book), industrials (72-73%), staples, and a gold cross. The Dashboard went from benched to busy in one week. That is what a regime sitting on a knife edge does to a gated system, and it is why the answer to “are we still in Quad 3?” is: no, but keep your hand near the switch.
See for yourself:
Now the part that I think matters most for portfolios, because a flat index hid a violent month underneath. The S&P finished July down 0.1%. Here is what happened inside that nothing:
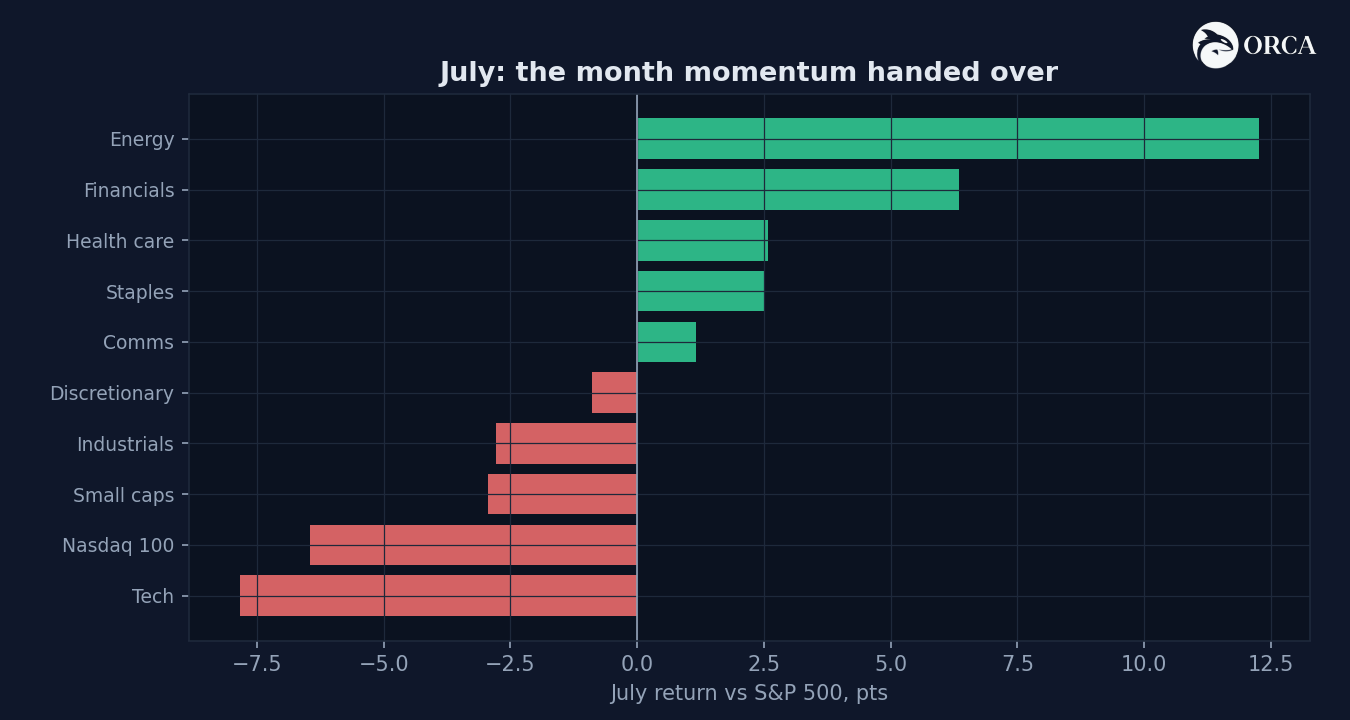
Energy beat the index by 12 points in a single month. Financials by 6.3. Health care and staples by 2.5. On the other side, tech lost 7.8 points to the index and the Nasdaq 100 lost 6.4 - the worst month for the momentum complex since the April tariff episode. Small caps gave up 3 points. The AI leadership that carried the first half of the year spent July being sold to fund energy, banks and medicine.
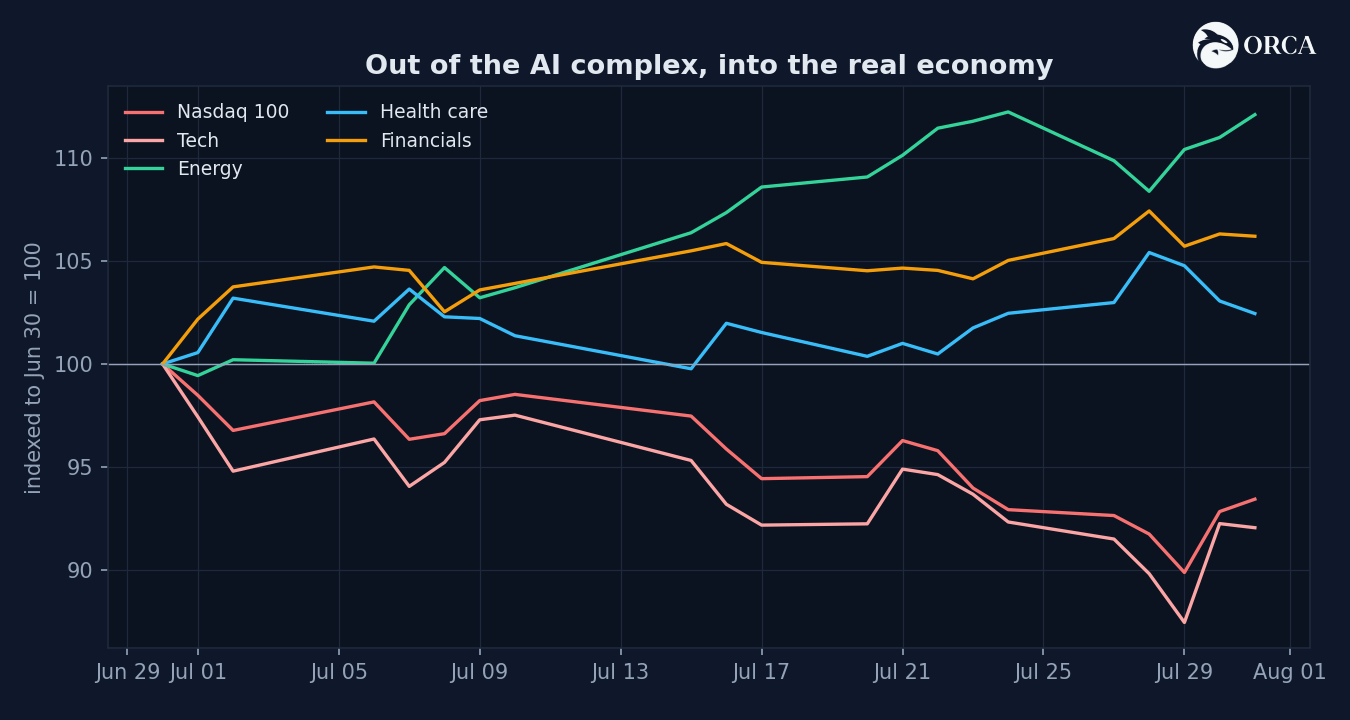
Three things about this rotation worth saying carefully.
First, it has a macro logic, and the Dashboard called the direction. The regime playbook’s Quad 2 leadership is energy, financials, materials and industrials, and its stagflation-leaning tilt adds staples and health care. July delivered almost exactly that list, in almost exactly that order, while oil rose 24% on the month and the curve priced a hiking Fed. This was the market repricing which earnings streams survive a 4.7% 10Y and $87 oil, and the answer was: the ones attached to the real economy, not the ones trading at the highest multiples.
Second, the Dashboard’s book rotated with it in real time. The financials signal fired July 28th at a 71% hit rate, industrials the same day at 72-73%, staples clustered through the week. The whole top of the current firing list is the new leadership. The oil position from July 7th, which paid +25% at its peak, remains the trade of the month even after oil’s $92-to-$79-to-$87 whipsaw through the ceasefire headlines.
Third, the week ended with a warning against chasing it. Discretionary, the most-sold sector of the month, bounced 6.1% this week; communications rallied 1.8%; tech went flat instead of down. One week doesn’t reverse a rotation, and both XLY and XLC are still below their 200-days, so the burden of proof sits with the bounce. But rotations this fast usually breathe, and adding to July’s winners on August 1st is how you buy energy at the top of its month.
The analogs sharpen the picture. I re-ran the Dashboard’s analog matching on the post-FOMC vector, and the neighborhood moved: the March 2021 reflation-peak match that haunted the book for three weeks dropped out for now (see chart below). The closest company now is May 2006 by similarity and late 2004 by distance - the mid-2000s cluster, a Fed tightening into a real-economy expansion, equities grinding higher with value and energy leading and the index chopping through hiking scares. That cohort’s six-month forward returns were positive but unspectacular, and the toll was rotation, not drawdown. The tail in the list is June 2007, fourth by similarity, same as it ever was - and the thing that separated 2005 from 2007 was credit, which is why HY spreads at 281bp on Monday’s print (the widest since April, on a lagged FRED read, with HYG recovering through the meeting) stay at the top of the watch items into August.
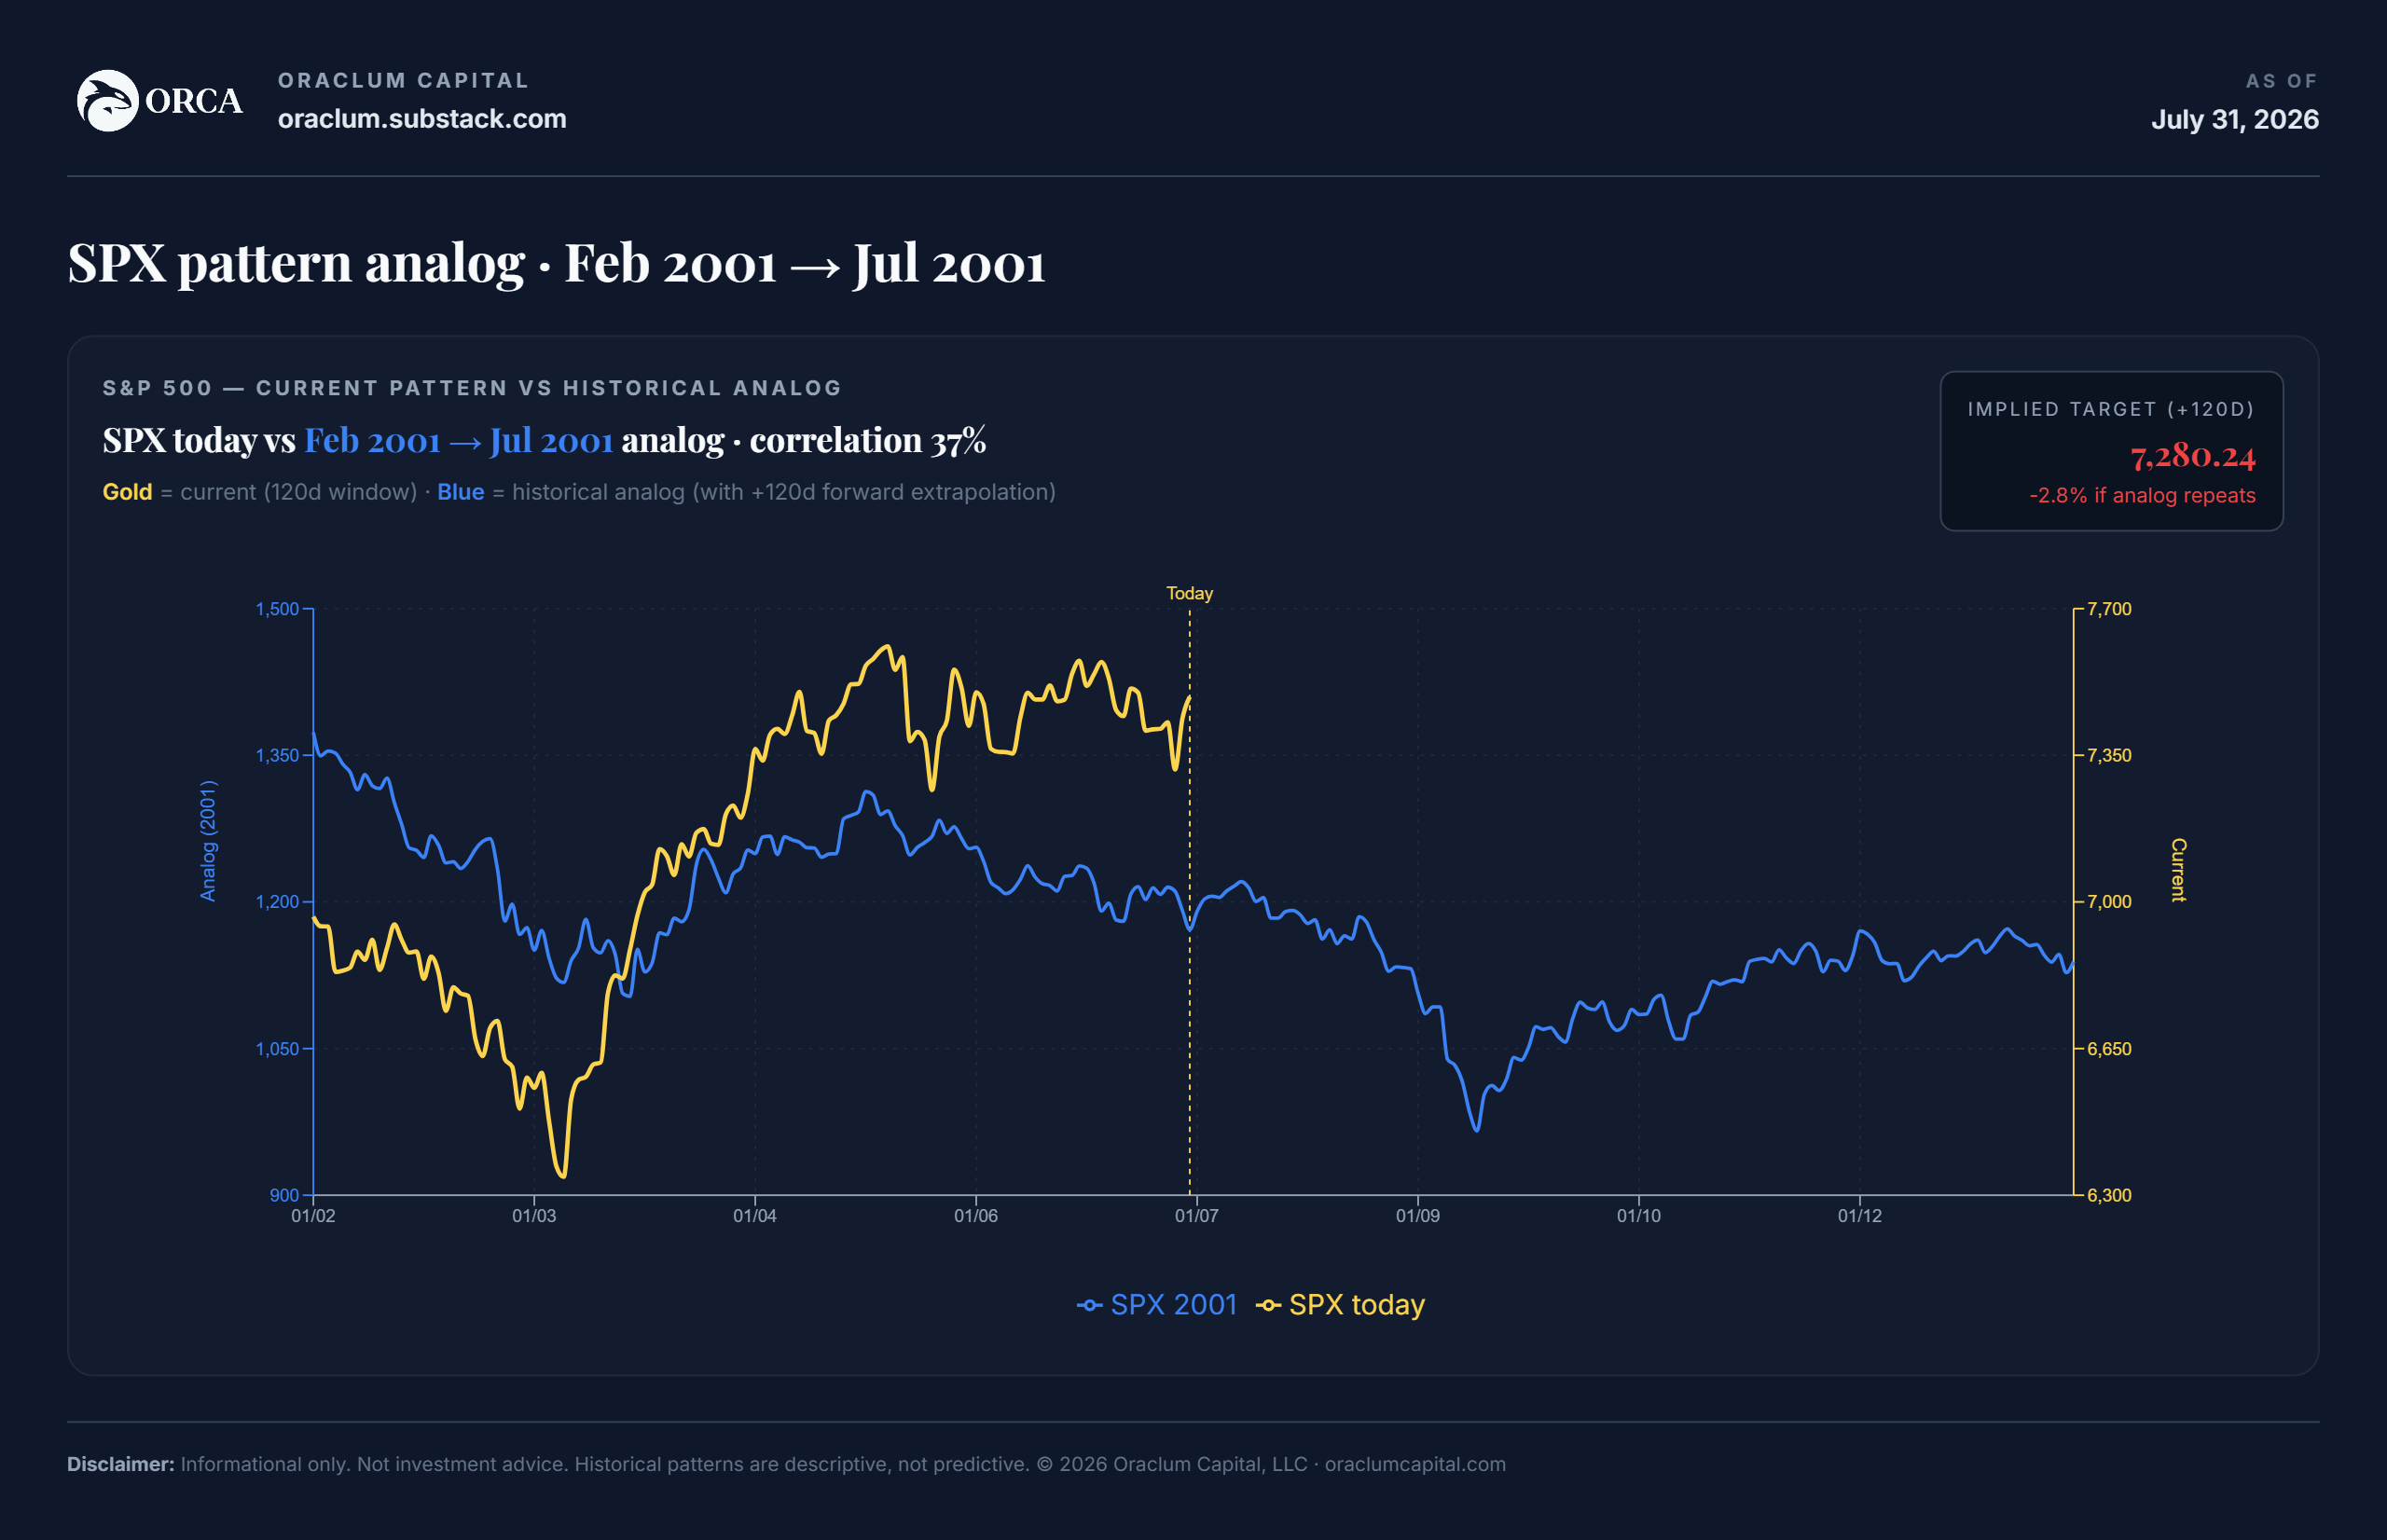
The regime answer keeps the book in Quad 2 shape with a short leash: financials, industrials, staples per the fresh signals, energy held rather than added after its 12-point month, tech and discretionary at benchmark while they’re below trend but bouncing. The bond answer keeps duration light - a 77% September with a bear-steepening curve is not the setup to buy TLT into - and keeps the 2Y-at-4.26 line as the tell that changes it. The rotation answer is patience: July’s move was the position, August is for letting it consolidate, and the two prints that decide September (payrolls on the 7th, CPI on the 12th) are the next dates that matter. Jackson Hole closes the month, where Warsh gets to explain a reaction function he has so far only demonstrated.
The classifier spent six days in stagflation and came back. The market spent a month rotating as if it means to go there properly. Between those two facts is where August gets decided.
Thanks for reading! And thanks for subscribing to the newsletter.
Don’t miss next week’s long read on monetarism!
DISCLAIMER: Neither the survey nor any of the contents of this website can act as investment advice of any kind. The results of the survey need not correspond to actual market preferences or trends, so they should be interpreted with caution. Oraclum Capital, LLC (Henceforth ORCA) is a management company responsible for running the ORCA BASON Fund, LP, and for organizing a survey competition each week, where it invites the subscribers to its newsletter (this website) to participate in an ongoing prediction competition. The information presented on this website and through the survey competition should under no circumstances be used to solicit any investment advice, nor is it allowed to be of commercial use to any of its readers. The survey and this website contain no information that a user may use as financial or investment advice. All rights reserved. Oraclum Capital LLC.
Comments
Nothing yet. Say the first thing.
Sign in to join the conversation.