
Happy Sunday! This article describes several of my current positions and my current trade ideas for tomorrow, Monday, March 9th. This is not advice.
Two quick call outs:
Bitcoin went under 67k as I predicted to a low between 50-65k as I secondarily predicted, to a March bounce as I thirdly predicted. This:
Significantly validates my read on the crypto market, which includes my core theses for current trade ideas, so I’m able to go after these ideas with higher conviction than many of my other trades. I’ll be planning to use more leverage and more of my account than normal.
Makes me feel awesome and it means u should subscribe and tell everyone else to subscribe so no one misses out on my analysis lol
The world is going to end in June.
At least, for the purpose of these trade ideas. My current setup and next moves are highly specified to current market context.
Some notable elements of the current context include:
QQQ has averaged under 1% increase per month over the past 6 months. It’s unusually slow and has investors anxious.
We are in a midterm year.
We are at the end of a four year bitcoin cycle.
Warsh is set to take office as the Chair of the Federal Reserve in May 2026.
The US effectively started a new war by conducting Operation Epic Fury on Feb 28, within the past two weeks.
13.5k in Coinbase holding short perps on bitcoin, ethereum, solana, and xrp.
The ratio is roughly 1:1 bitcoin to altcoins. I limit to these highly liquid altcoins.
The purpose is to reduce idiosyncratic risk on each coin and also to increase return because I expect, as Ben Cowen has argued very well, for altcoins to continue to bleed into bitcoin even as crypto in general bleeds to stocks and the market generally moves down the risk curve due to geopolitical risk and recessionary fears.
I’m getting an effective leverage of only about 3X on these perps due to overnight requirements, higher margin requirements for lower vol assets like solana and xrp, plus my unwillingness to tune leverage intraday. I can access up to 10X leverage on bitcoin specifically intraday, but I’m not interested in doing that in general. My crypto short is a macro concept that could land between now and May, not something targeted intraday.
By omitting to exercise the full possible leverage I can access, I do have a bit of an opportunistic lever that I can pull if I want to, which is nice because perps are also tradeable outside the normal market hours. Finally, omitting to exercise full leverage obviously reduces my risk and makes it very hard for my account to get liquidated. I think bitcoin would need to suddenly reverse up over $100k within a day for this account to be forcibly liquidated.
44k in Schwab + Thinkorswim
About half of this is in leveraged crypto bear ETFs (ETHD and SBIT) and about half is in short futures (MBT and MET).
The account is 90% deployed, or only 10% in cash, which is rare for me. This is partly because I’m highly confident of continued decline in crypto prices and also partly because these assets do not experience theta decay and have relatively low leverage under 3x so I’m prepared to simply hold under a reversal. See the later section on Major Crypto Invalidation Handling.
Futures access is nice for opportunistic premarket trading, but I don’t consider it super useful for leverage.
1k in Composer, where I test various algorithms.
So far I have found several successful bull market algorithms, so I don’t have much cash here.
I recently backtested an exception which decides a bull or bear regime based on 90 day cumulative return exceeding a threshold (between which we might characterize a market as sideways and prefer BIL for low risk return). I’ll deploy a few hundred dollars on Monday and may scale up later when short term trades complete. See the next section for details on those upcoming trades.
3.8k in Robinhood
I have $3k in the SBIT / ETHD split previously described.
I have about $500 allocated to Nancy Pelosi copy trading through the Autopilot app which I use as a kind of benchmark. It’s up 1% YTD.
I have a few hundred dollars scattered around tiny fractional buys of many assets that interest me as really just a way to build a dashboard of interesting assets. I could probably do this for free if I spent time and effort on it
3.4k in Interactive Brokers.
I originally deposited 3k for automated trading here and the automations went very poorly with QuantConnect, so I cancelled QuantConnect and manually placed the 3k into the SBIT / ETHD ETF split described for Schwab above.
I’ll hold this here until I’m ready to fade the crypto short play then I will potentially use a small amount for automation experiments, time permitting me to develop them, or I will evacuate this cash at that time. Likely a bit of both.
Here are my core hypotheses:
Bitcoin is likely to decrease in price this coming week.
Based on prior midterm year and prior cycle analysis, the price is highly likely to mostly retrace it’s recent surge from its YTD low of about 60k on Feb 5th to it’s subsequent local high of 74k on March 4th.
Alternatively and more conservatively you could take the YTD daily close low which was also Feb 5th but it was about 63k rather than the intraday low of 60k.
This makes my most conservative price target 74+63 = 137/2 = 68.5, but we’re already below this. My next most highly confident and conservative target is 74+60=134/2 = 67k.
See the Finding the Local Low section for additional lower levels including 66, 63, 60, and 51. I have planned percentage exits at each of these markers and I plan to be 90%+ exited if and when 51k hits, potentially using 5-10% for a long shot tail trade or even a bullish mean regression or accumulation trade, as I am bullish on the odds of bitcoin returning to six figures next year or the year after.
Bitcoin is likely to have a lower price in October than today, though the path from here to there is likely to contain several significant temporary reversals.
Through October, altcoins will continue to bleed to bitcoin.
Most investors are underestimating the impact of recently military action on the market, particularly with respect to oil prices, metal prices, general recession risk, and possibly general energy prices.
Based on those hypotheses, here are the seven moves I have top of mind:
10 week deep in the money puts on IBIT, in order to achieve ~5x+ leverage and mitigated theta decay compared to shorter term put strategies.
Borrowing on margin to buy more SBIT / ETHD. If I buy 2x of those securities, I’m getting close to 4x leverage at the cost of margin, which is 5-15% APR on Robinhood and Schwab if I recall correctly. That’s a tax I’m highly willing to pay in exchange to avoid theta decay and other complexities and mental stress of options and futures.
Getting out of crypto futures once the trading day starts and rotating in to (1) or (2) with that free cash in order to gain higher leverage, if the selloff continues. Otherwise, just hold the cash as a buffer or opportunistic trade tool.
Going long on oil via options or futures. In particular, I’ll watch oil futures in the premarket so that I can validate that the increase in price is a continued trend. I won’t jump in unless that trend continues, and I can triangulate a strong price target distribution based on polymarket data.
Going long on gold and silver. Similar recession and geopolitical risk play compared to oil.
Going long on LHX. I genuinely have no idea what this asset is, so this could be a terrible idea, but it has proven consistently robust in our otherwise sideways bearish context since October of last year and it is part of my Nancy Pelosi copy trading already, which is how I became aware of it.
I’ll push up my perp leverage on Coinbase temporarily if crypto seems to be moving quickly.
I might choose to go for far-duration options on this too in part because if I get 3-5 such far-out options, I feel that I gain a diversification advantage, though I don’t have a good grasp of the magnitude of this advantage, so I might choose small sizes and effectively create a test trade so that I can measure how these options move together over the coming week or so.
I’ll take the gamble on options if the trend looks strong in the half hour after the opening bell on Monday. If trends look mixed, I’ll skip trading those items and pay with time and analytical effort rather than dollars to try to measure the diversification benefit.
Follow the Substack as future articles will explain more deeply why I use certain kinds of leverage in different situations.
Yahoo bitcoin price data goes back to 2014, with 2015 as the first complete year including February data. Consider four low indicators:
February midpoint price: The average of the Feb high and low. All years except 2024 retraced below the Feb mid price in March. 2024 took 6 months to do so.
LowerMid_95pct: 5% lower than the Feb midpoint price.
HigherLow: 5% higher than the Feb low price.
NewLow: Less than the Feb low price
In the table below I calculate the number of months until such a watermark was encountered. For example, if March set an intraday low which was lower than February’s intraday low, MonthsToNewLow takes a value of 1. If such a month is never encountered through the remainder of the year, the column takes a value of -1.
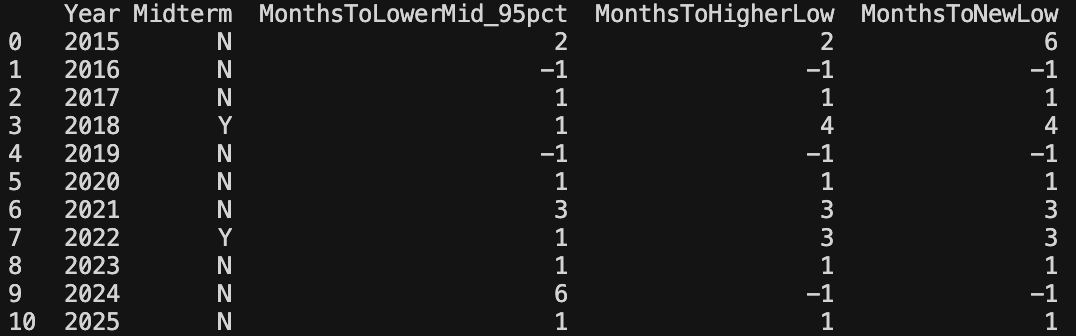
Notes:
2020 was COVID, so it may not be comparable. Additionally, it was a hyperbearish year, so excluding it makes our analysis more conservative, in the sense that we are running a short strategy so rapid bearish watermarks is optimistic for our short strategy.
2026 is a midterm year, so 2018 and 2022 may be the closest comparables.
We have already crossed the midpoint price, so 2024 seems non-comparable
Midterm years always set new lower lows, 3 or 4 months after February. Assuming such a result seems optimistic and nonconservative.
Conservatively, we consider all years except 2020 as comparable.
1/3 of comparable cases see March as having a new lower low compared to Feb. This is a significant scenario, so my minimum price target will support it.
1/3 of comparable cases never achieve LowerMid_95pct, and these sad scenarios can be detected by the failure to achieve LowerMid_95pct by month 3, which is May.
Feb 2026 High and Low are 79,322.61 and 60,074.20 respectively, so key levels would be:
~66,200 for LowerMid_95pct
~63,100 for HigherLow
~$60,000 for NewLow. This wouldn’t form a bottom estimate, but it would form a cap to the bottom estimate once passed.
$60k low in Feb from ~124k high in October is about 50% reduction in 5 months, which can form a nice projection boundary of a 10% decrease per month. This seems implausible because it implies a low of 67*(.9^8) → 28.8k in October. So, by invalidation ad absurdum, we shouldn’t expect sustained 10% drawdown per month going forward.
Zheng says “We expect a further 30% price drop during 2026 as the Iran war started.” He doesn’t specify the anchor for the drop, but conservatively this would be 73k, the high of the past month, putting the low at 51k.
Standard Chartered “expects Bitcoin to fall toward $50,000 in the coming months, with Ether potentially bottoming near $1,400.”
Peter Brandt expects a price in the range of 54k-58k and thankfully put a timeline on this, specifying his prediction would be for the Aug-Oct timeframe “then straight up”
Ali Martinez mentioned a long option concentrated liquidation point at a bitcoin price of $54k, which Grok tells me functions as a magnet or air pocket rather than a resistance band and that it “often reverses post-clear,” seeding a possible bounce trade idea. While 54k is peak concentration, the concentration band seems to continue to about 50k and then dissipate.
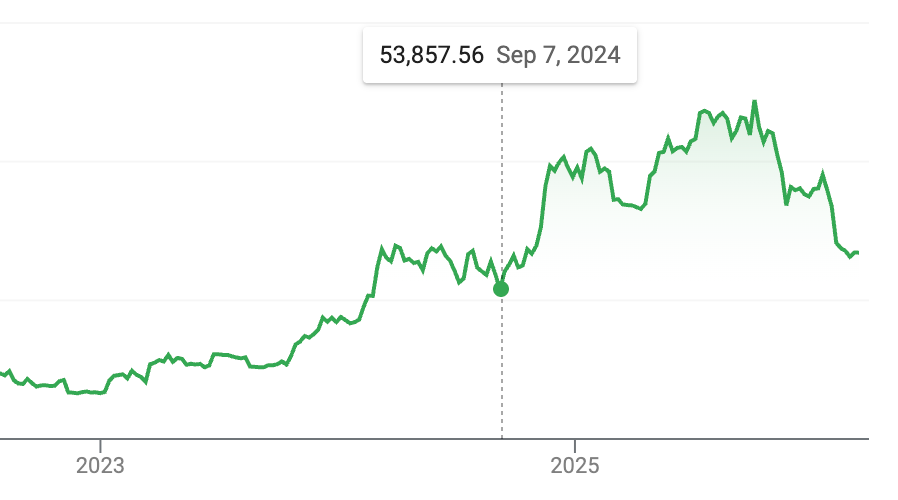
As in the image below, 54k is also a strong line because it was a key low in 2024. A couple months prior, 56k also formed a notable bottom and bounce.
Overall, 50k seems like a reasonable bottom target for the year. 50-55k seems like major resistance, so even if you get a dip below, it would be rough to trade. 50k seems reasonable, but 57k seems nicely conservative, lower risk, and potentially lower stress because it is not a know resistance or bounce level, so one could exit before hitting resistance and then worrying about trade timing.
Alternatively, you could go for 52k with a preset trade, so you aren’t having to watch your account, that can reduce stress, and you gain some incremental possible return, but you would also be accepting incremental risk that we might not actually hit 52k.
From my current vantage point, 52k sometime this year seems possible, but I don’t yet see a good case for calling it probable. 57k does look probable to me, though I don’t expect that in March due to our 10% drawdown cap earlier discussed by invalidation ad absurdum. It might be broached in some unsustainable way, and that could indicate a good time to exit, play a reversion or just wait it out, then re-enter, since we do expect more sustained drawdown through August to October, but the path between is very unclear to me at the moment.
If the trend in bitcoin reverses on Monday in the market or premarket, I’ll withhold buying options. If the price breaks up over 69k, I’ll clear out my perps and futures but maintain my etfs for now and hold some additional cash to deploy later. I have no intent of riding the 72k-80k air pocket. I can hold those ETFs while I calculate a new plan, no need to panic sell them.
No posts
Comments
Nothing yet. Say the first thing.
Sign in to join the conversation.