
May 2026 was the month the market tested every thesis at once and came out the other side still standing. After the stagflation anxiety that built through the first fortnight, a strong NVIDIA print, a sharp reversal in oil, and a softer-than-feared core inflation reading combined to flip the tape risk-on into month-end. The S&P 500 held its post-April highs, technology reasserted leadership on the back of the artificial intelligence capital expenditure reaffirmation, and the relief rally that began in April extended rather than reversed.
China equities again delivered standout regional performance as relative insulation from the Iran conflict combined with stimulative domestic policy to attract continued foreign flows.
WTI crude was volatile throughout, spiking towards $110 on fresh strikes around the Strait of Hormuz before collapsing towards $91 as the Trump administration signalled a potential de-escalation that has yet to be signed.
Core PCE for April printed at 3.8% headline, the highest since May 2023, while the core measure rose only 0.2% on the month, neither confirming disinflation nor breaking the stagflation case ahead of an uncertain summer.
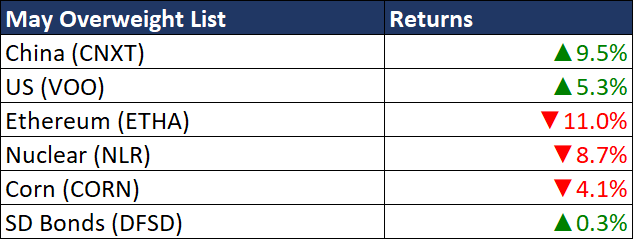
My May allocations were shaped by wide dispersion. China equities led at 9.5%, confirming the structural thesis that Chinese assets benefit from Iran conflict insulation and stimulative domestic policy. US equities added 5.3%, carried in the second half of the month by the reaffirmation of the AI capital expenditure cycle and the relief that followed the softer core inflation print. Short-duration bonds contributed 0.3%, providing the carry and stability that allowed the rest of the book to work.
The detractors were concentrated. Ethereum fell 11.0% as the digital asset complex gave back earlier strength on the mid-month rise in real yields. Nuclear declined 8.7% in sympathy with the broader pullback in the power and infrastructure theme. Corn eased 4.1% as the Iran conflict seemingly eased.
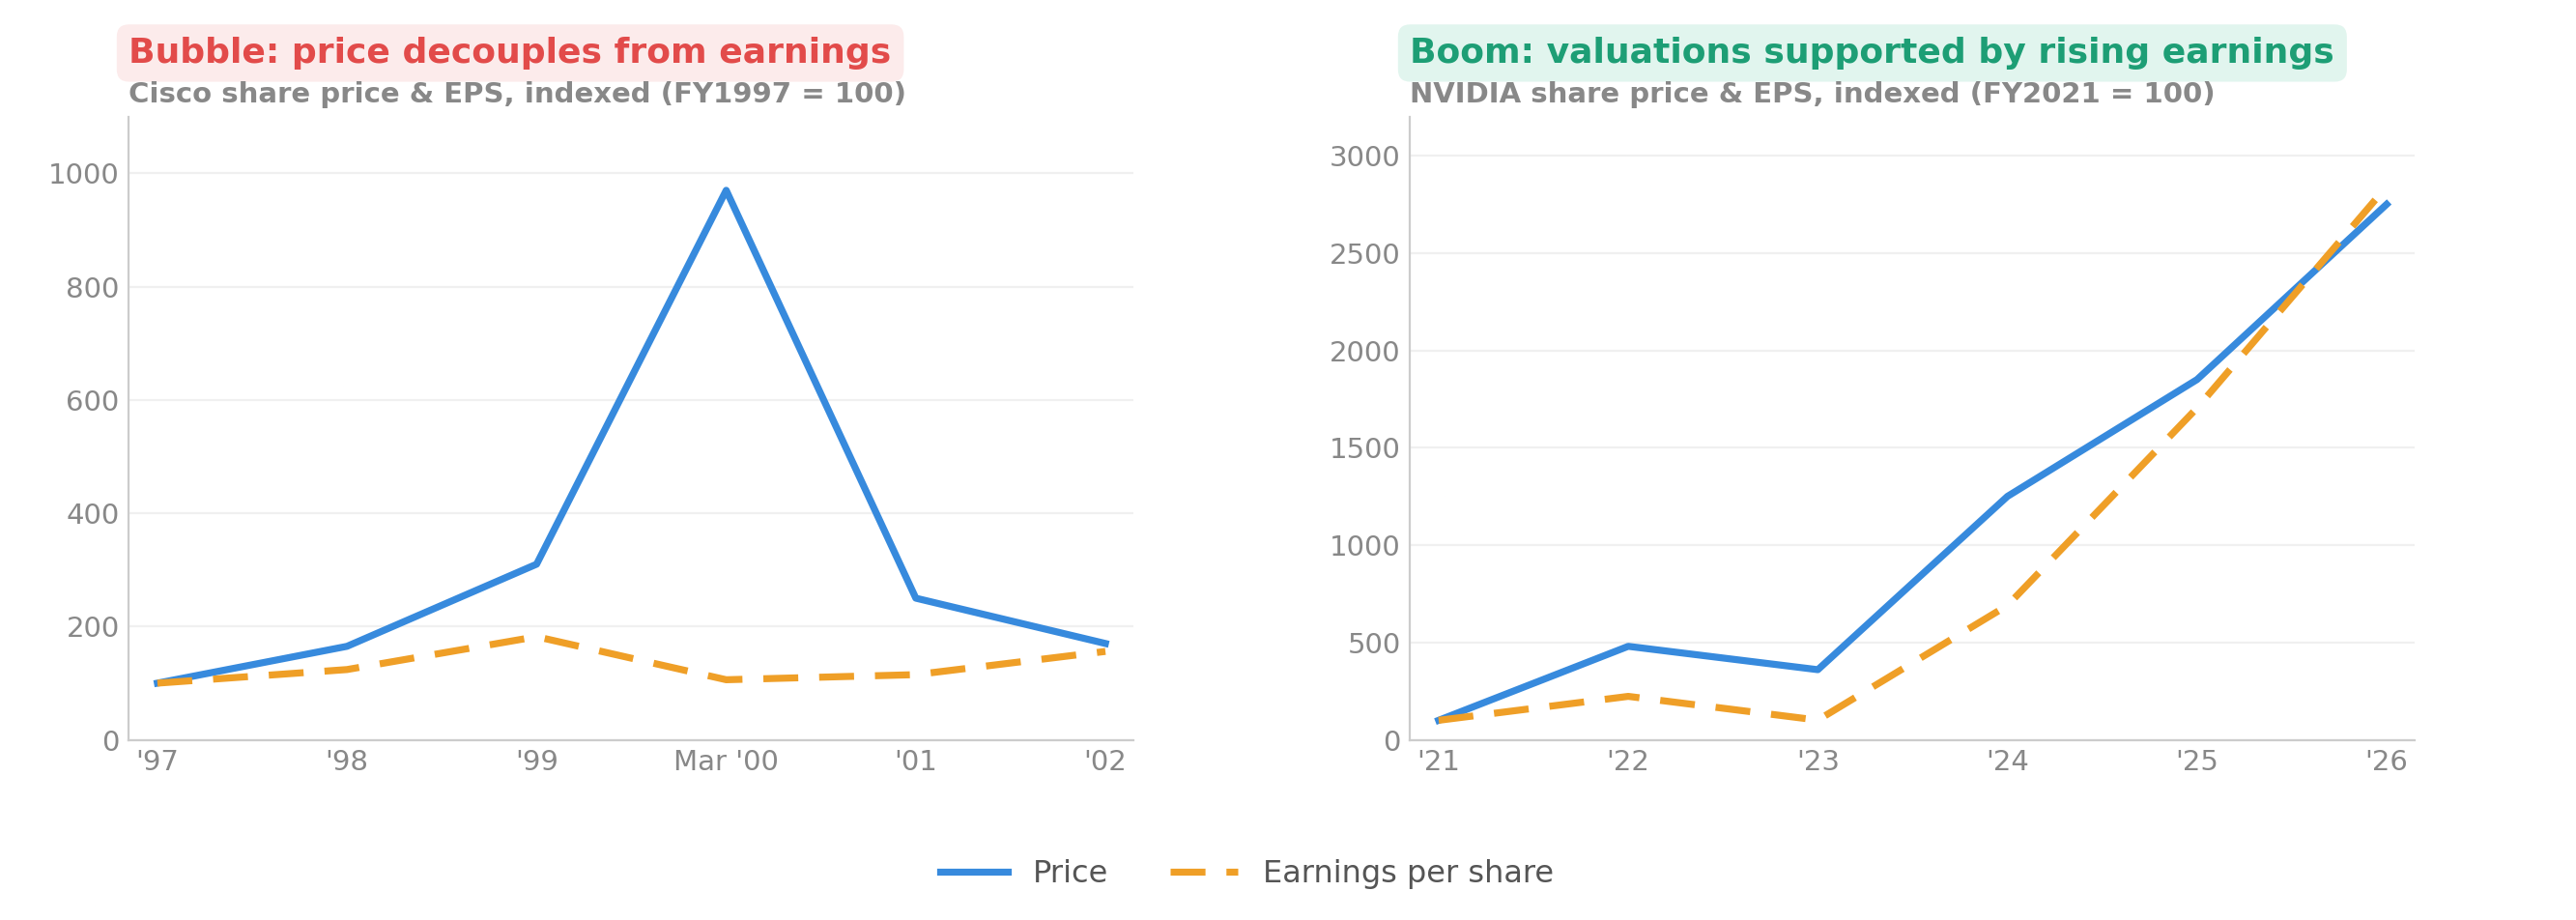
Sources: Cisco 8-K / 10-K filings (GAAP diluted EPS, split-adjusted; price split-adjusted, peak $80.06 on 27 Mar 2000). NVIDIA 8-K filings and FY2026 newsroom release (GAAP diluted EPS, split-adjusted for 4:1 July 2021 and 10:1 June 2024).
The chart above contrasts the dot-com bubble in Cisco with the current boom in Nvidia, and the distinction is the whole point. A bubble is built on belief, where price decouples from earnings and eventually reconnects violently, as Cisco did when it fell nearly 90% from its March 2000 peak on flat fundamentals. A boom is built on earnings, where price and profit compound together, as Nvidia has done across the current cycle with earnings per share rising in step with the share price. The melt-up is real because the earnings are real. That does not make it permanent.
The risk I am watching most closely for the second half is supply, not of oil but of equity. A wave of mega-capitalisation private companies is approaching public markets. The prospective listings of SpaceX, Anthropic, and OpenAI represent the largest concentration of new equity supply the technology sector has seen in a generation. When supply of that scale arrives, it draws liquidity from the incumbents that have led the melt-up, as institutional capital rotates out of existing high-flyers to fund the new issues. That dynamic, more than any single macro catalyst, is the mechanism by which a genuine boom can still produce a sharp correction or a bear market. The earnings being real does not protect the price when the marginal dollar has somewhere new to go.
Ray Dalio’s Changing World Order
We are watching Dalio’s thesis play out in real time. America, the world’s current superpower, is at war, overstretching its finances, and facing domestic infighting and instability through the No Kings protests. This is textbook late-cycle behaviour for a declining empire. It doesn’t mean collapse is imminent, but it reinforces why diversification away from US assets and into real assets, emerging markets, and commodities remains the structural play.
Howard Marks’ Pendulum
Sentiment swung from extreme bearishness in March to extreme bullishness through April and May, with the S&P closing at all-time highs and the BofA indicator at 8.5 out of 10. The pendulum is back at the optimistic extreme. That is usually when the asymmetric setups appear on the other side. I am not calling for a crash, but I am taking more chips off the table where the crowd is most positioned, which is concentrated in AI names. The contrarian setups for June are in oversold SaaS companies and commodities where speculative positioning is offside, not in the names everyone is chasing.
Peter Lynch’s PEG Bands
US trailing P/E sits at 26.7x, around 2.3 standard deviations above the 10-year mean. That is closing in on extreme. China is at 9.5x, more than a full standard deviation below its 10-year mean and still the cheapest major market in the world. The valuation read continues to favour the diversification trade, with US exposure earning its place through earnings momentum rather than valuation, and China earning its place through the opposite.
Elliott Wave
The S&P 500 almost hitting an intraday high of 7,600 for the first time in history confirms the impulse wave structure remains intact. WTI is in a corrective wave that is showing potential of a breakout to the upside. The two charts I am watching most closely are the 10-year Treasury yield, which would break a multi-year corrective pattern if it pushes through 4.70%, and the broad US dollar, where the structure suggests an upward impulse.
The rest of this article covers what I am doing for June. Paid subscribers get the full positioning each month, plus every trade call I take in real time on the private Telegram channel.
Comments
Nothing yet. Say the first thing.
Sign in to join the conversation.