
The reason I like the Chicago Fed National Activity Index (CFNAI) is that it gives a good distillation of a lot of inputs (85) from several different areas across the US economy and has an ~80% correlation with GDP. According to the Chicago Fed, “over the past 20 years the CFNAI has a 95% accuracy rate in predicting recessions with a lag time of 6-18 months (so this indicator tells you AFTER a recession has started). The Index is a weighted average of 85 indicators of growth in national economic activity drawn from four broad categories of data: 1) production and income; 2) employment, unemployment, and hours; 3) personal consumption and housing; and 4) sales, orders, and inventories.”
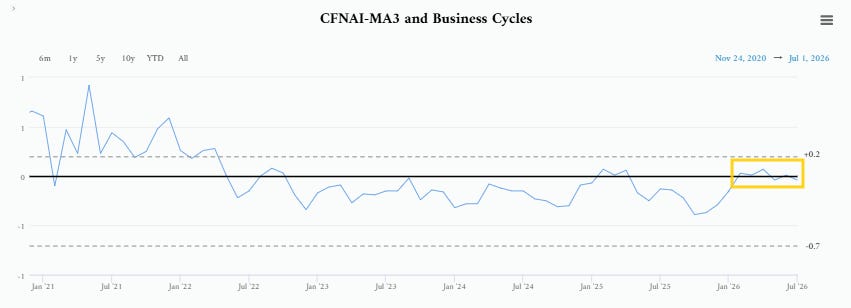
In terms of reading its signals: “Following a period of economic expansion, an increasing likelihood of a recession has historically been associated with a CFNAI-MA3 value below –0.70. Conversely, following a period of economic contraction, an increasing likelihood of an expansion has historically been associated with a CFNAI-MA3 value above –0.70 and a significant likelihood of an expansion has historically been associated with a CFNAI-MA3 value above +0.20.” 0 is a reading of “trend growth”.
US Chicago Fed National Activity Index Jul: -0.08 (est -0.05; prev -0.02; prev R 0.06)
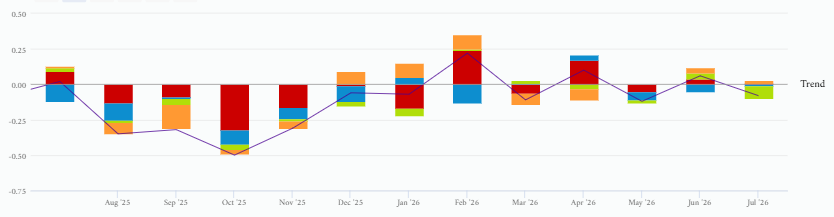
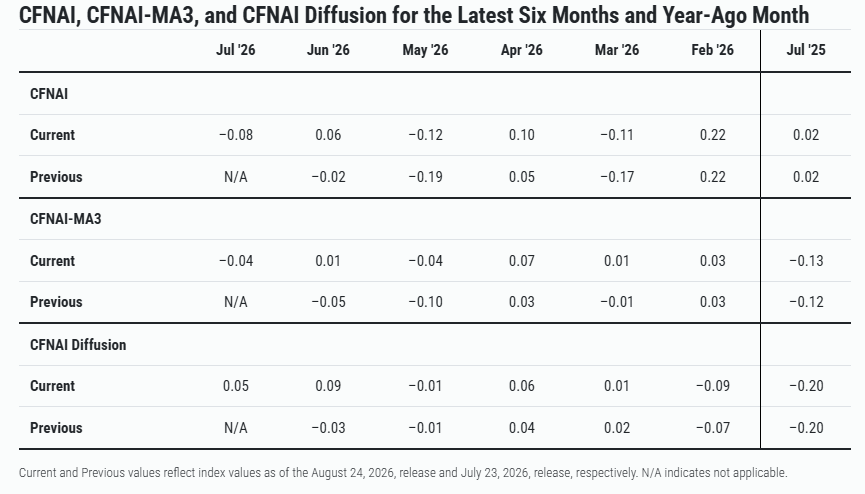
The July CFNAI eased back slightly into negative territory at –0.08, a slight miss vs. the –0.05 expected (from an upwardly-revised +0.06 in June (from –0.02)). Per the introduction, “trend growth” is 0.0.
The 3-month average (this report’s key economic indicator) also edged into mildly negative territory at –0.04 from an upwardly-revised +0.01 in June (originally –0.05), also indicating just below trend growth as it has each month since February, well above its recession signal threshold (below -0.70).
Three of the four broad categories decreased from June, and two made negative contributions in July. Production eased to +0.01 (from an upwardly-revised +0.04 in June), sales/orders/inventories slipped to +0.02 (from an upwardly-revised +0.04 in June), and personal consumption and housing swung sharply into negative territory at –0.09 (from +0.04 in June). The lone improvement was employment, which was less negative at –0.01 (from –0.05 in June). 40 of the 85 indicators made positive contributions, while 45 made negative contributions. 37 indicators improved from June while 48 deteriorated.
The Diffusion Index (also a 3-mth avg and “captures the degree to which a change in the monthly index is spread out among its 85 indicators”) edged down to +0.05 in July from a sharply-upwardly-revised +0.09 in June (originally –0.03), which was the best since October 2022, remaining in positive territory (”periods of economic expansion have historically been associated with values of the Diffusion Index above –0.35”).
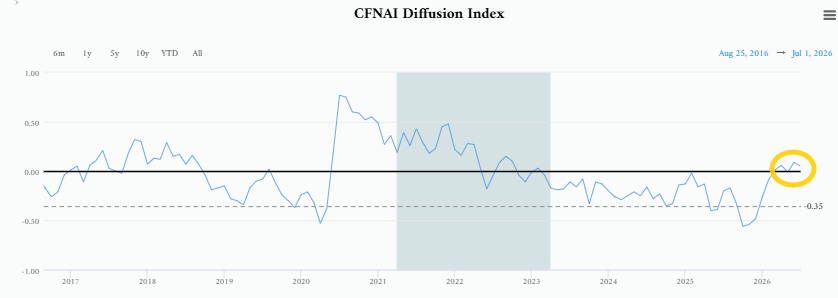
So, overall, the report shows the economy continuing to expand around trend levels in July.
https://www.chicagofed.org/research/data/cfnai/current-data
To subscribe to these summaries, click below.
To invite others to check it out,
No posts
Comments
Nothing yet. Say the first thing.
Sign in to join the conversation.