
Today’s update is about my attempt to bring common sense to London transport, but first a quick update on the crime figures from my last newsletter, which has now been covered in the Standard.
Is Sadiq Khan ‘gaslighting’ Londoners? The capital’s great crime paradox explained
But a few hours earlier, Sir Sadiq had been forced to defend his record on crime in his near-decade as mayor when he was challenged by Neil Garratt, a Tory member of the London Assembly, at mayor’s question time.
Mr Garratt claimed that Sir Sadiq was “cherry-picking statistics and trying to pretend that things are getting better”, despite official statistics appearing to indicate that crimes such as robbery and knife crime were higher than when he succeeded Boris Johnson at City Hall in 2016.
At this week’s Transport Committee, I put a simple question to Transport for London’s senior officials: if there’s less traffic on London’s roads, why is congestion getting worse?
When you strip away the jargon, the answer is surprisingly candid. TfL’s Director of Transport Strategy explained to me that road space has been deliberately taken away from away from general traffic and given to buses and cycles. The result? “The congestion might be higher, but you’re still managing to move many more people through that corridor.”
In other words: yes, your car journey is slower. That’s the policy working as intended.
Watch: I ask, given traffic is down, why is congestion up?
But is it even working? If the plan is to slow cars to make way for buses, are the buses faster? No! They are slower than they’ve ever been. Here’s the London Standard reporting from last month:
How slow is your London bus? Declining bus speeds mapped as citywide average falls below 9mph
Bus operators blame roadworks, cycle lanes, 20mph speed limits and LTNs as passenger numbers continue to plummet.
As bus driver Kevin Stagg told the London Assembly last month, “I have known people who have been in this industry for 20 to 30 years and they’re leaving because they can’t take it no more. Sometimes it is like a car park in London.” He accused TfL of “own goals” by narrowing roads to create more space for pedestrians and cyclists.
This hits our part of London especially hard because without the Tube, swapping out of your car usually means getting the bus. Which is stuck in the same manufactured traffic jam.
So even on its own terms, the plan is failing.
I pointed out what this means in practice: the Mayor points to the congestion. Then he tells us that the answer is more of the same things that created the problem. People nod along because they assume the real problem is too much traffic, but the Mayor should come clean about what’s really going on.
Firstly, that the slow traffic is created on purpose to encourage people to switch out of their car. And secondly, that the plan to get people on the bus is tripping over its own shoelaces, as the buses also crawl along. You would think that the brightest minds in transport strategy could work this out themselves.
This whole plan is just gumming up London, so a complete rethink is needed. Starting with the idea that the transport system’s job is to move people around quickly and efficiently. It’s not to socially engineer people’s lifestyles according to fashionable opinion.
Unbelievably, this simple idea is completely missing from the Mayor’s 120 page Transport Strategy. It’s one of those “You had one job!” moments.
I get asked this every time I point out what’s going on. People find it hard to believe, but it’s true. There’s less traffic in London today than before the pandemic. And it’s not just a blip, there’s less traffic in London than 25 years ago. It’s a long term downward trend, especially in central and inner London where traffic levels are well down.
Here’s the official data:
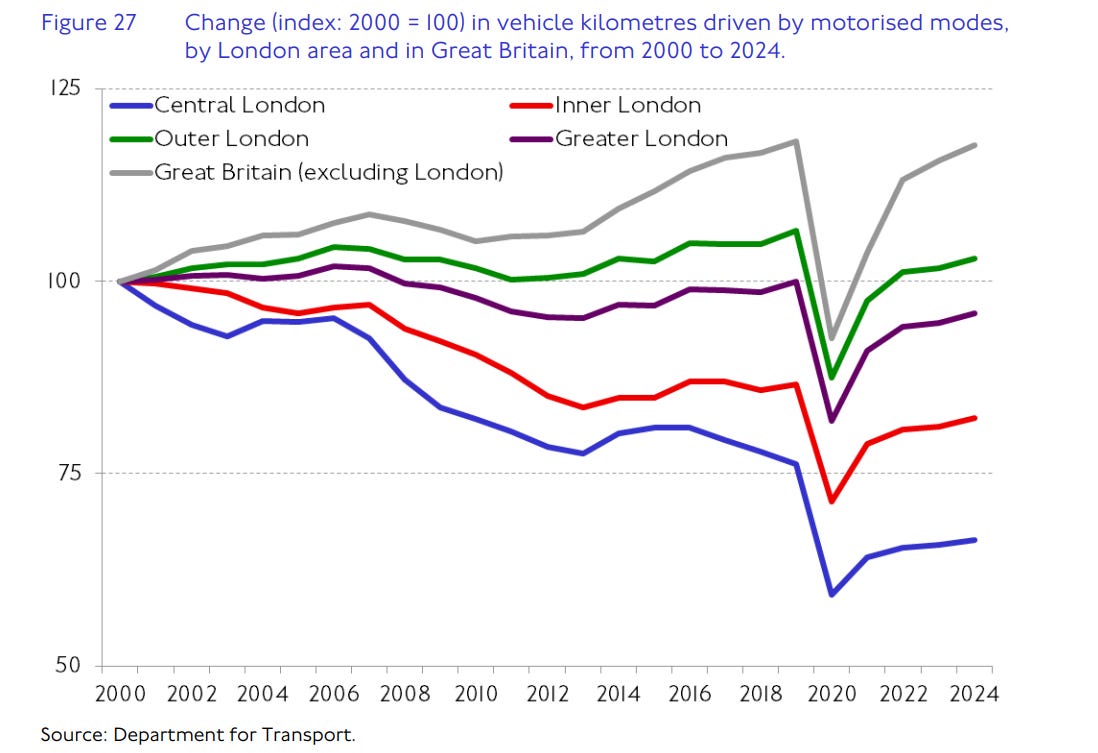
The purple line shows the total traffic levels for all of London. The lines all show how traffic volumes have changed compared with the year 2000, and this covers all motor vehicles. The numbers on the left are effectively “percentage of traffic compared with the year 2000”.
So next time someone complains about all the traffic, you can let them know what’s really going on.
Comments
Nothing yet. Say the first thing.
Sign in to join the conversation.