
Readers,
Welcome back to My Weekly Stock.
Once a month, I step back from weekly trades to assess the bigger picture: where momentum is strengthening, where it’s fading, and what that means for the weeks ahead.
This is my Momentum Deep Dive, powered by my proprietary Momentum Pulse Check tool. I use it to monitor trends and market regimes across key segments, sectors, and individual stocks.
Paid subscribers have full access to my app and can run any top US stock or ETF through it directly.
This month’s deep dive covers two things: the broader momentum landscape across key market segments, and an update on my Macro ETF Portfolio:
Momentum Snapshot
Equities: Strong uptrend across the board, although momentum is slowing down, especially for Nasdaq.
Commodities: Oil back in uptrend but volatile. Precious metals in strong downtrend.
Crypto: Bitcoin and Ethereum in strong downtrend, but attempting a bounce.
Treasuries: in downtrend.
US Dollar: in uptrend.
Macro ETF Portfolio
94% invested across 14 positions. Last month: 1 exit.
Cumulative return: +42% since October 2023
Top performers: Semiconductors ETF ($SMH, +107%) and Emerging Markets ETF ($EEM, +37%).
📌 My Take:
The momentum picture remains cleanly split, with equities still in an uptrend while metals, crypto, and Treasuries remain in downtrends. The equity consolidation that started in June has stretched into July, but the uptrend is holding so far. That said, the marked slowdown of momentum in Nasdaq100 gets me cautious here. I tend to see it as a leading indicator, so I will be keeping a close eye on it in case it signals that this consolidation is morphing into a deeper pullback.
No major changes to my Macro ETF portfolio as a result. I remain overweight equities and continue to look for the next key themes. Metals and crypto are on my watchlist, but my method is to wait for confirmed renewed strength before acting. That may sound late to most, and I will certainly not catch the exact bottom. But I would rather avoid failed breakout attempts and position for the actual strong multi-month trends. Patience is the word, both on what I currently hold and what I am looking to add next.
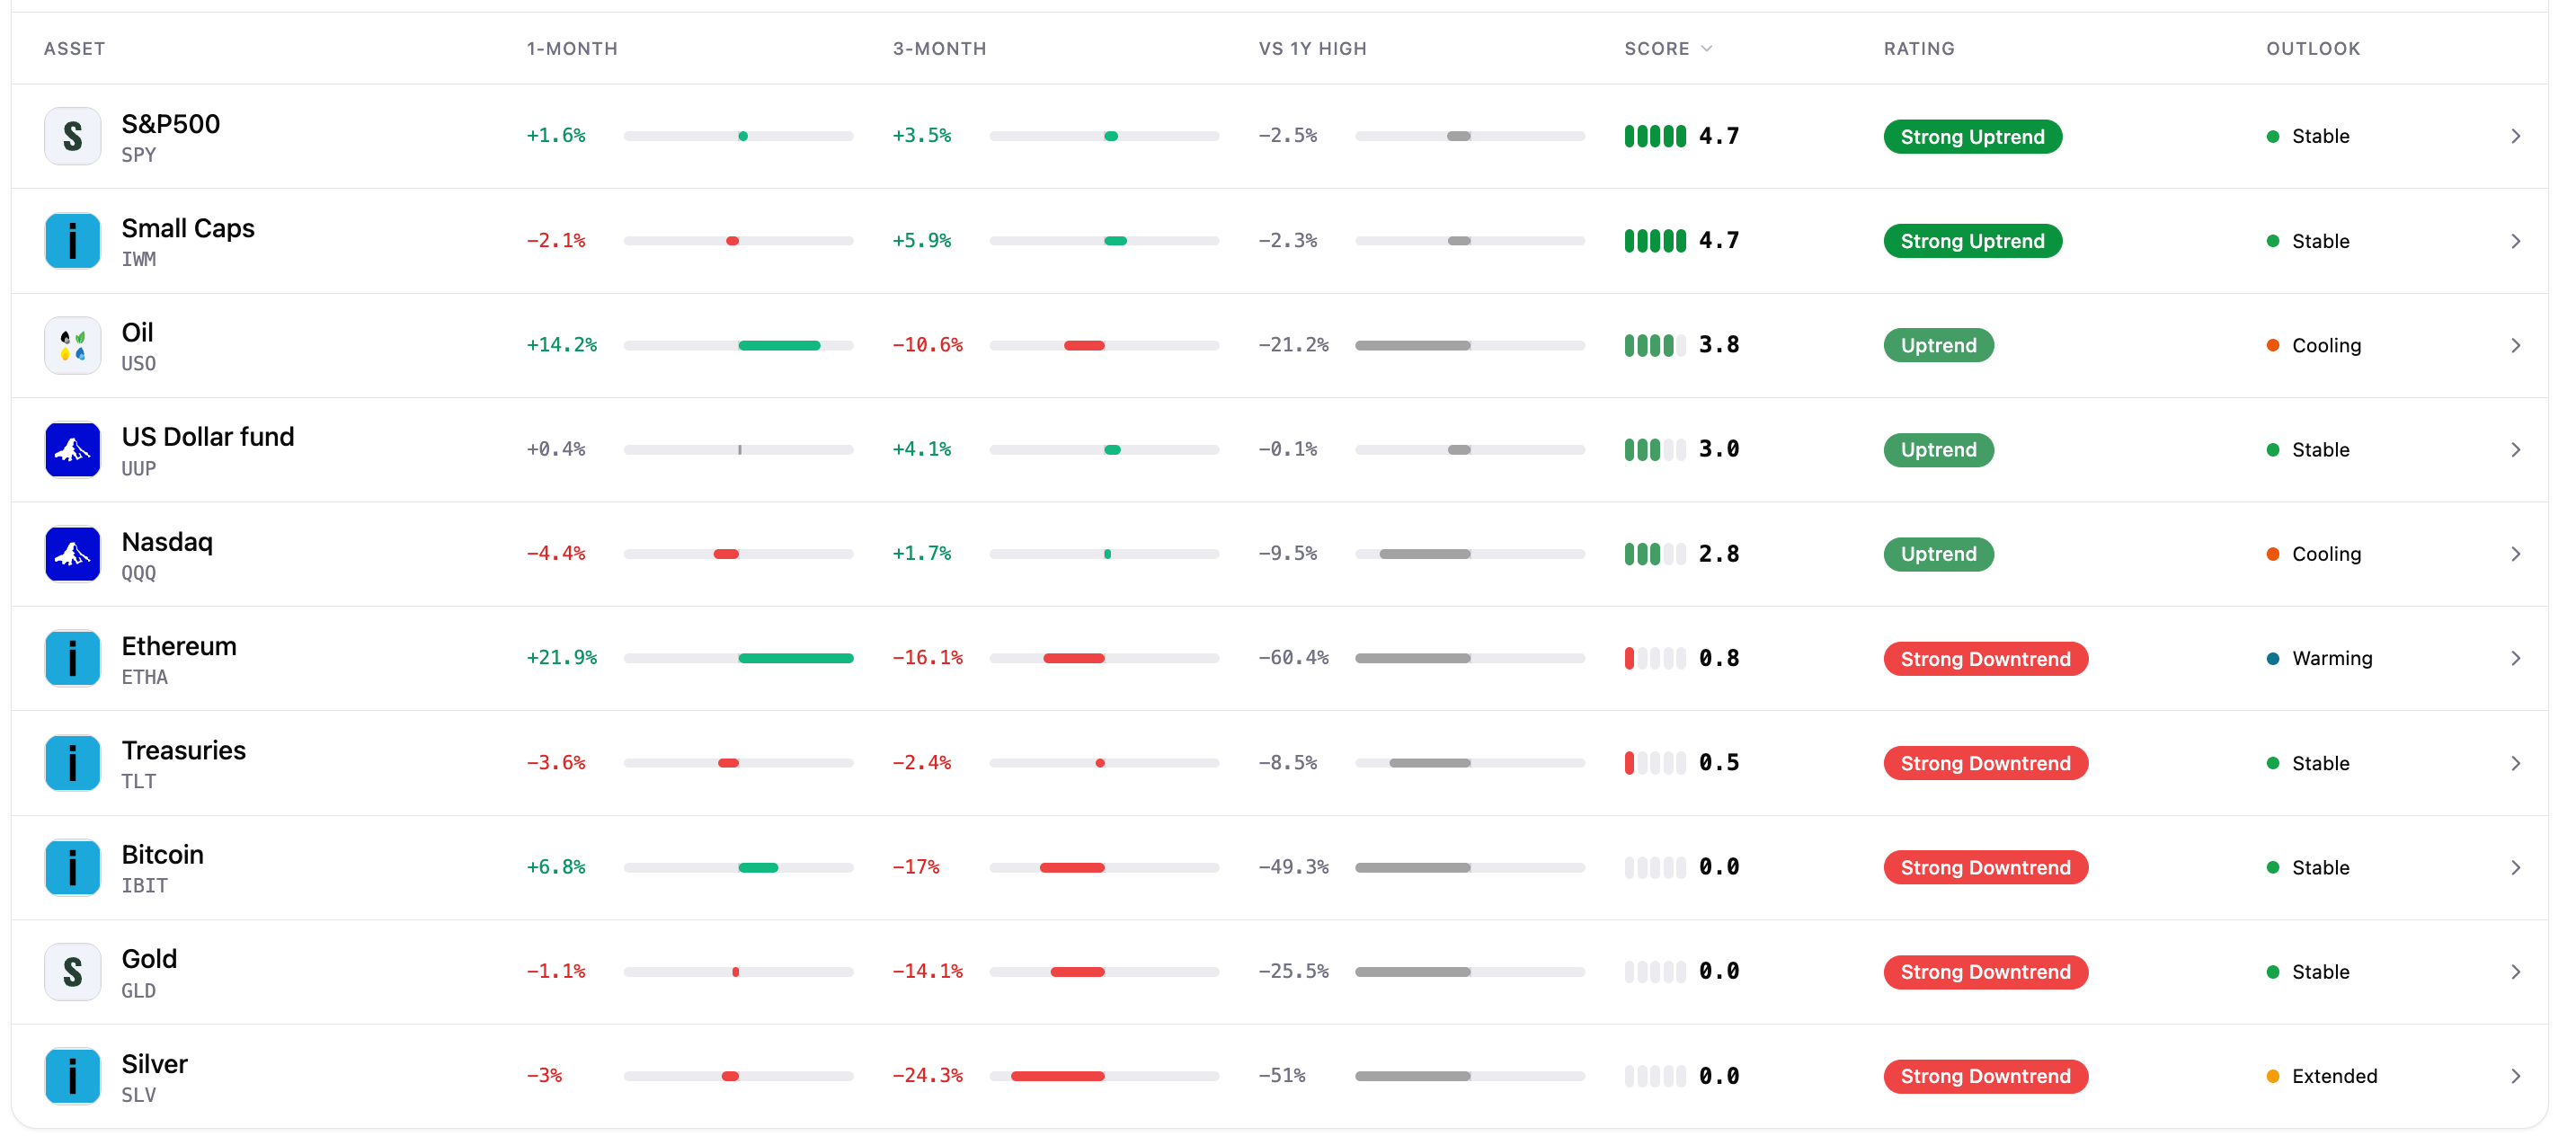

This deep dive is based on a simple, consistent framework. I use weekly charts and exponential moving averages to assess both the strength and quality of trends. From there, I overlay an analysis of key price levels to identify potential areas of support, resistance, or friction ahead.
This combination gives me a holistic view of each segment: not just where price has been, but how healthy the trend is and where it may face pressure.
This framework is designed to do one thing well: separate clean, tradable momentum from noise.
It doesn’t predict markets or aim to catch exact tops or bottoms. Instead, it helps identify where trends are working, where they’re weakening, and where caution is warranted.
Momentum Score: ⭐️⭐️⭐️⭐️⭐️ | Strong Uptrend - Outlook: Stable
Key Levels
Support: $720
Resistance: $770
📌 My Rating: HOLD
Consolidation is stretching into a second month, but the index is still holding above its 9-week EMA. I am closely watching the MACD, which has just registered a bearish crossover, as this consolidation could morph into a deeper pullback toward the 30-week EMA.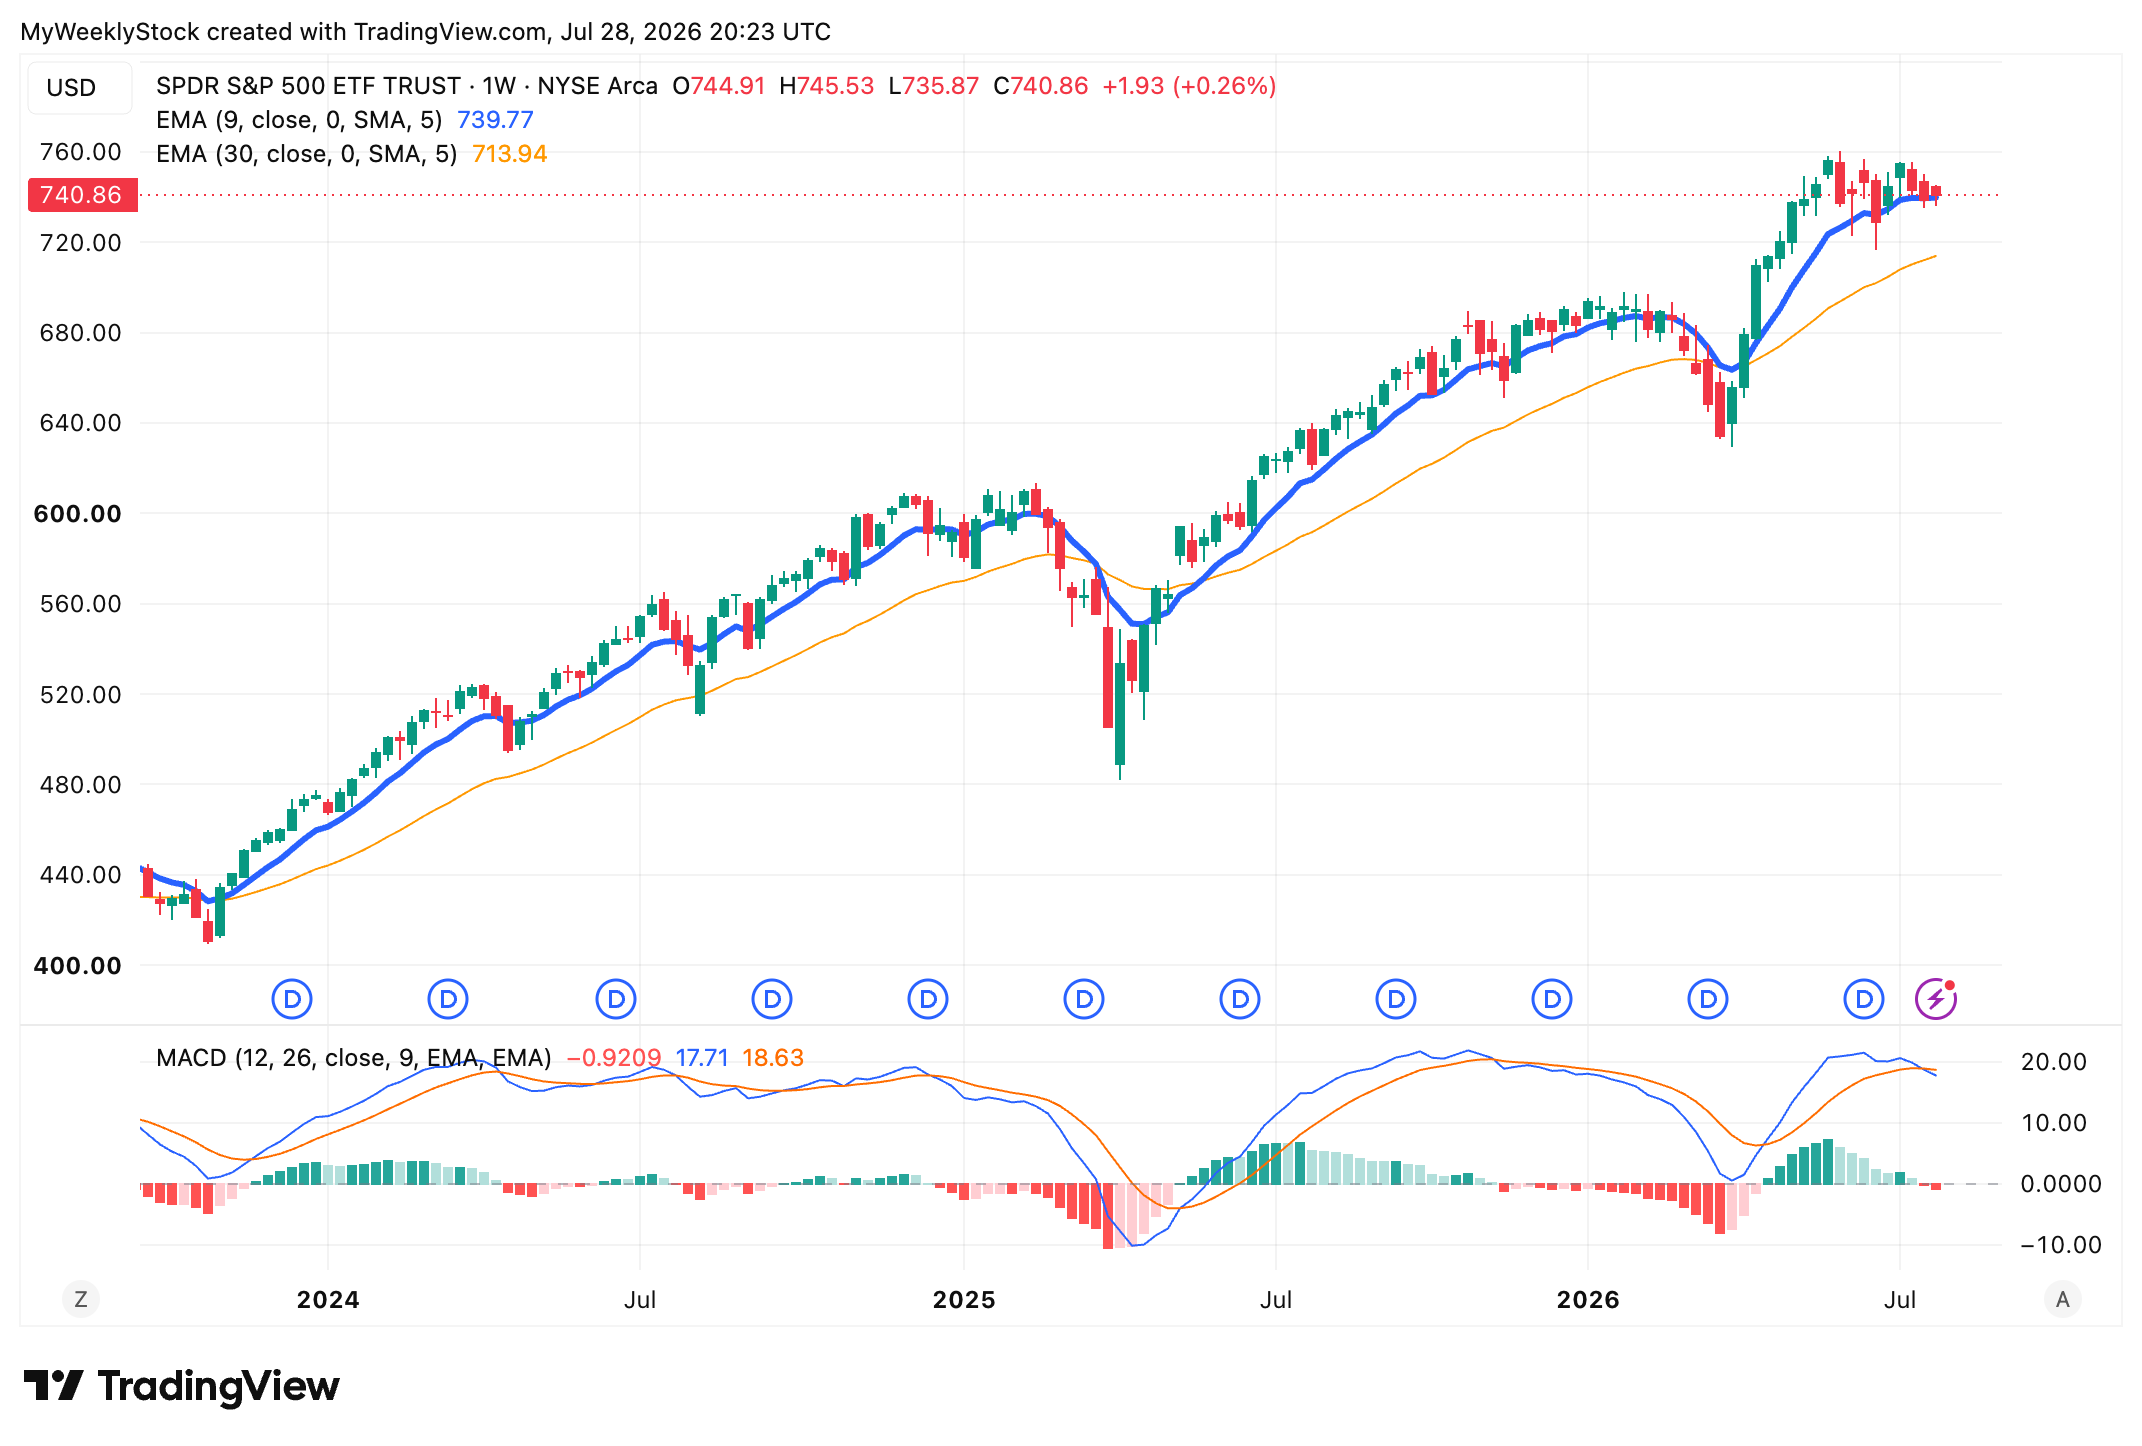
Momentum Score: ⭐️⭐️⭐️☆☆ | Uptrend - Outlook: Cooling
Key Levels
Support: $640
Resistance: $725
📌 My Rating: HOLD
The scenario I outlined for the S&P 500 is essentially what the Nasdaq 100 (QQQ) has already gone through. The pullback was deeper, bringing price all the way down to its 30-week EMA. While the longer-term uptrend remains intact, I'd ideally like to see QQQ hold above both this long-term trendline, then build a range from there before attempting its next leg higher.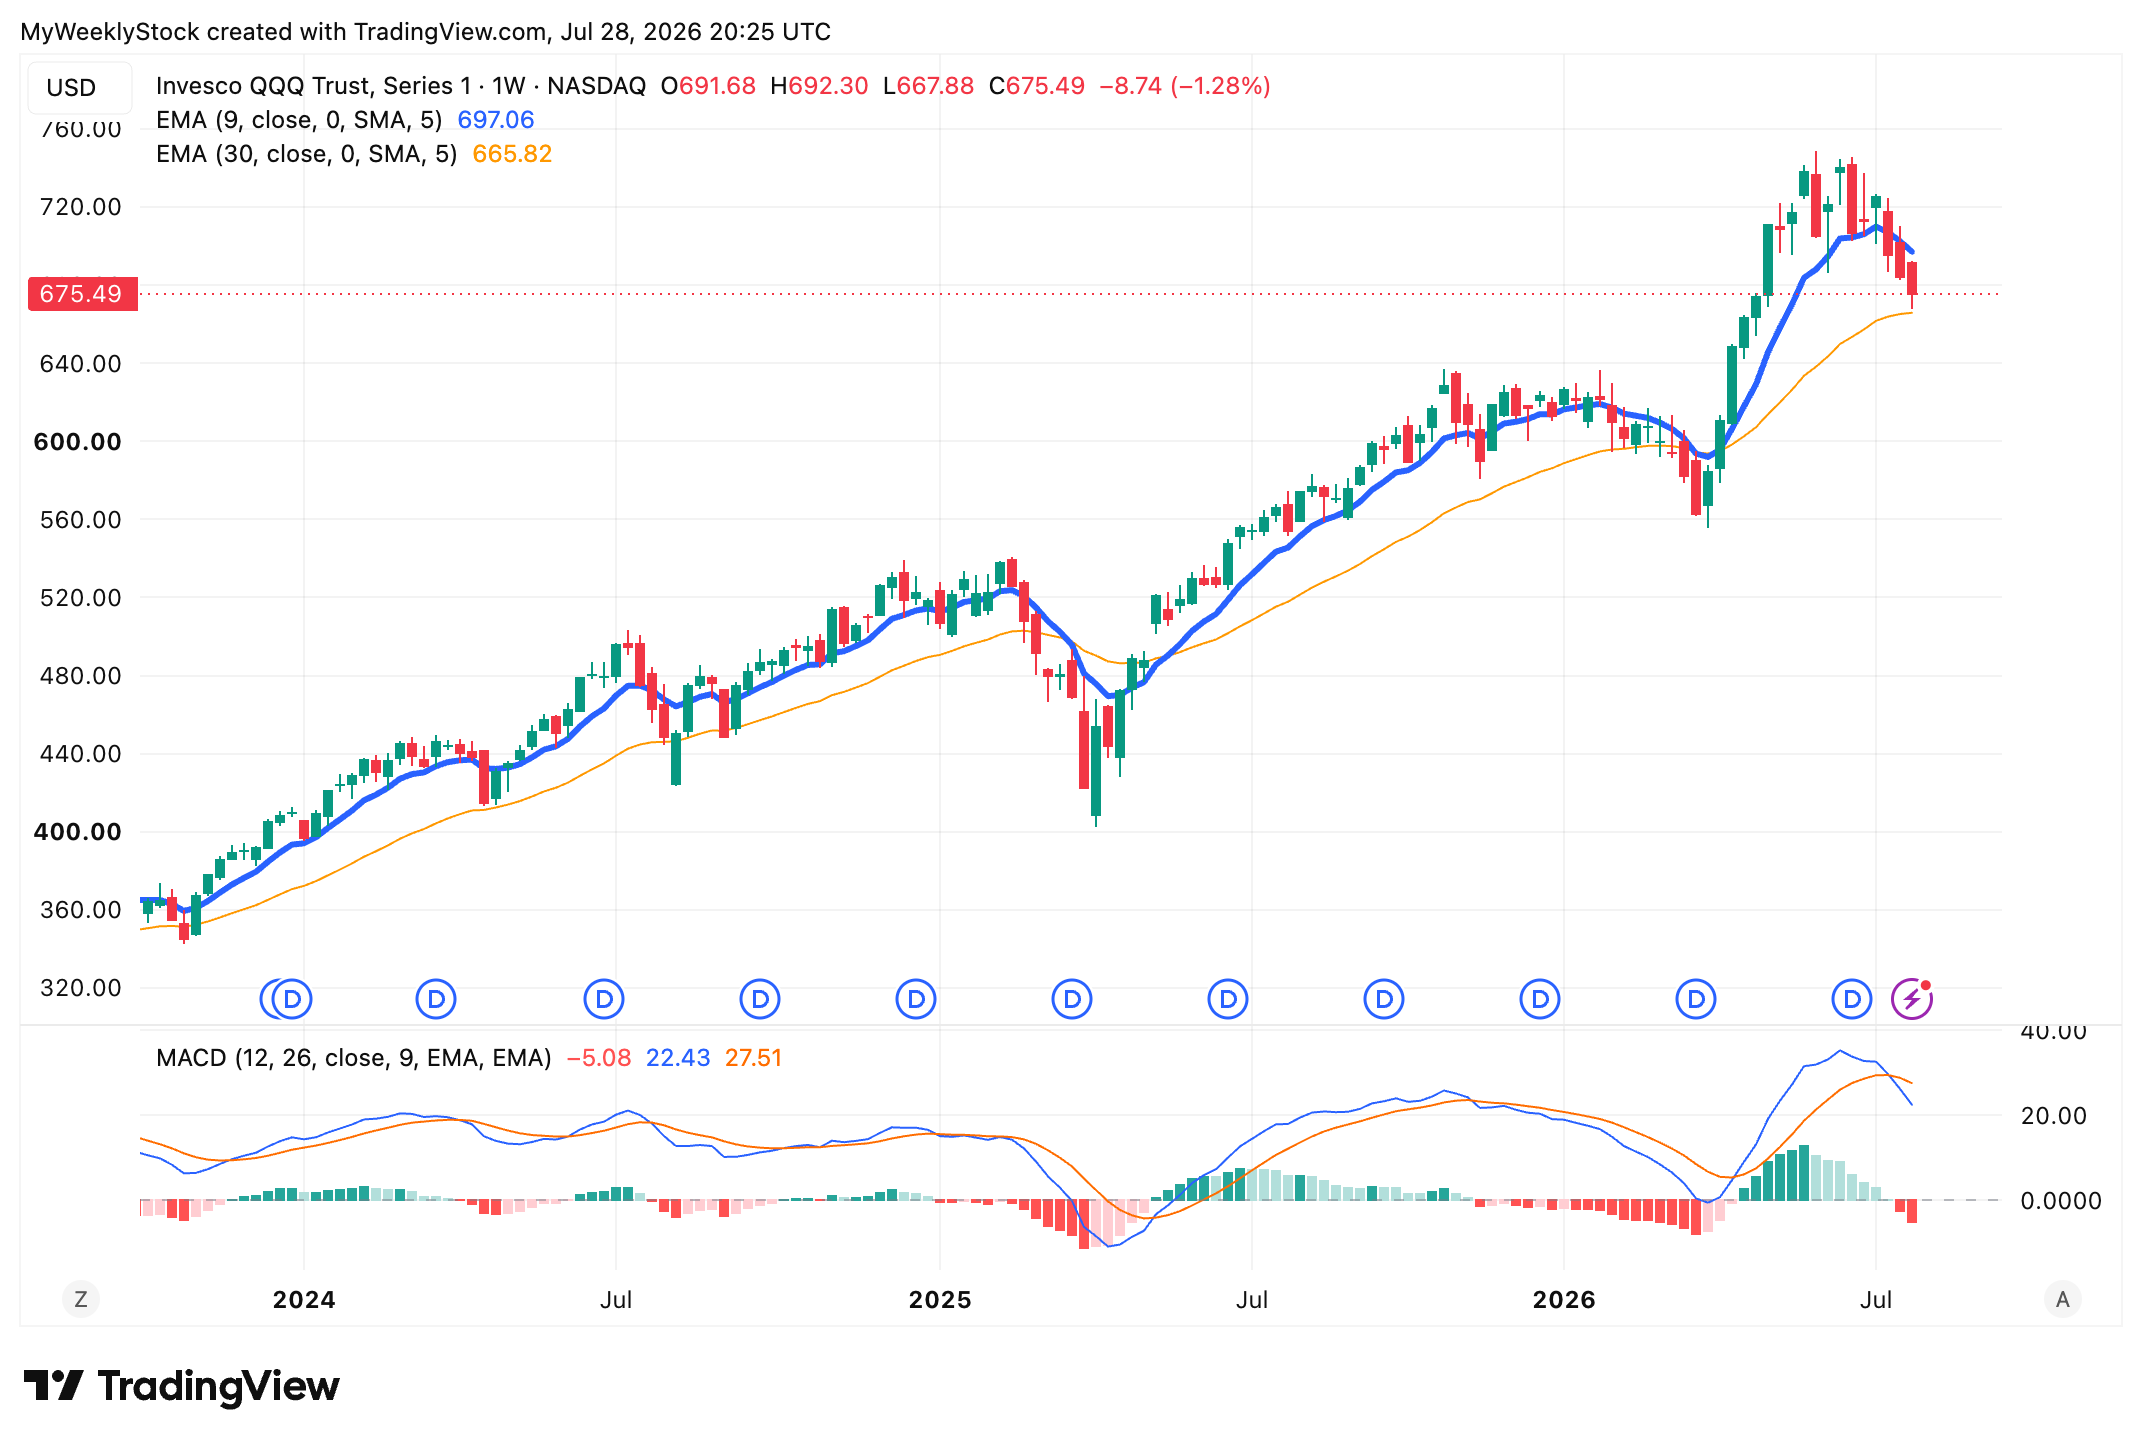
Want the full picture?
Paid subscribers get access to the complete momentum breakdown across all 10 segments, plus my Macro ETF portfolio to see how this analysis translates into actual portfolio decisions.
Momentum Score: ⭐️⭐️⭐️⭐️⭐️ | Strong Uptrend - Outlook: Stable
Key Levels
Support: $278
Resistance: $300
📌 My Rating: HOLD
Somewhat similar price action to the S&P 500, but with an even milder pullback. This space remains my favorite equity segment in terms of both momentum and long-term potential.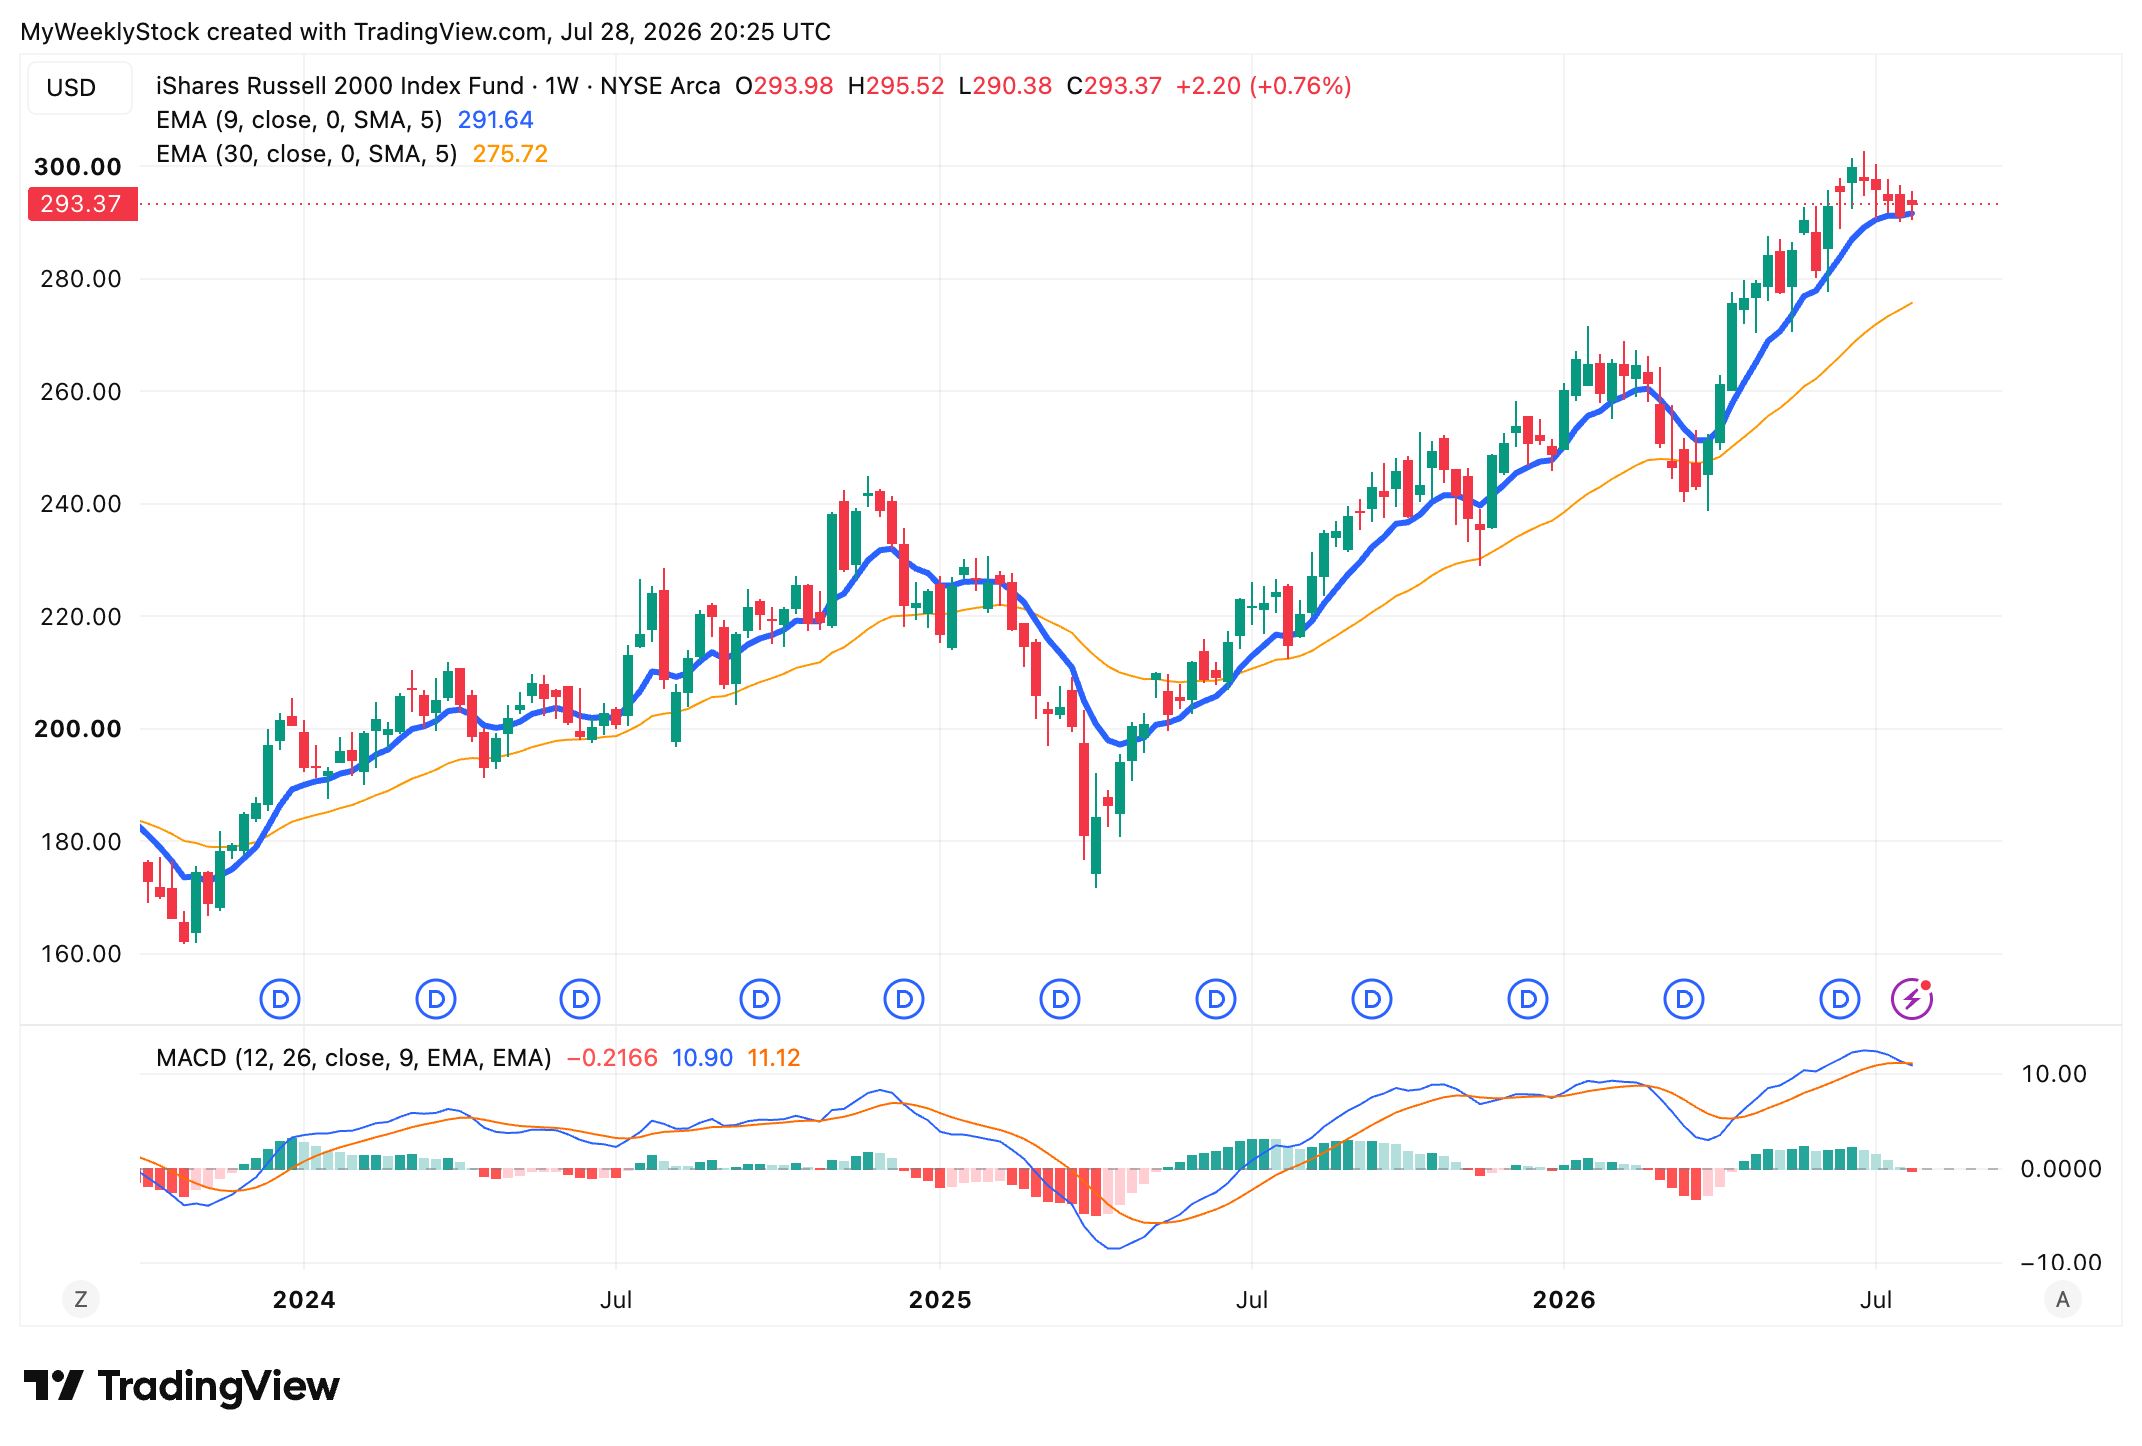
Comments
Nothing yet. Say the first thing.
Sign in to join the conversation.