
CHINESE BANKS are central to understanding the financial links between China and the rest of the world.
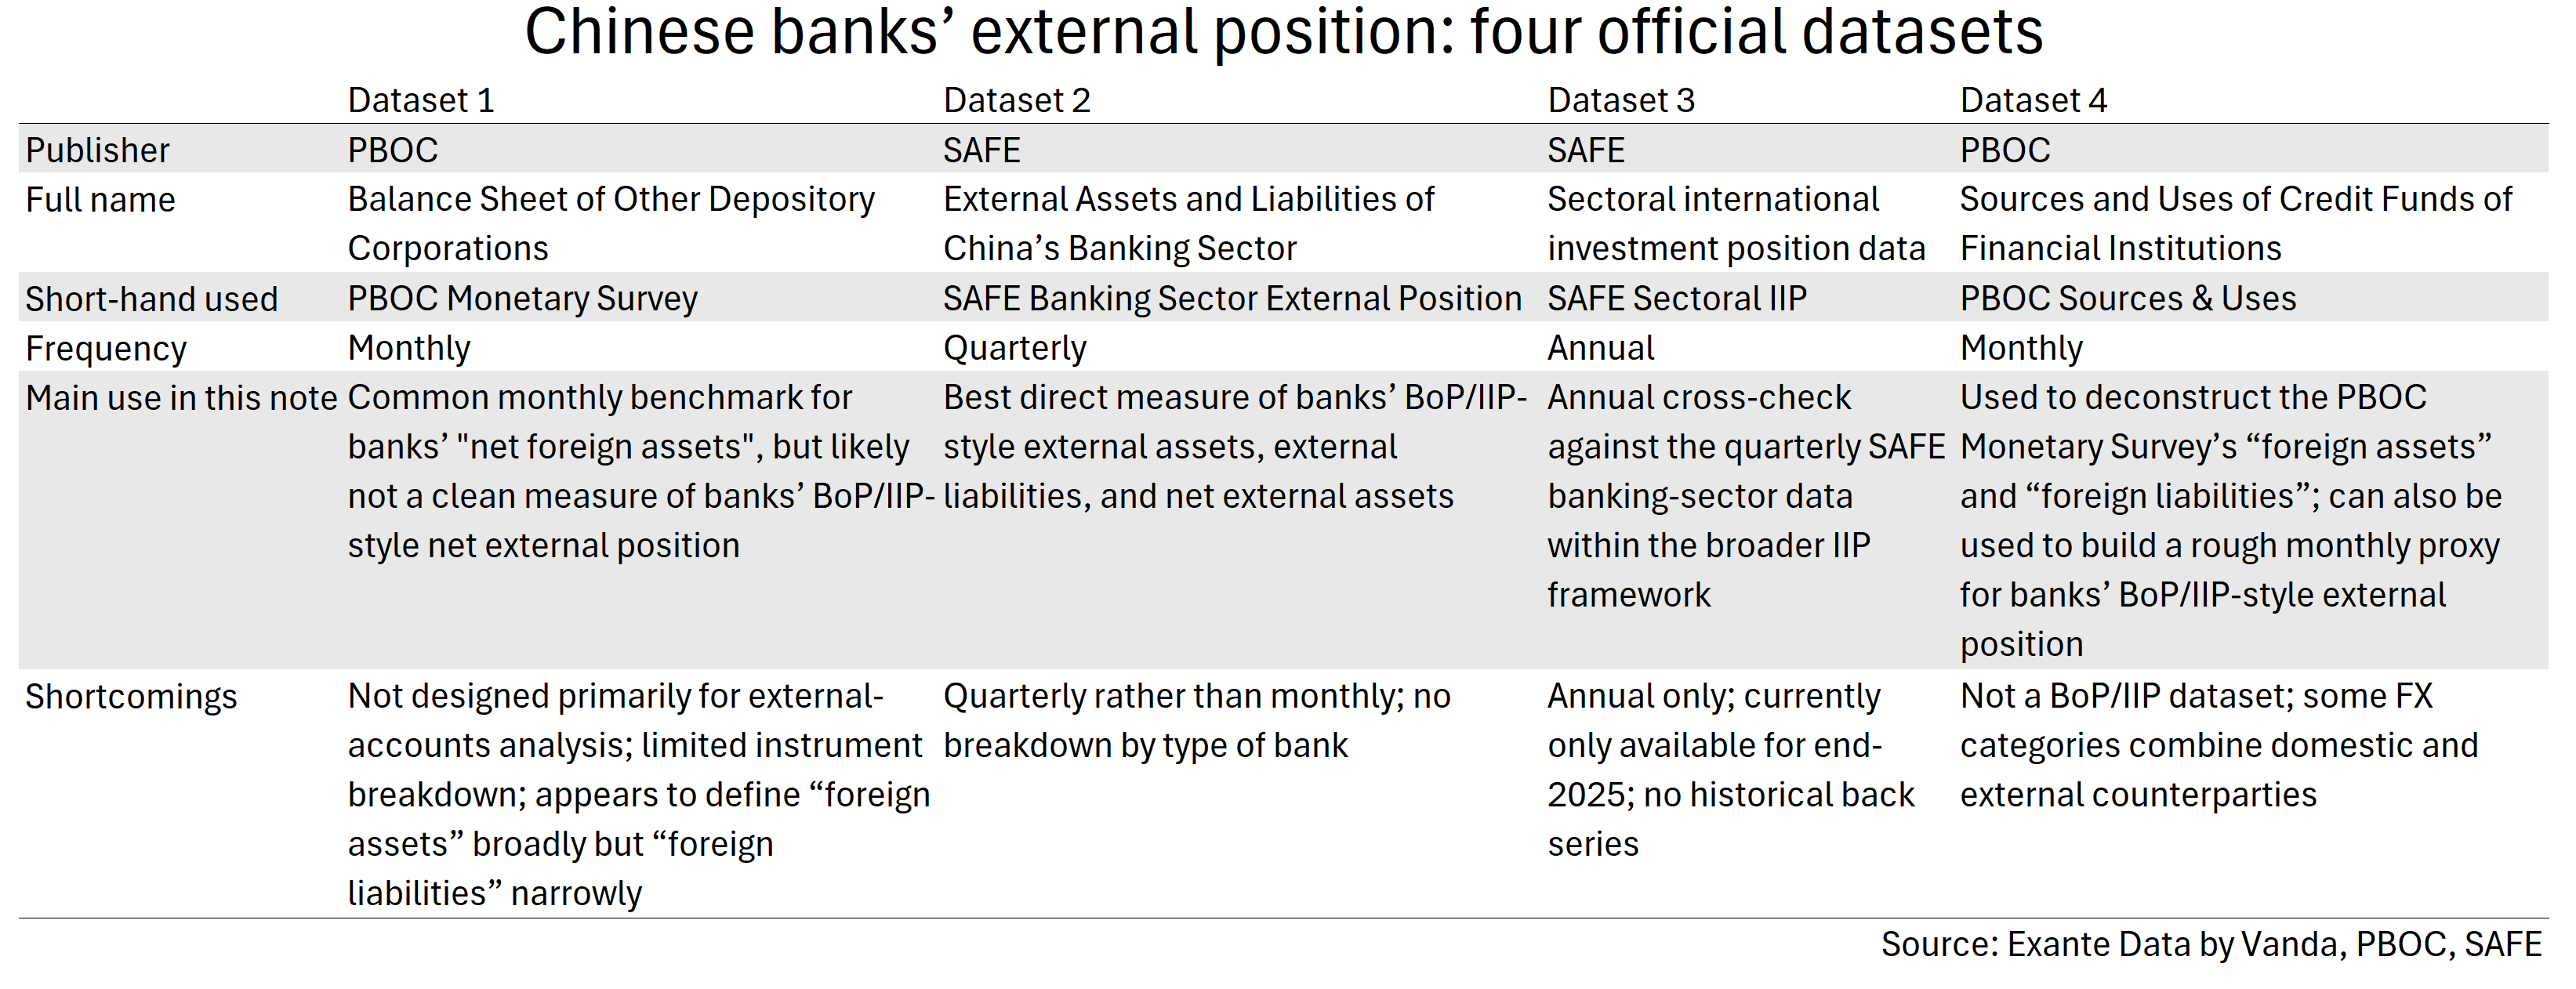
Yet despite the importance of the topic, there is little guidance on how to reconcile the different official datasets on Chinese banks’ external positions. This note examines four of them.
We find that one of the most commonly used datasets, the PBOC’s data on the net foreign assets of Chinese banks, probably overstates banks’ actual net external asset position by a factor of more than two. The reason appears to be that the dataset, which isn’t intended for external accounts analysis, understates the liability side of banks’ external position. We argue that the BoP-consistent net external asset position of Chinese banks might be closer to the $600bn implied by SAFE data than the $1,400bn implied by PBOC data.
Why should we care? China’s banking system is huge on a global scale and, furthermore, is largely state-owned. This means that their behavior is driven by a broader set of priorities than that of their privately owned peers.
For example, Chinese banks help authorities buy up the huge amounts of foreign exchange generated by China’s large trade surplus, something that helps slow down the pace at which the renminbi appreciates. What’s more, Chinese banks increasingly finance the purchases of Chinese goods by extending renminbi-denominated trade credit (link). Both shadow intervention and RMB-denominated trade financing can support the persistence of China’s trade surplus at the margin, which has become a source of trade-policy tension. More directly, policy priorities might influence which assets Chinese banks (don’t) hold, though the size of foreign exchange that needs to be recycled means that the banks have little choice but to buy, well, everything.
Before proceeding, it is worth stating that our goal is to measure Chinese banks’ external position on a balance of payments (BoP) basis. In other words: how much financing are Chinese banks providing to “the world”, i.e. to entities located outside of China, in the context of how much financing the world is providing to Chinese banks.
Dataset 1: PBOC Monetary Survey
One of the more common ways to analyze Chinese banks’ external position is to rely on the PBOC’s monthly “Balance Sheet of Other Depository Corporations”. This dataset aims to measure domestic monetary conditions (following IMF principles), and banks’ external position is therefore not the dataset’s primary purpose. Going forward, we will call this dataset the “PBOC Monetary Survey”.
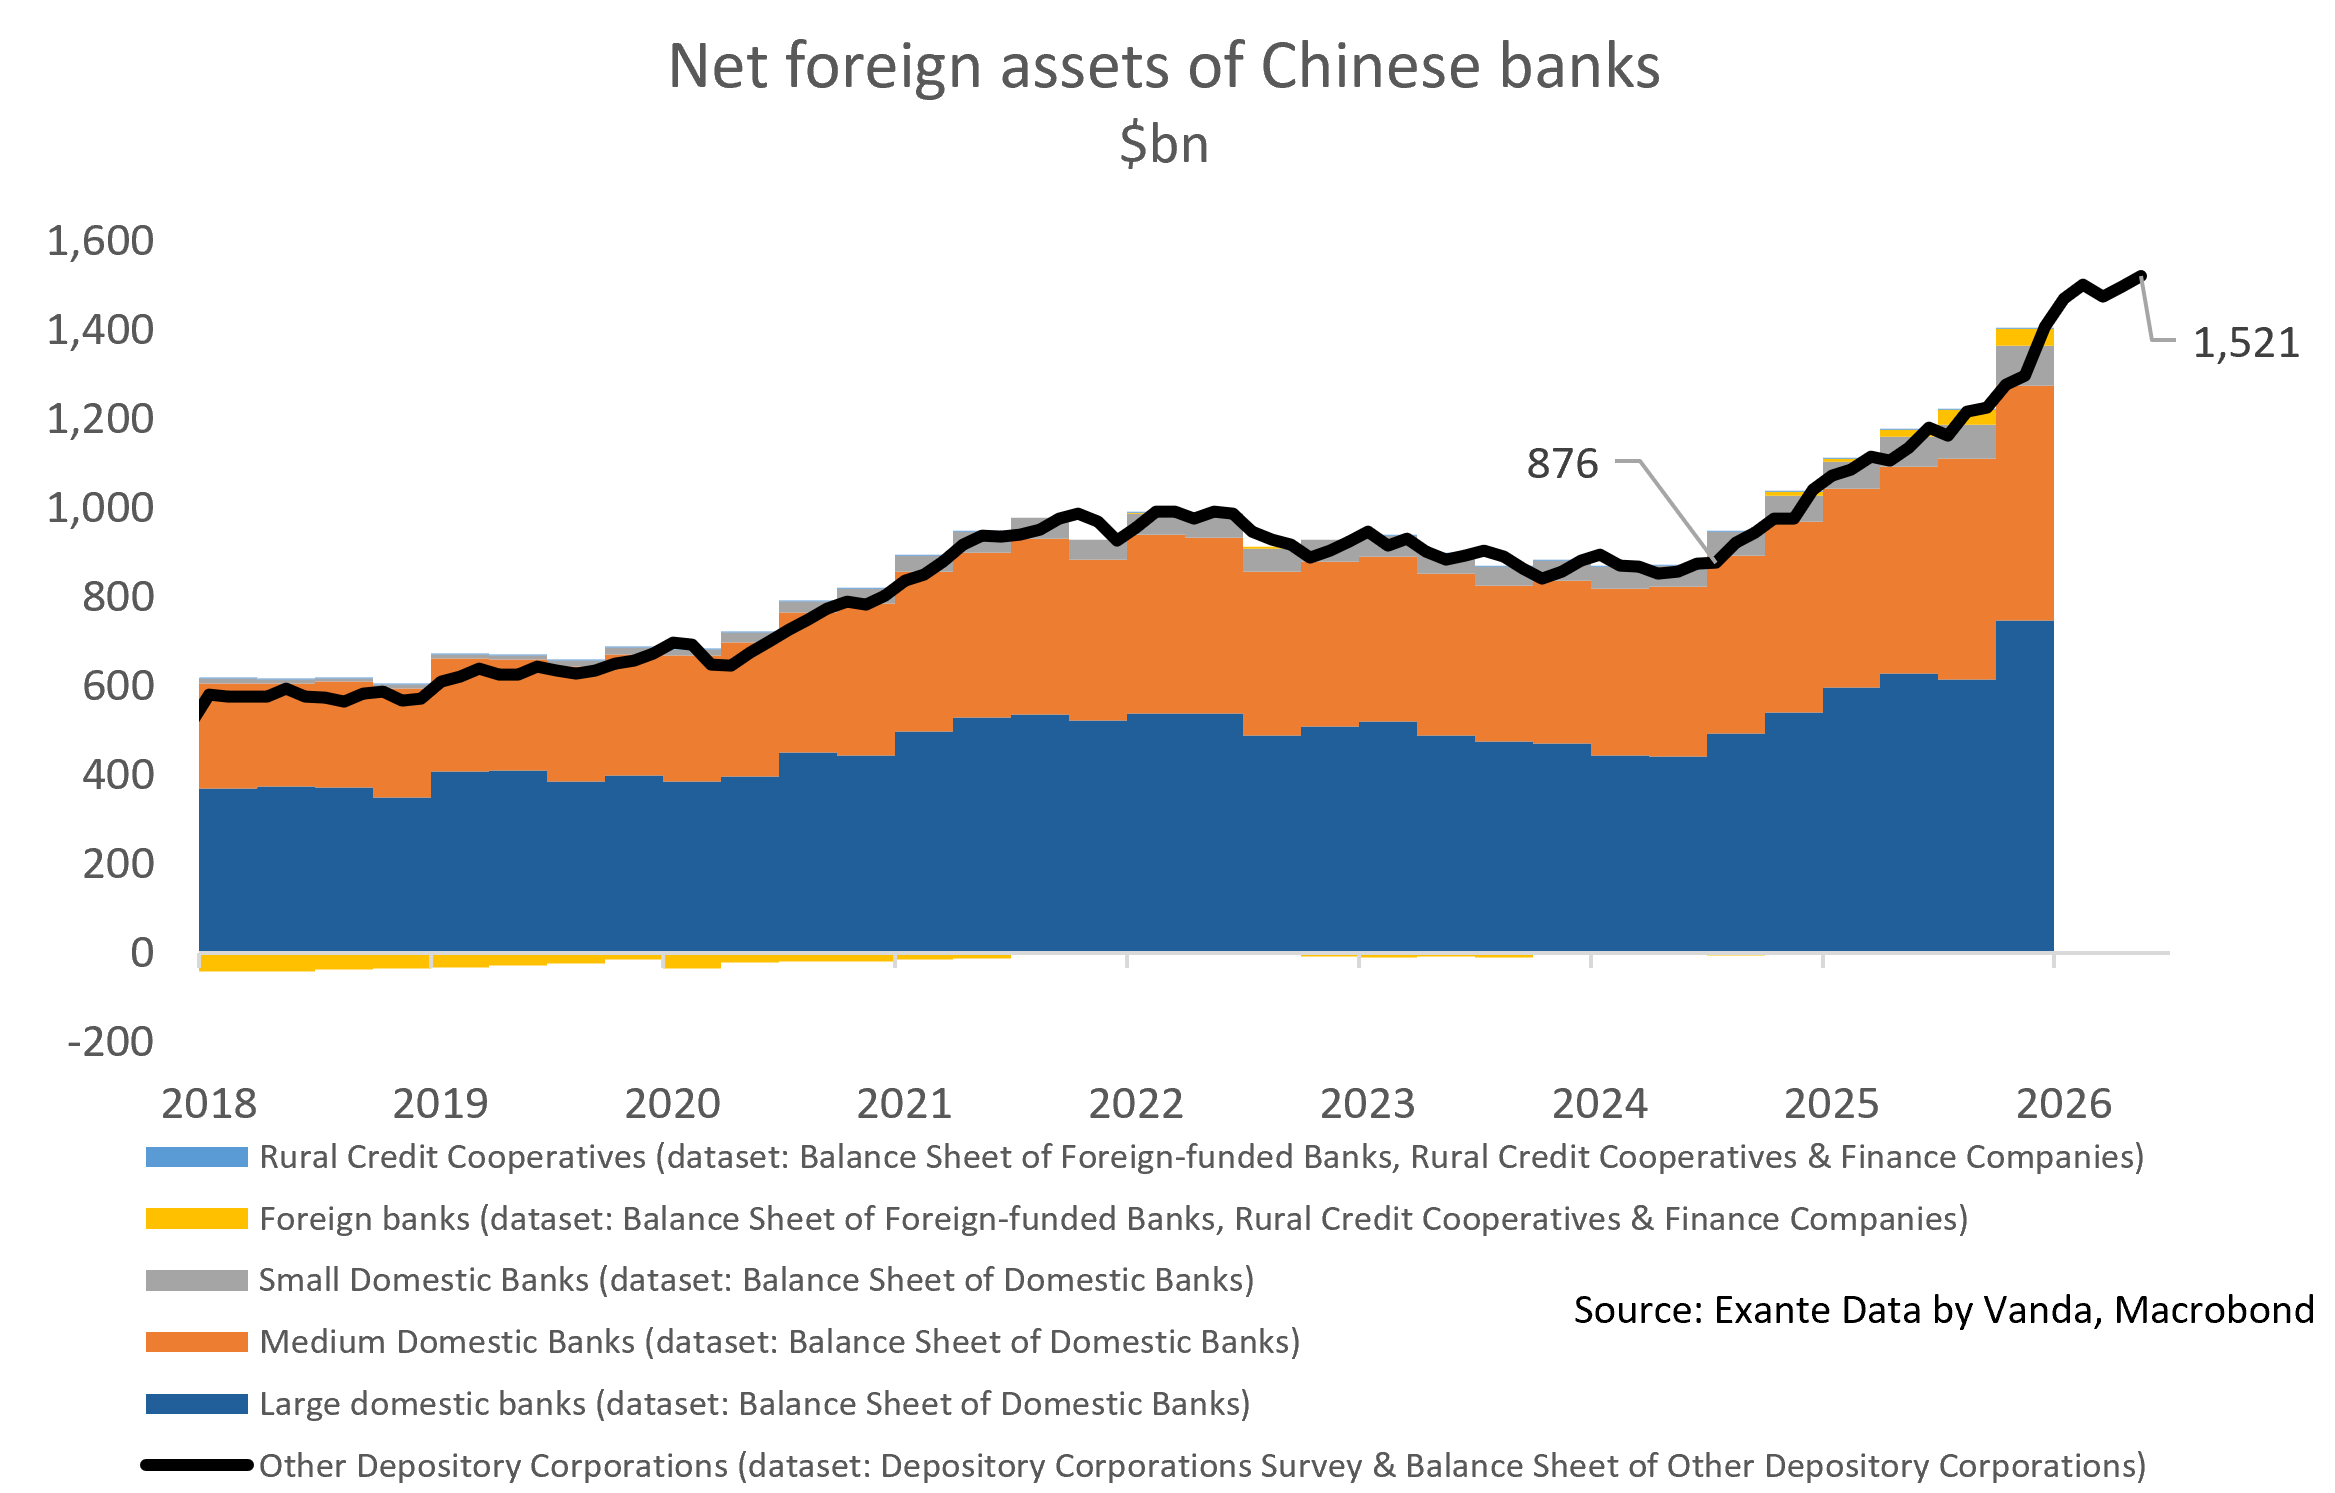
This dataset implies that banks’ net foreign assets (or “NFA”) stood at $1,521bn in May 2026, up sharply from $876bn in July 2024, a $645bn increase. The IMF uses this dataset in their evaluation of China’s external vulnerability (see table 8 in the 2025 Article IV consultation report).
This dataset connects cleanly to two other datasets: “Balance Sheet of Domestic Banks” and “Balance Sheet of Foreign-funded Banks, Rural Credit Cooperatives & Finance Companies”, which provide the breakdown of NFA by type of bank. The below chart shows that large and medium-sized domestic banks make up the vast majority of banks’ NFA.
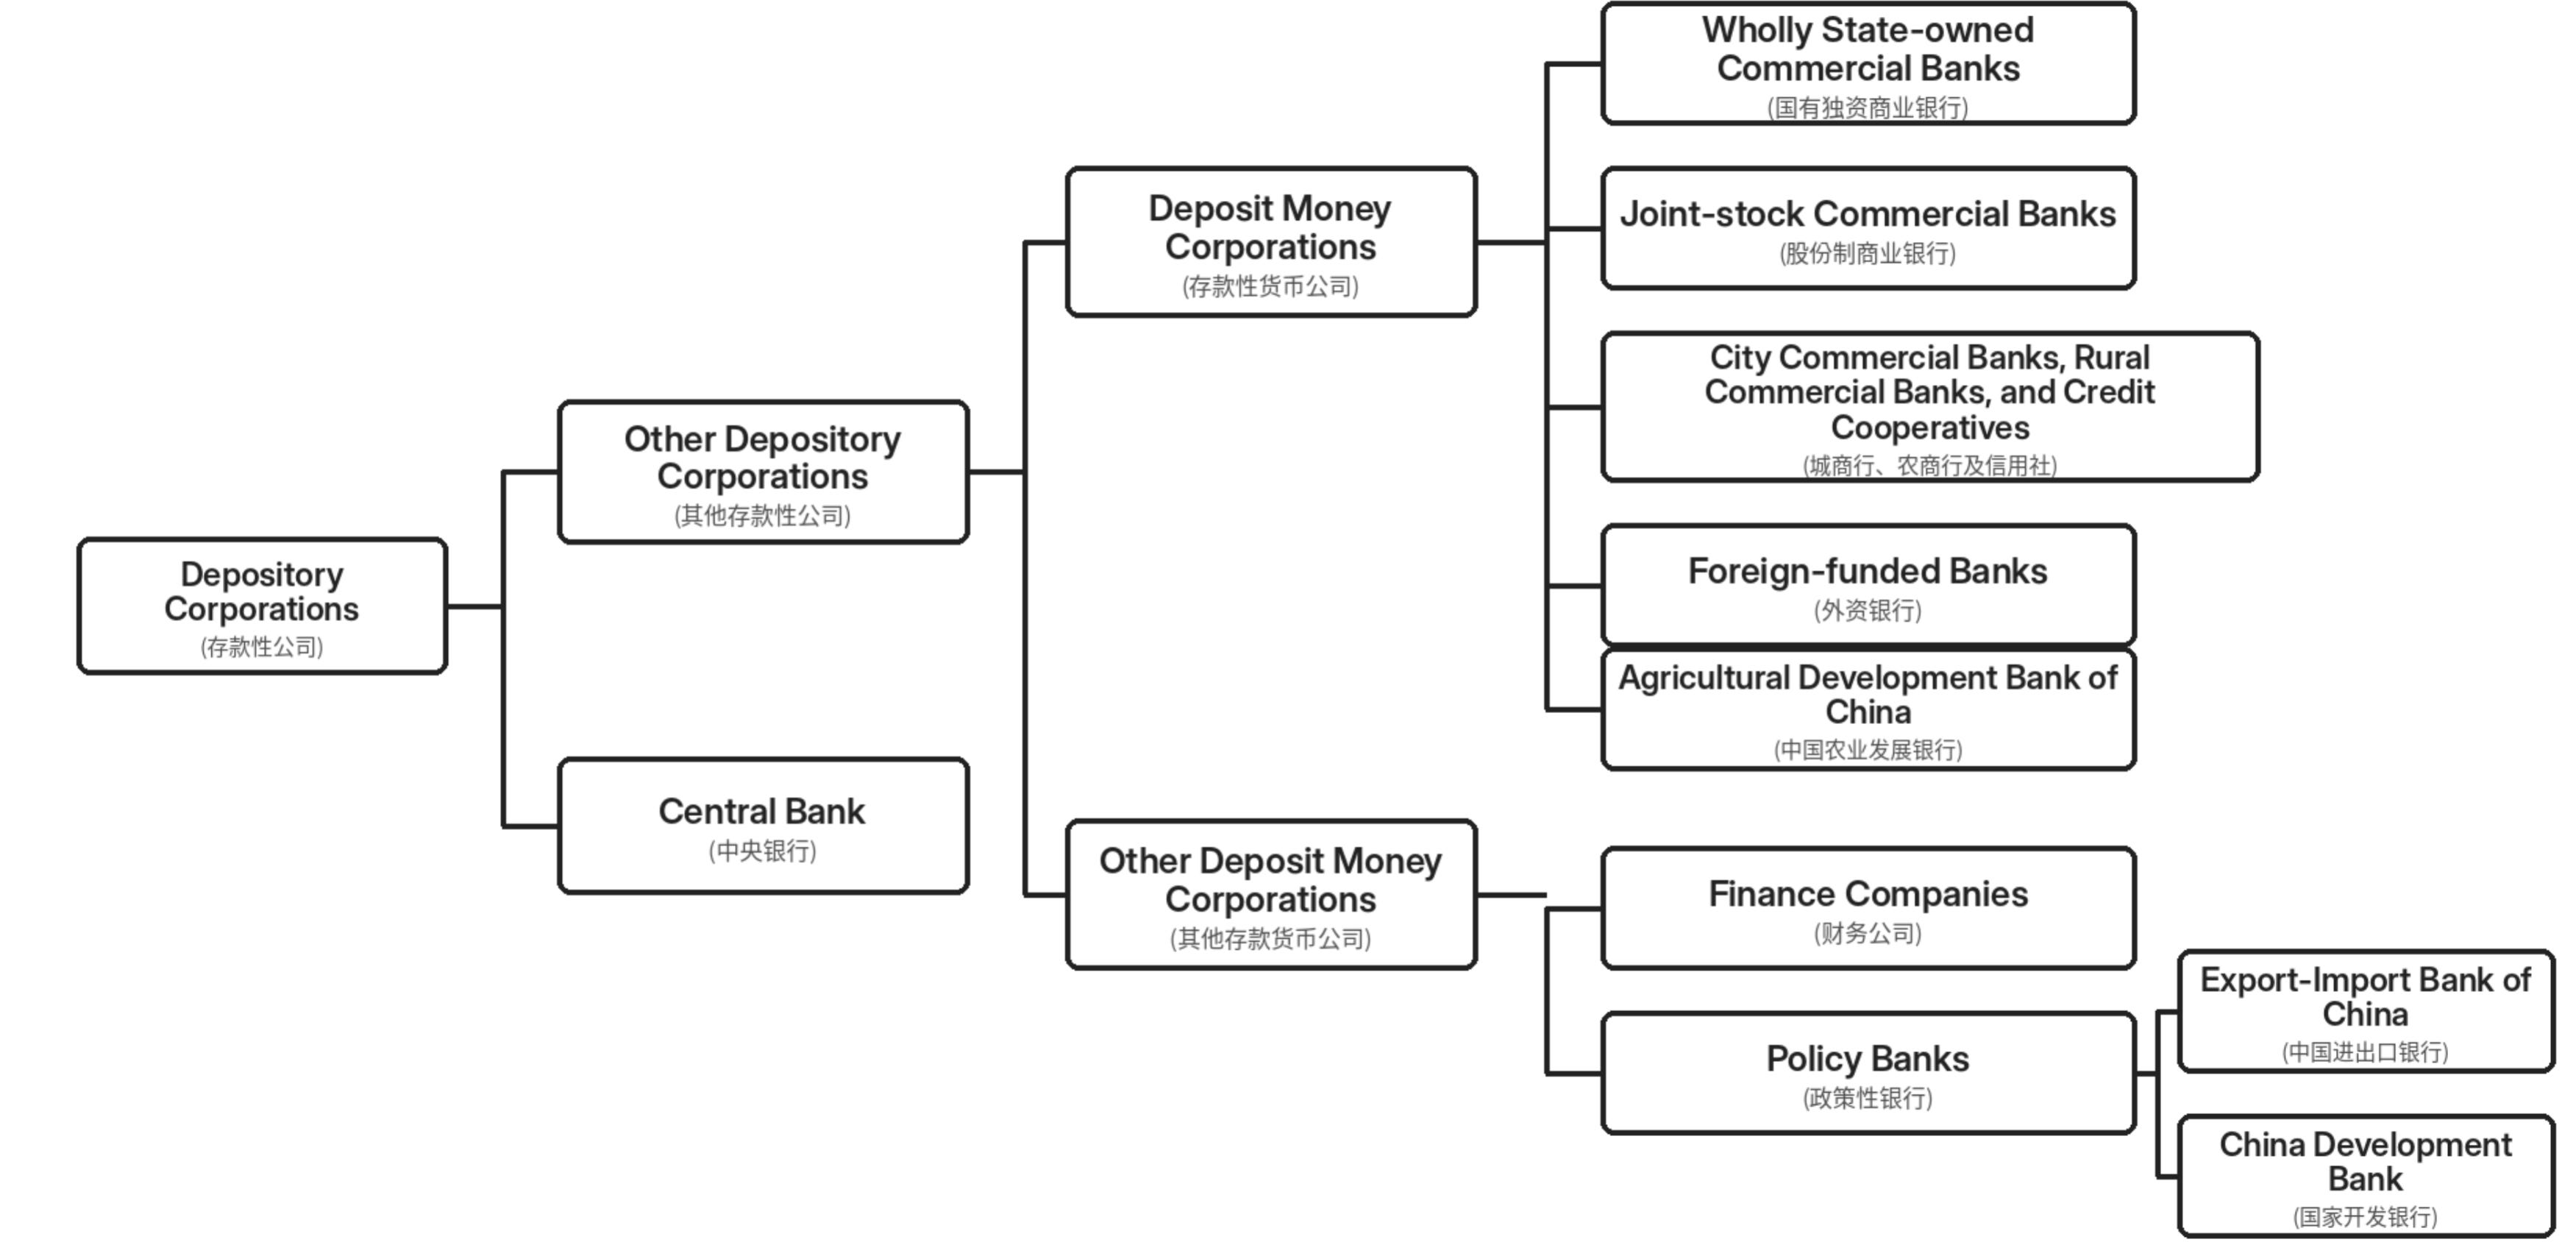
The PBOC Monetary Survey also forms part of the broader “Depository Corporations Survey”, which consolidates the PBOC, banks, policy banks and finance companies. The data can be accessed on the PBOC’s website here.
The graphic below (recreated from here) shows how the different datasets connect. The first thing to note is that “other depository corporations” is more or less another word for “banks” when it comes to this dataset, and we will use “banks” in the rest of this note. Other depository corporations do include some other institutions, but we can see in the above charts that “normal” banks make up the vast majority of the net foreign assets. This raises the possibility that policy banks are not fully captured in the dataset.
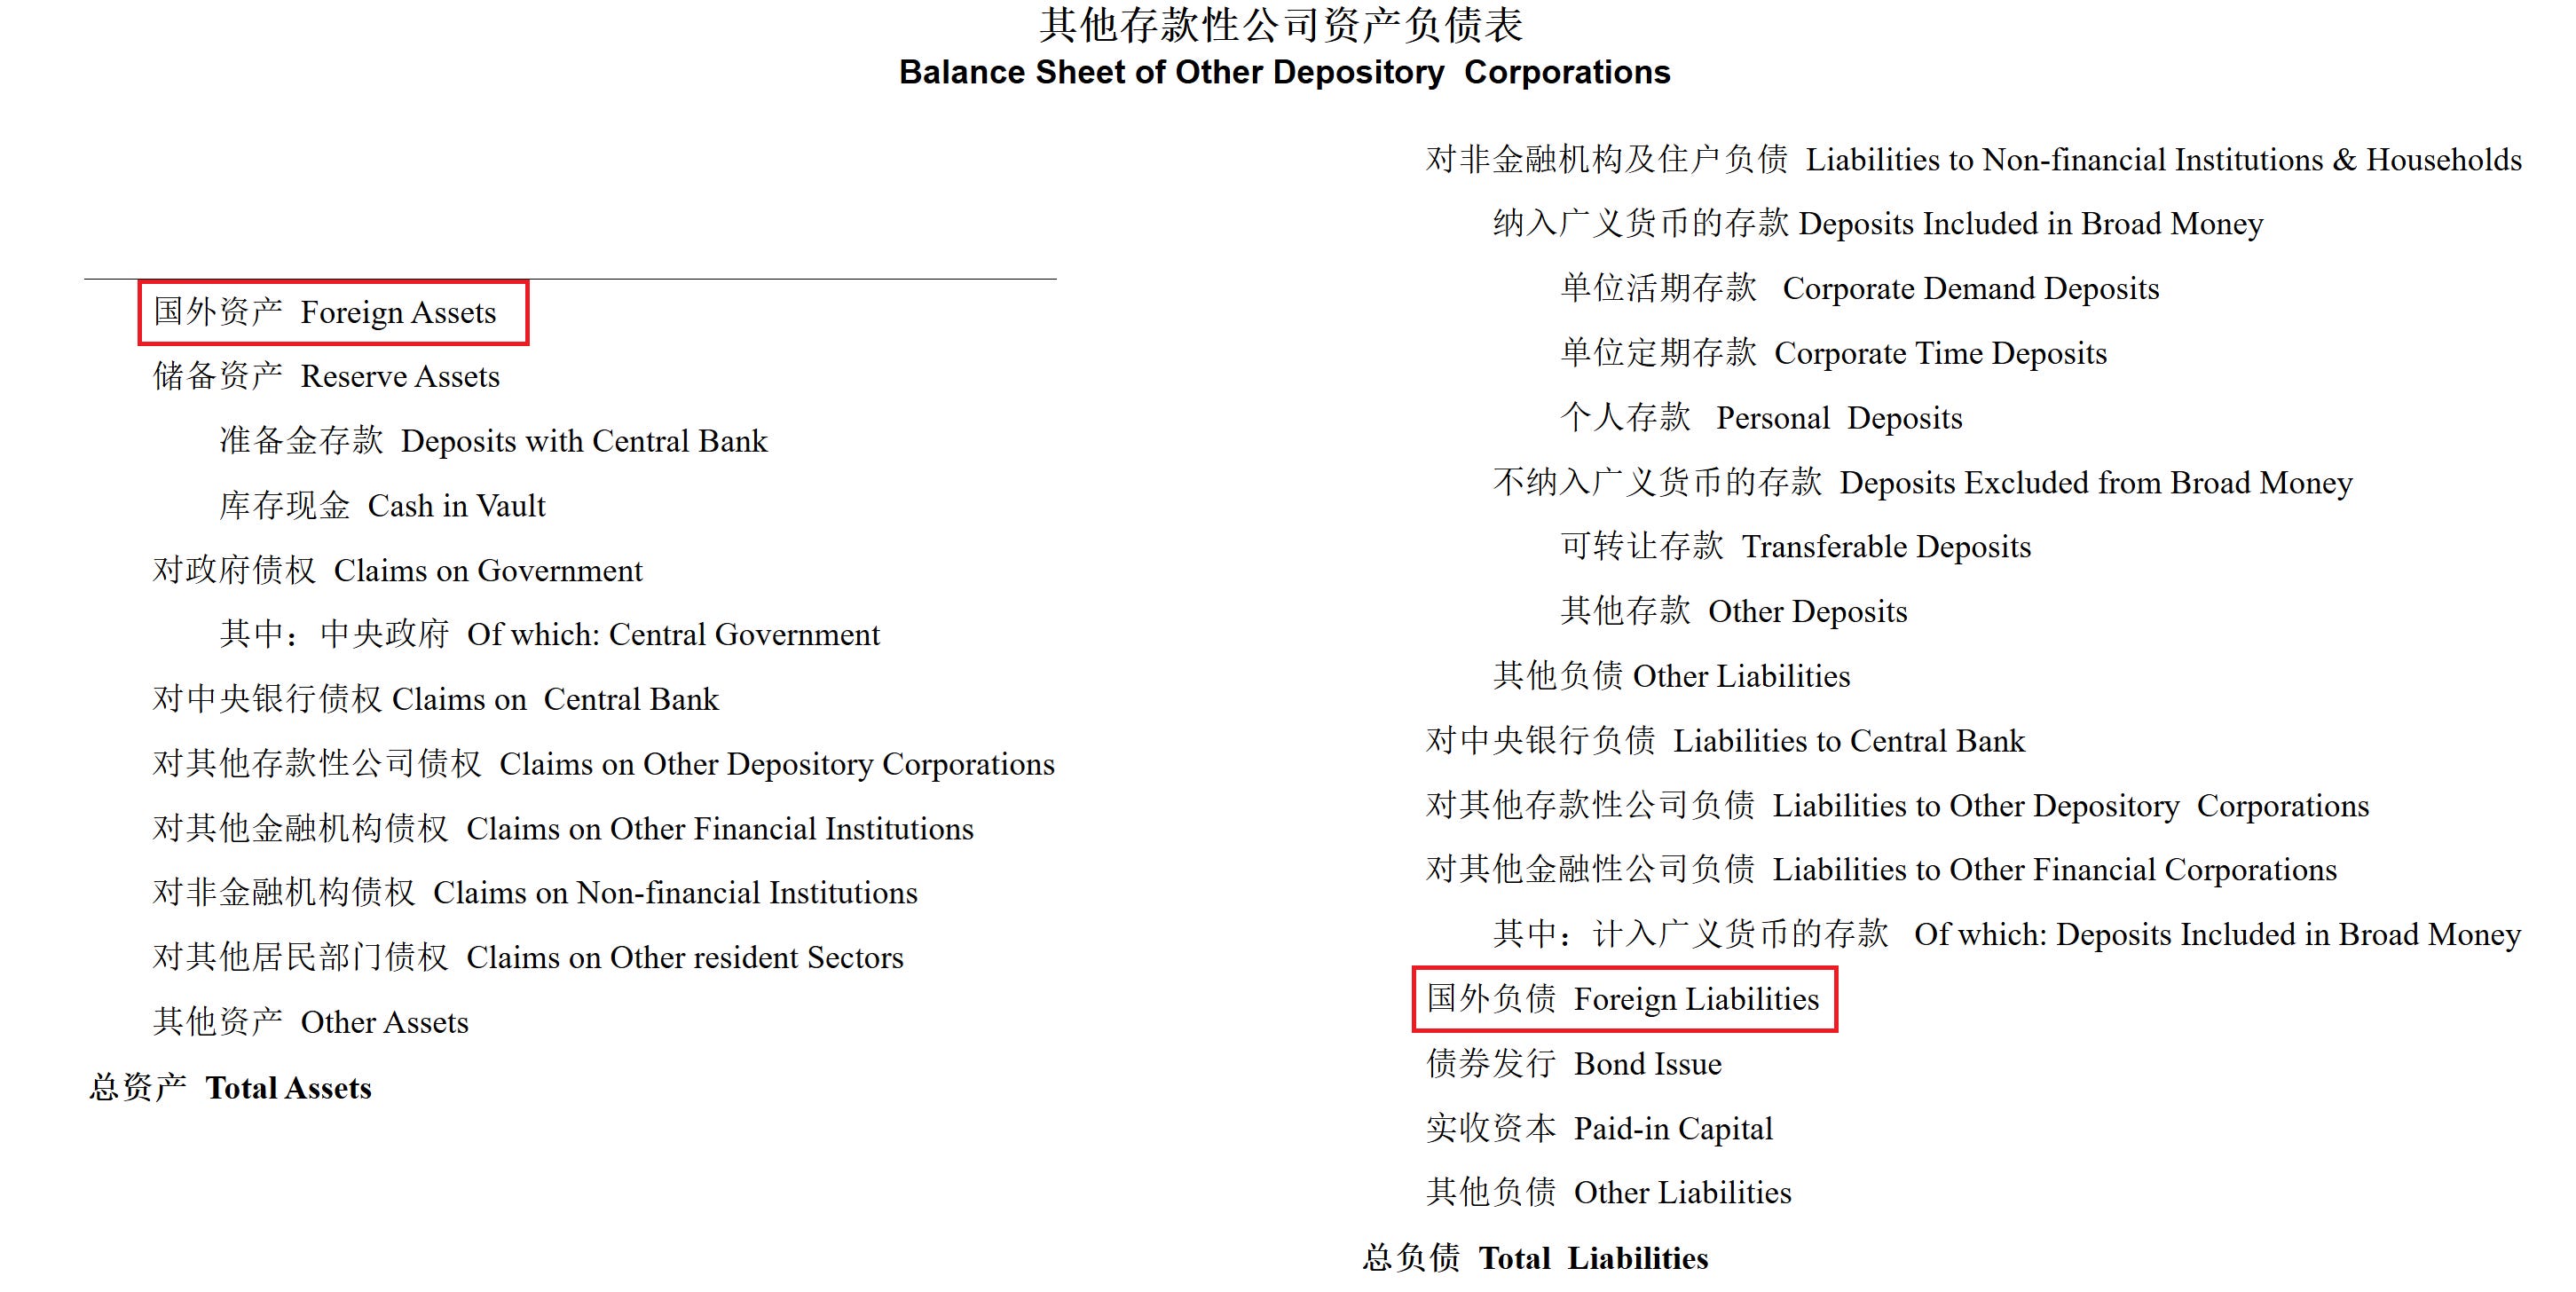
While this dataset provides a clean breakdown by the type of bank, there is little detail in terms of the instrument composition (e.g. loans, equities, bonds, other instruments) of the assets and liabilities. The data is only reported as “foreign assets” and “foreign liabilities”.
Dataset 2 and 3: external asset and liabilities, sectoral IIP
The second dataset worth introducing is SAFE’s quarterly “External Assets and Liabilities of China’s Banking Sector” (link). This dataset measures banks’ external assets and liabilities and follows BoP principles. The aim of the dataset is therefore more closely aligned with our goal - gauging how large Chinese banks’ external position is - than the PBOC dataset introduced above. We will refer to this dataset as “SAFE Banking Sector External Position”.
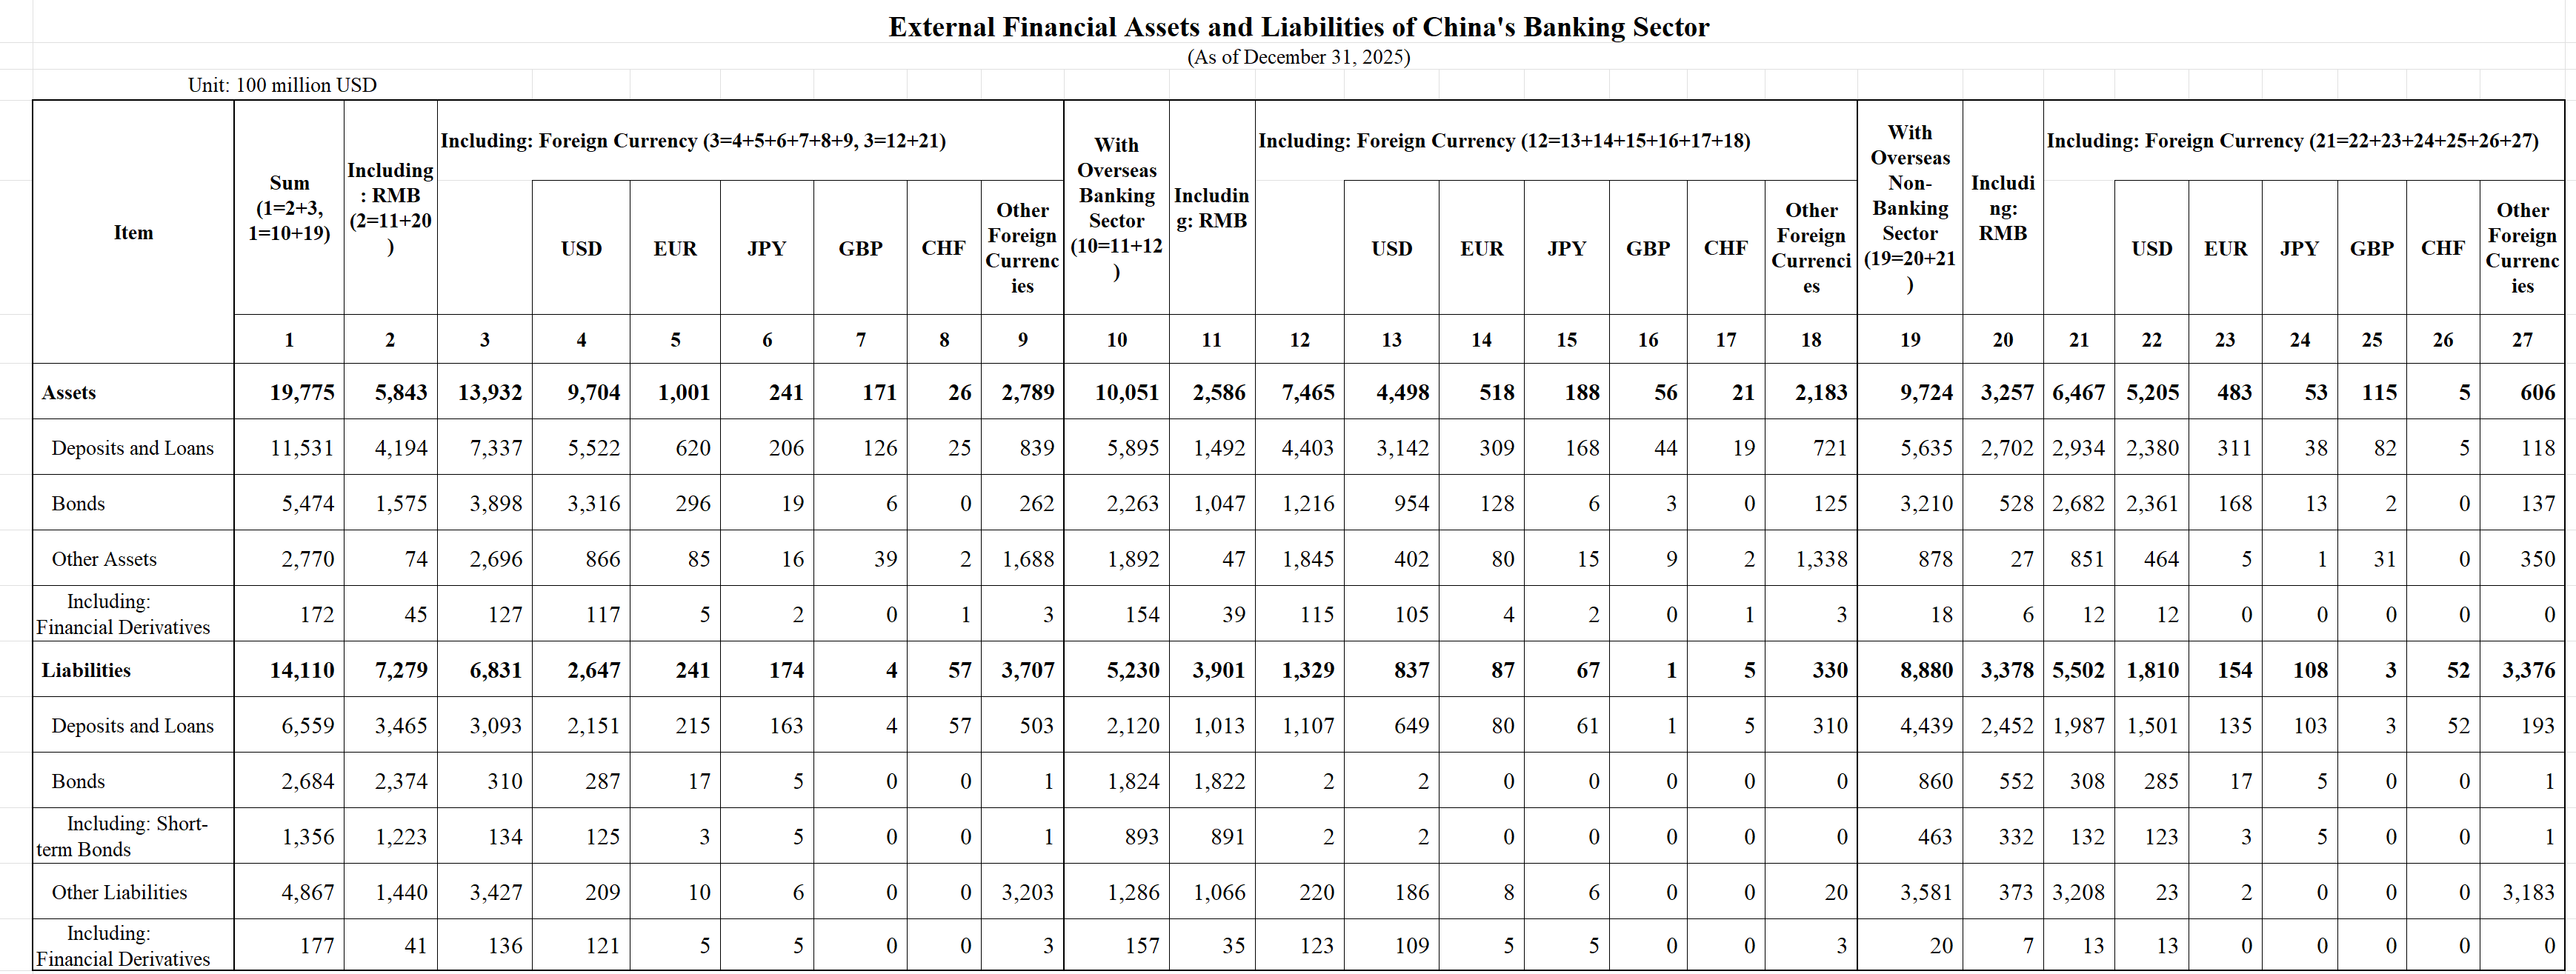
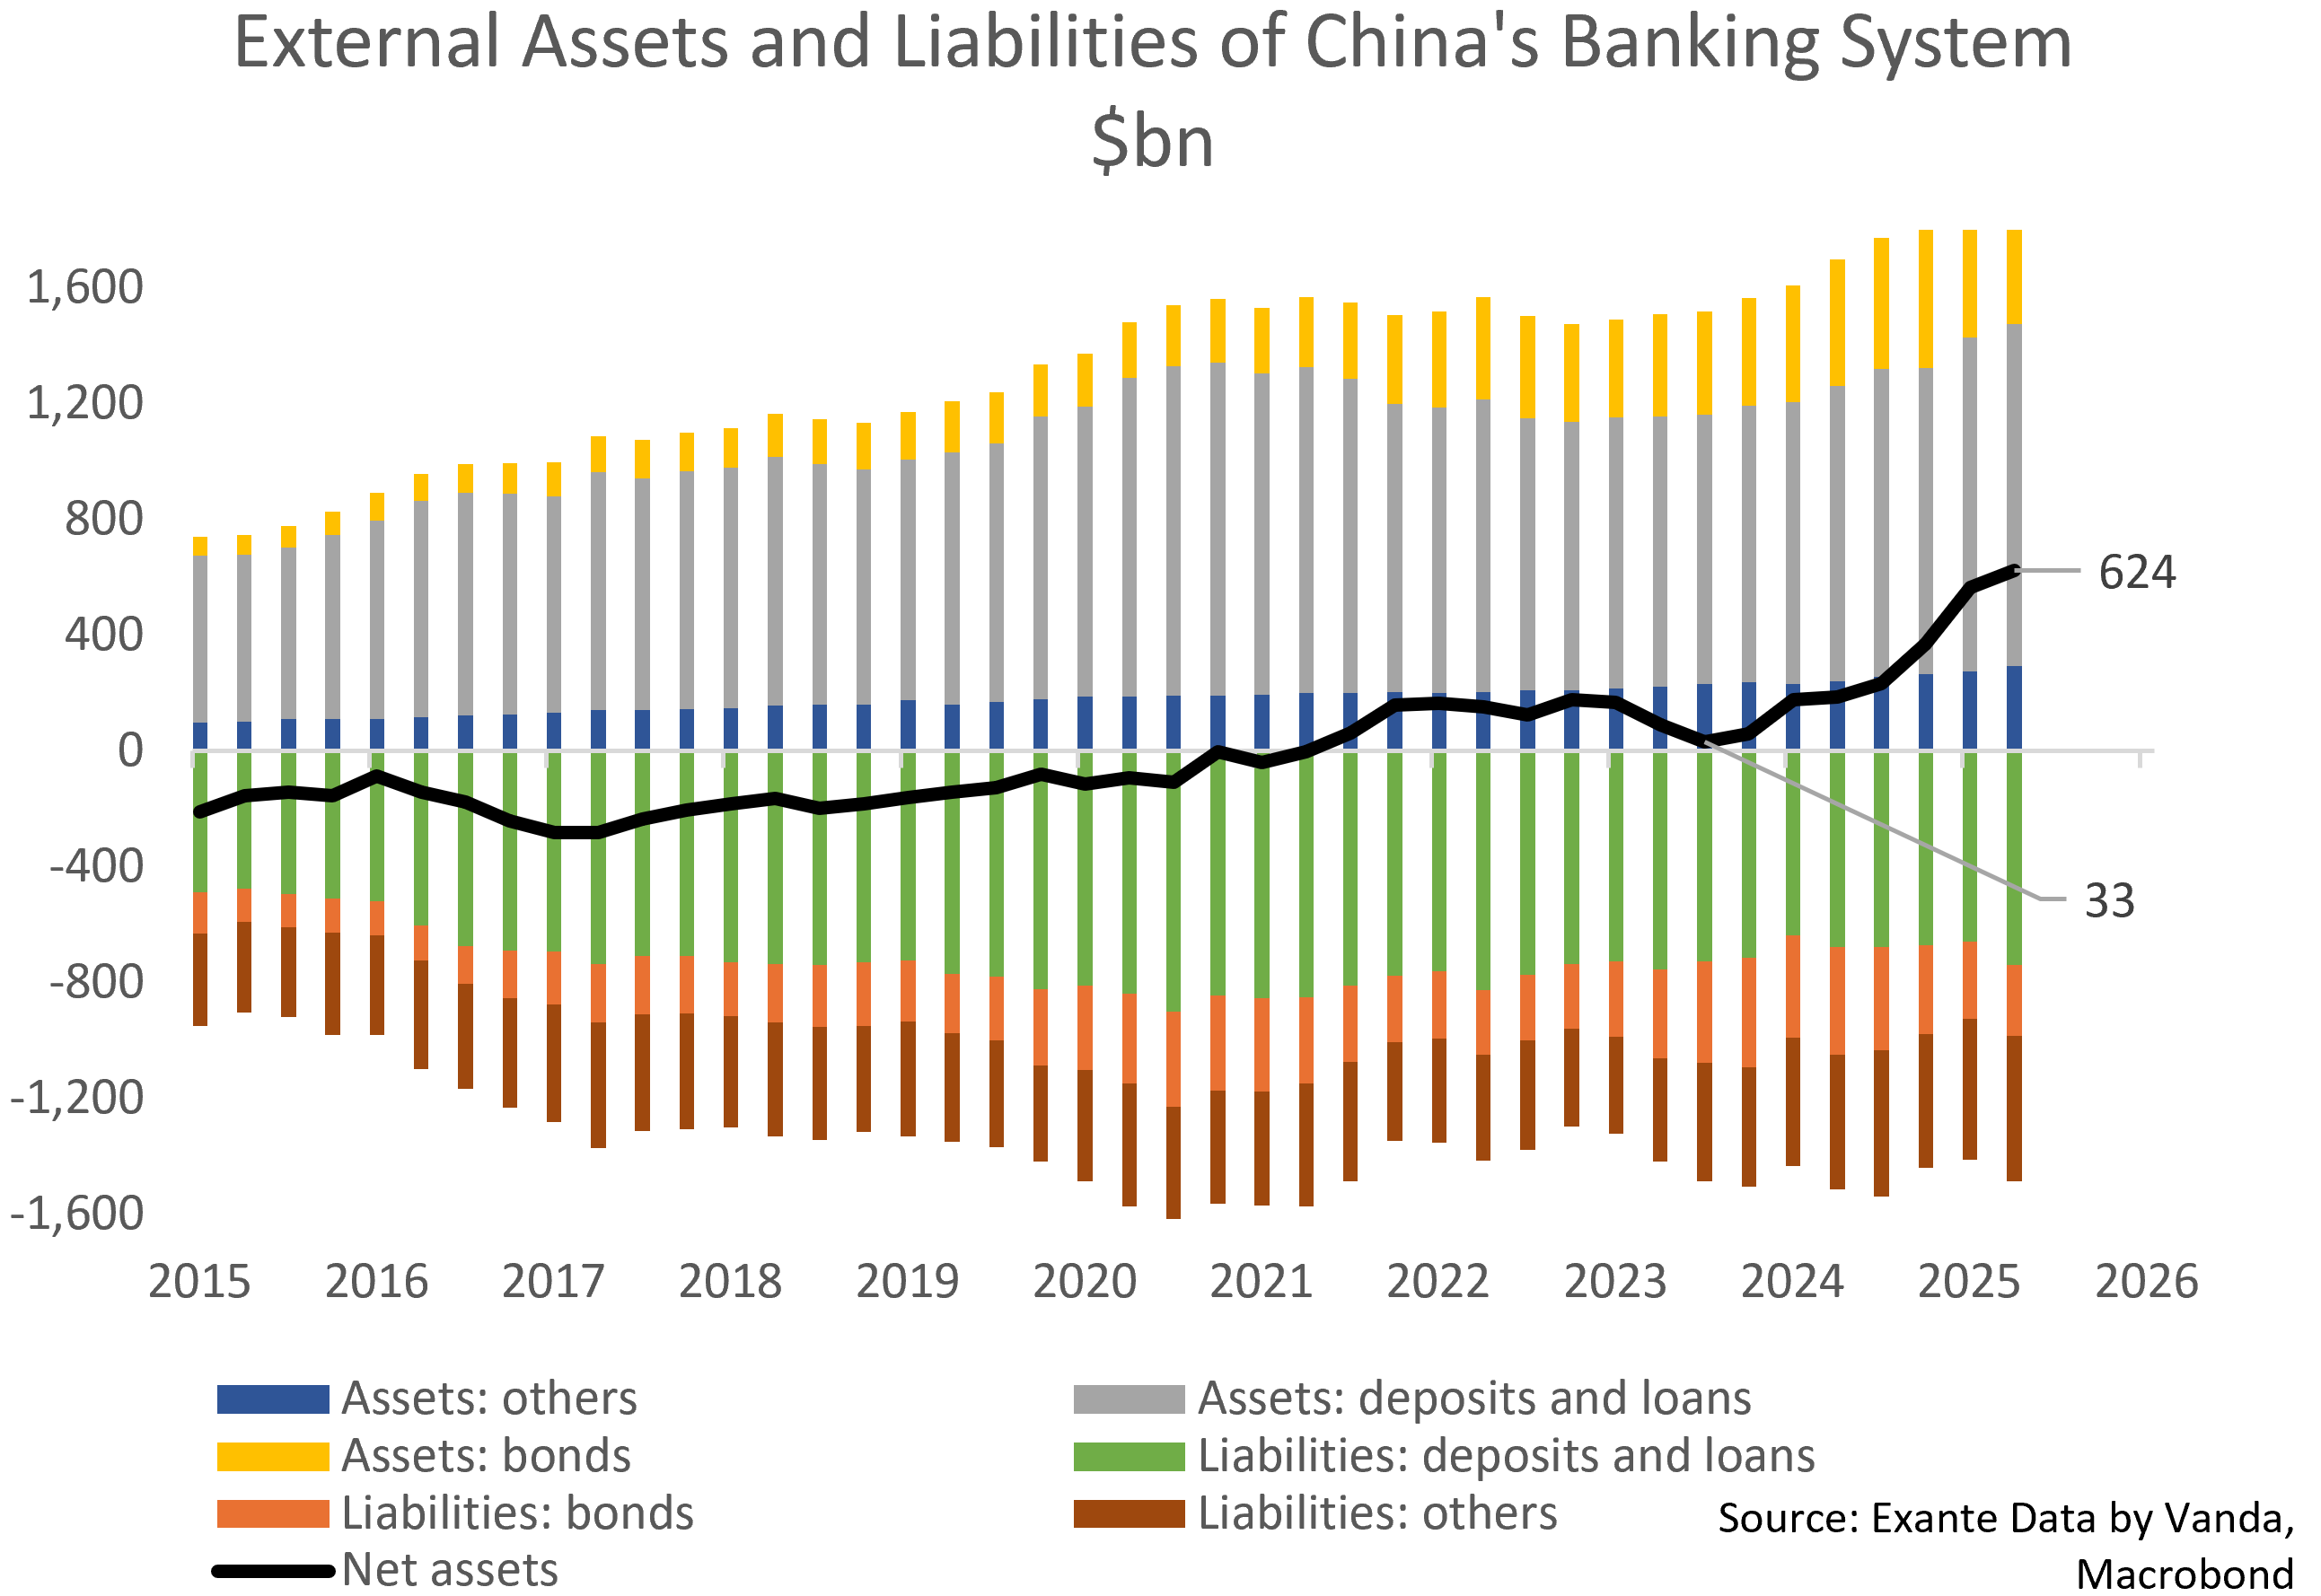
This data is detailed, and breaks down external assets and liabilities by both type of asset/liability and currency, though it doesn’t provide a breakdown by type of bank. On this basis, banks’ net external assets have increased from $33bn in Q2-2024 to $624bn by Q1-2026, a huge $591bn increase (see below chart). The SAFE Banking Sector External Position dataset therefore suggests that Chinese banks’ net external asset position is much smaller than implied by the PBOC Monetary Survey from the previous section, even if the increase in the past few years has been of a similar magnitude.
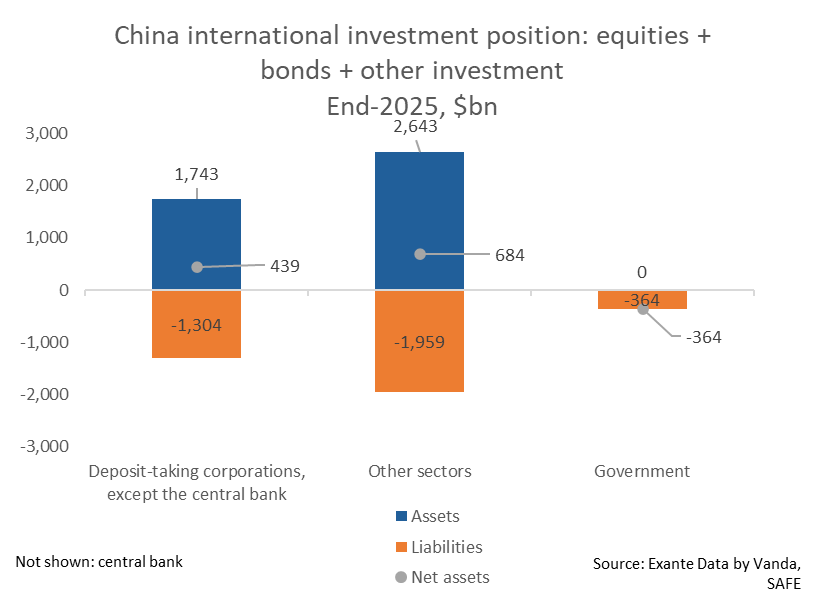
Earlier this year, SAFE for the first time published a sectoral breakdown of the annual BoP and international investment position (IIP) data. The SAFE Banking Sector External Position appears to be compiled in a way that fits neatly into this sectoral IIP dataset, and the two datasets are indeed of a similar magnitude ($566bn at end-2025 vs. $439bn). The downside of this dataset is that it’s annual, and that only the 2025 data was released (i.e., there is no back history).
Comparing the different datasets: what’s behind the large divergence?
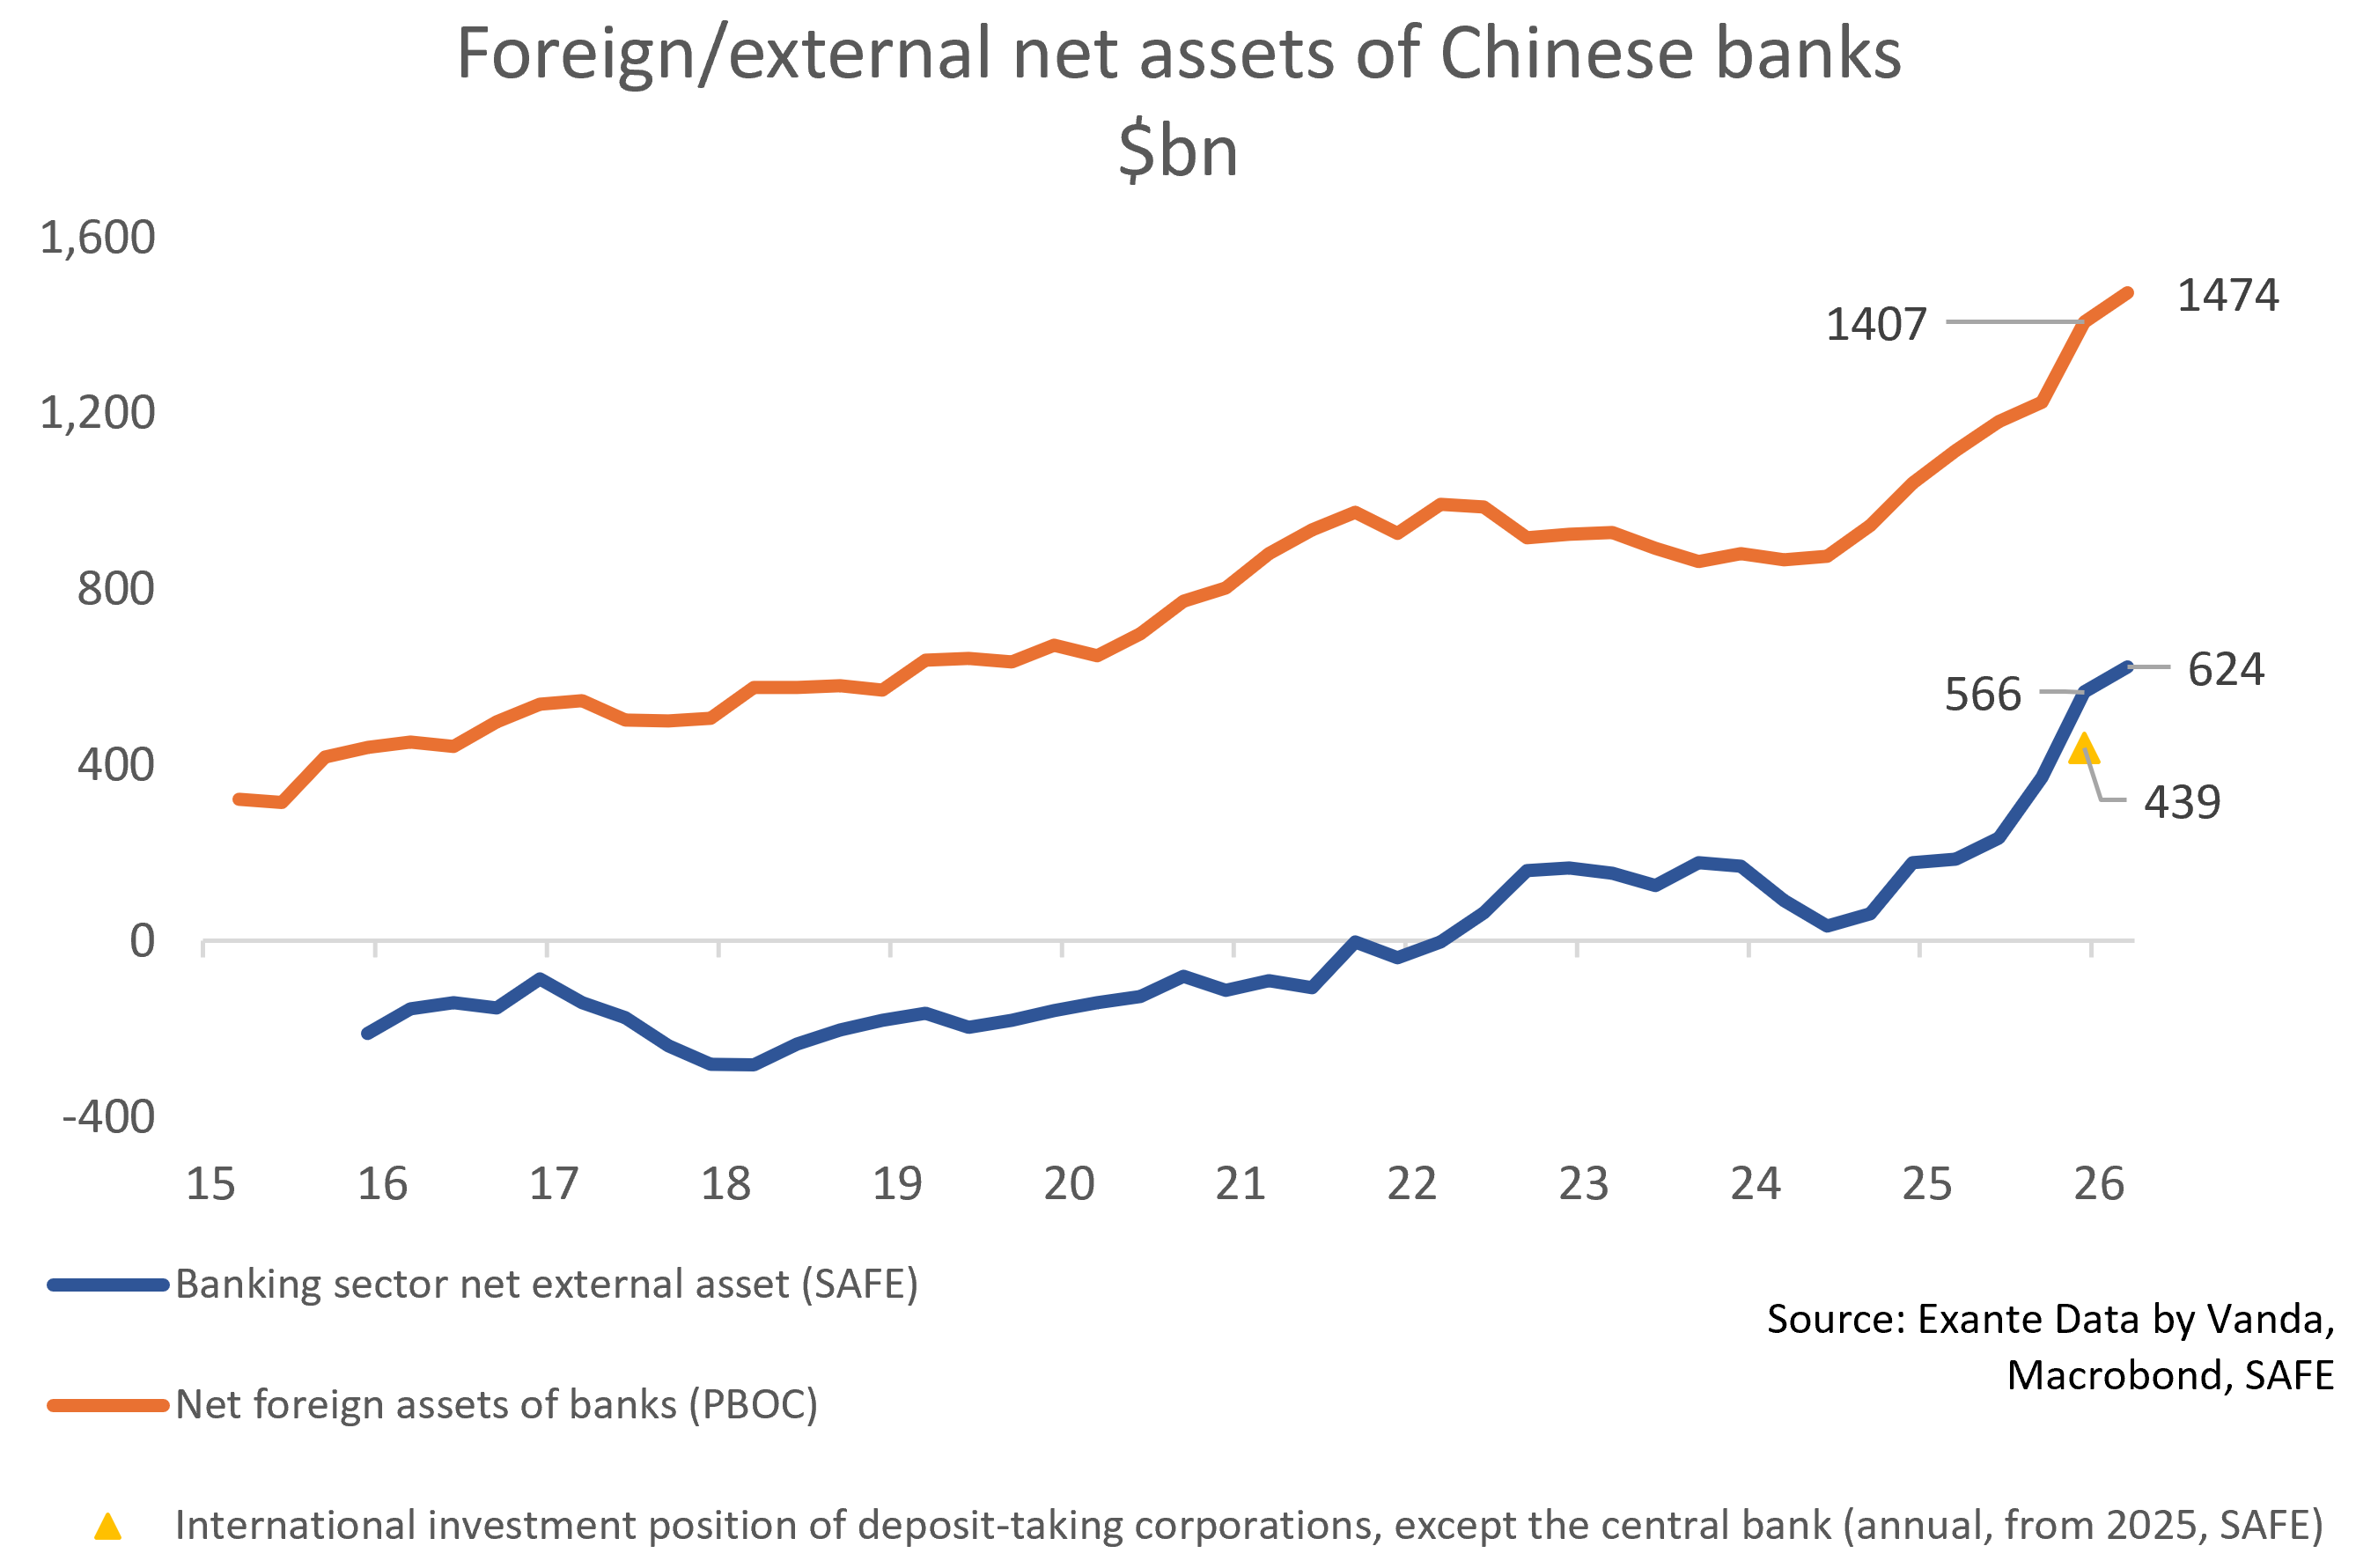
In the below chart, we compare the three different measures of Chinese banks’ external position that we introduced above. The two SAFE datasets - shown by the blue line and yellow triangle - are broadly similar in size ($566bn and $439bn by Q4-2025). But both of these metrics are less than half as large as the PBOC Monetary Survey measure ($1,407bn). The natural follow-up question is why there is such a huge divergence between the SAFE Banking Sector External Position and PBOC Monetary Survey data.
The first clue comes from looking at the asset and liability side separately. The three datasets are of a similar magnitude on the asset side (below left chart), but are wildly different when it comes to external liabilities (below right chart).
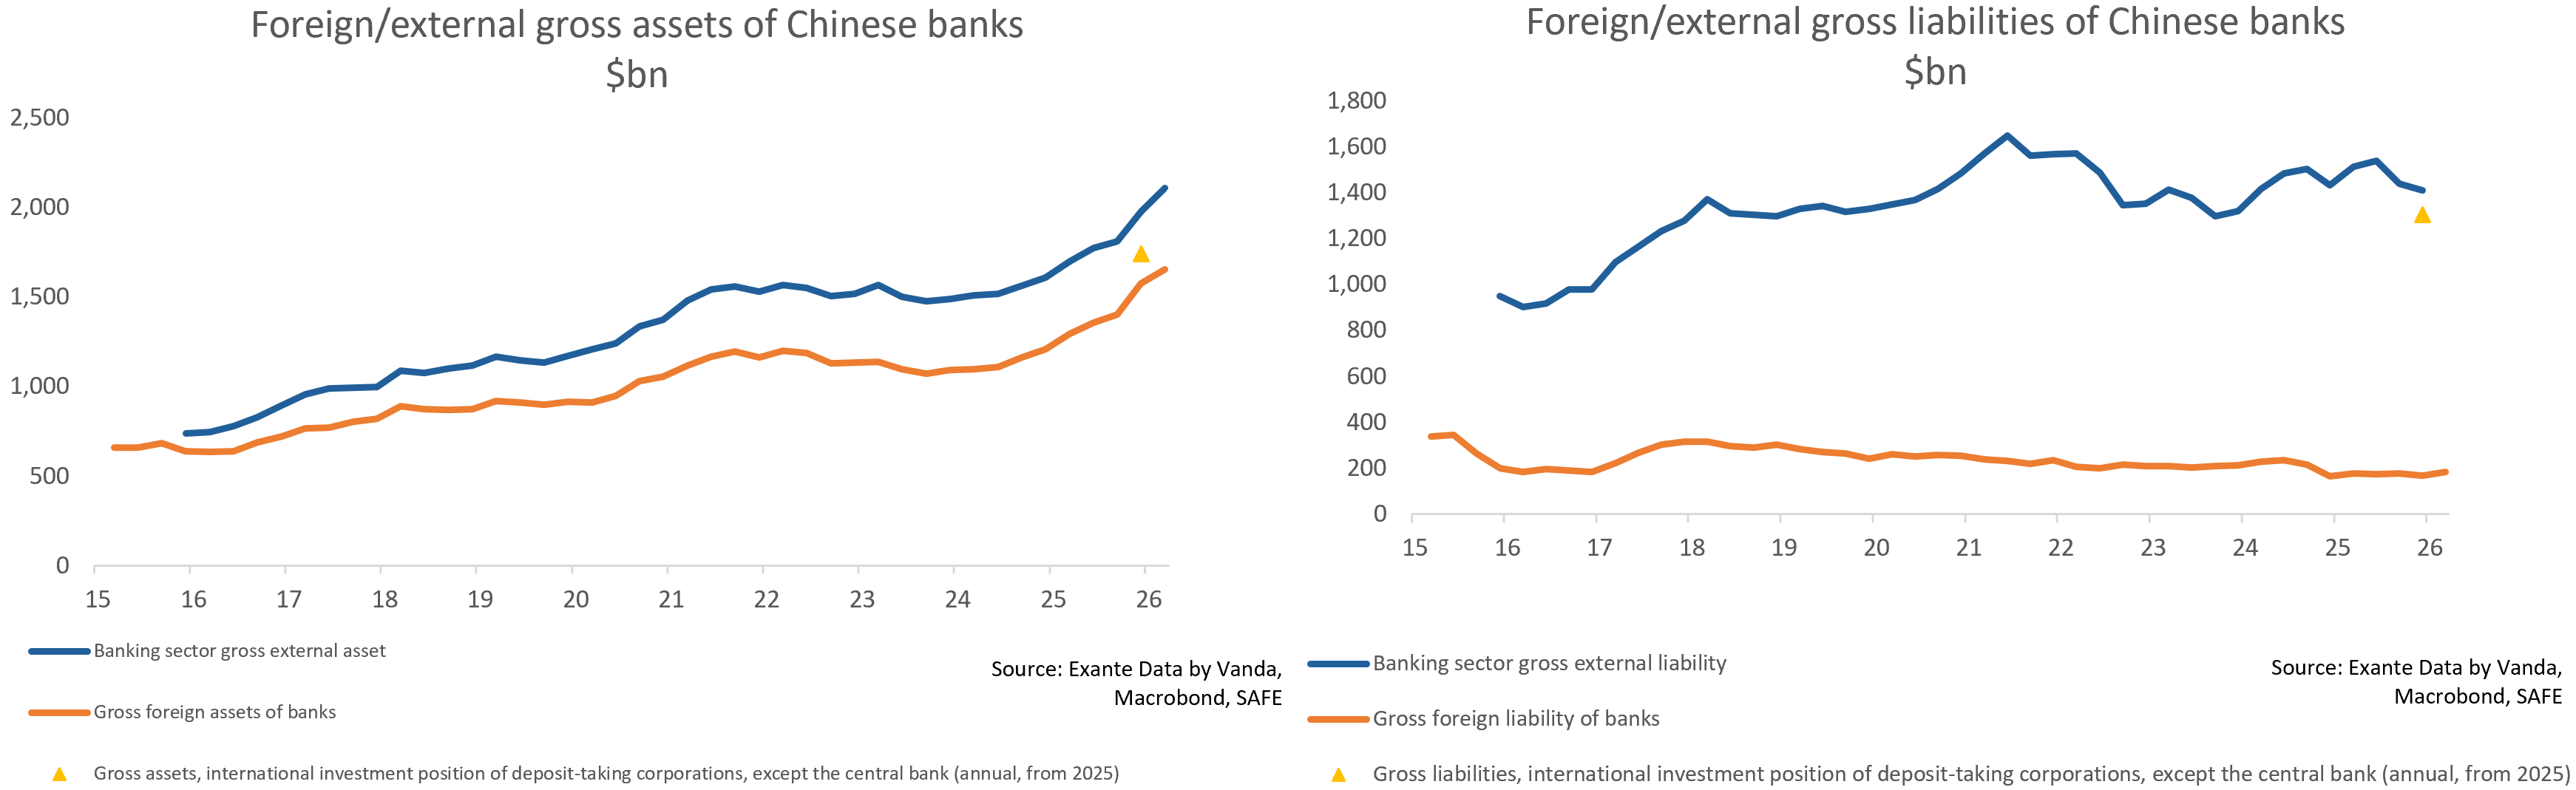
The reason is that the PBOC Monetary Survey dataset uses a wide definition for “foreign assets” but a narrow one for “foreign liabilities”. As foreign assets include a broader set of instruments than foreign liabilities, it artificially pushes up the value of “net foreign assets”.
As the PBOC Monetary Survey data doesn’t provide a detailed breakdown by instrument, we deconstruct it ourselves using another PBOC dataset (“Sources and Uses of Credit Funds of Financial Institutions”, link; we discuss this dataset in the next section). We call this data “Sources & Uses”.
More specifically, banks’ foreign assets (PBOC Monetary Survey) closely correlate with the sum of (a) Chinese banks’ overseas loans (FX and RMB) and (b) non-loan FX assets held onshore and offshore (both (a) and (b) from PBOC Sources & Uses). The inspiration for this decomposition came from multiple onshore reports, which argue that “foreign assets mainly include foreign currency cash holdings, deposits with overseas peers, interbank lending abroad, investments in overseas securities, and overseas loans” (link, link, link in Chinese).
Non-loan FX assets held onshore and offshore (component b above) will, arguably, include some non-loan FX assets that are held onshore (by Chinese residents), and that therefore shouldn’t be counted as external. This isn’t ideal, but the data is only reported as a single figure across onshore and offshore, and we would think that the majority of non-loan FX assets are indeed held overseas.
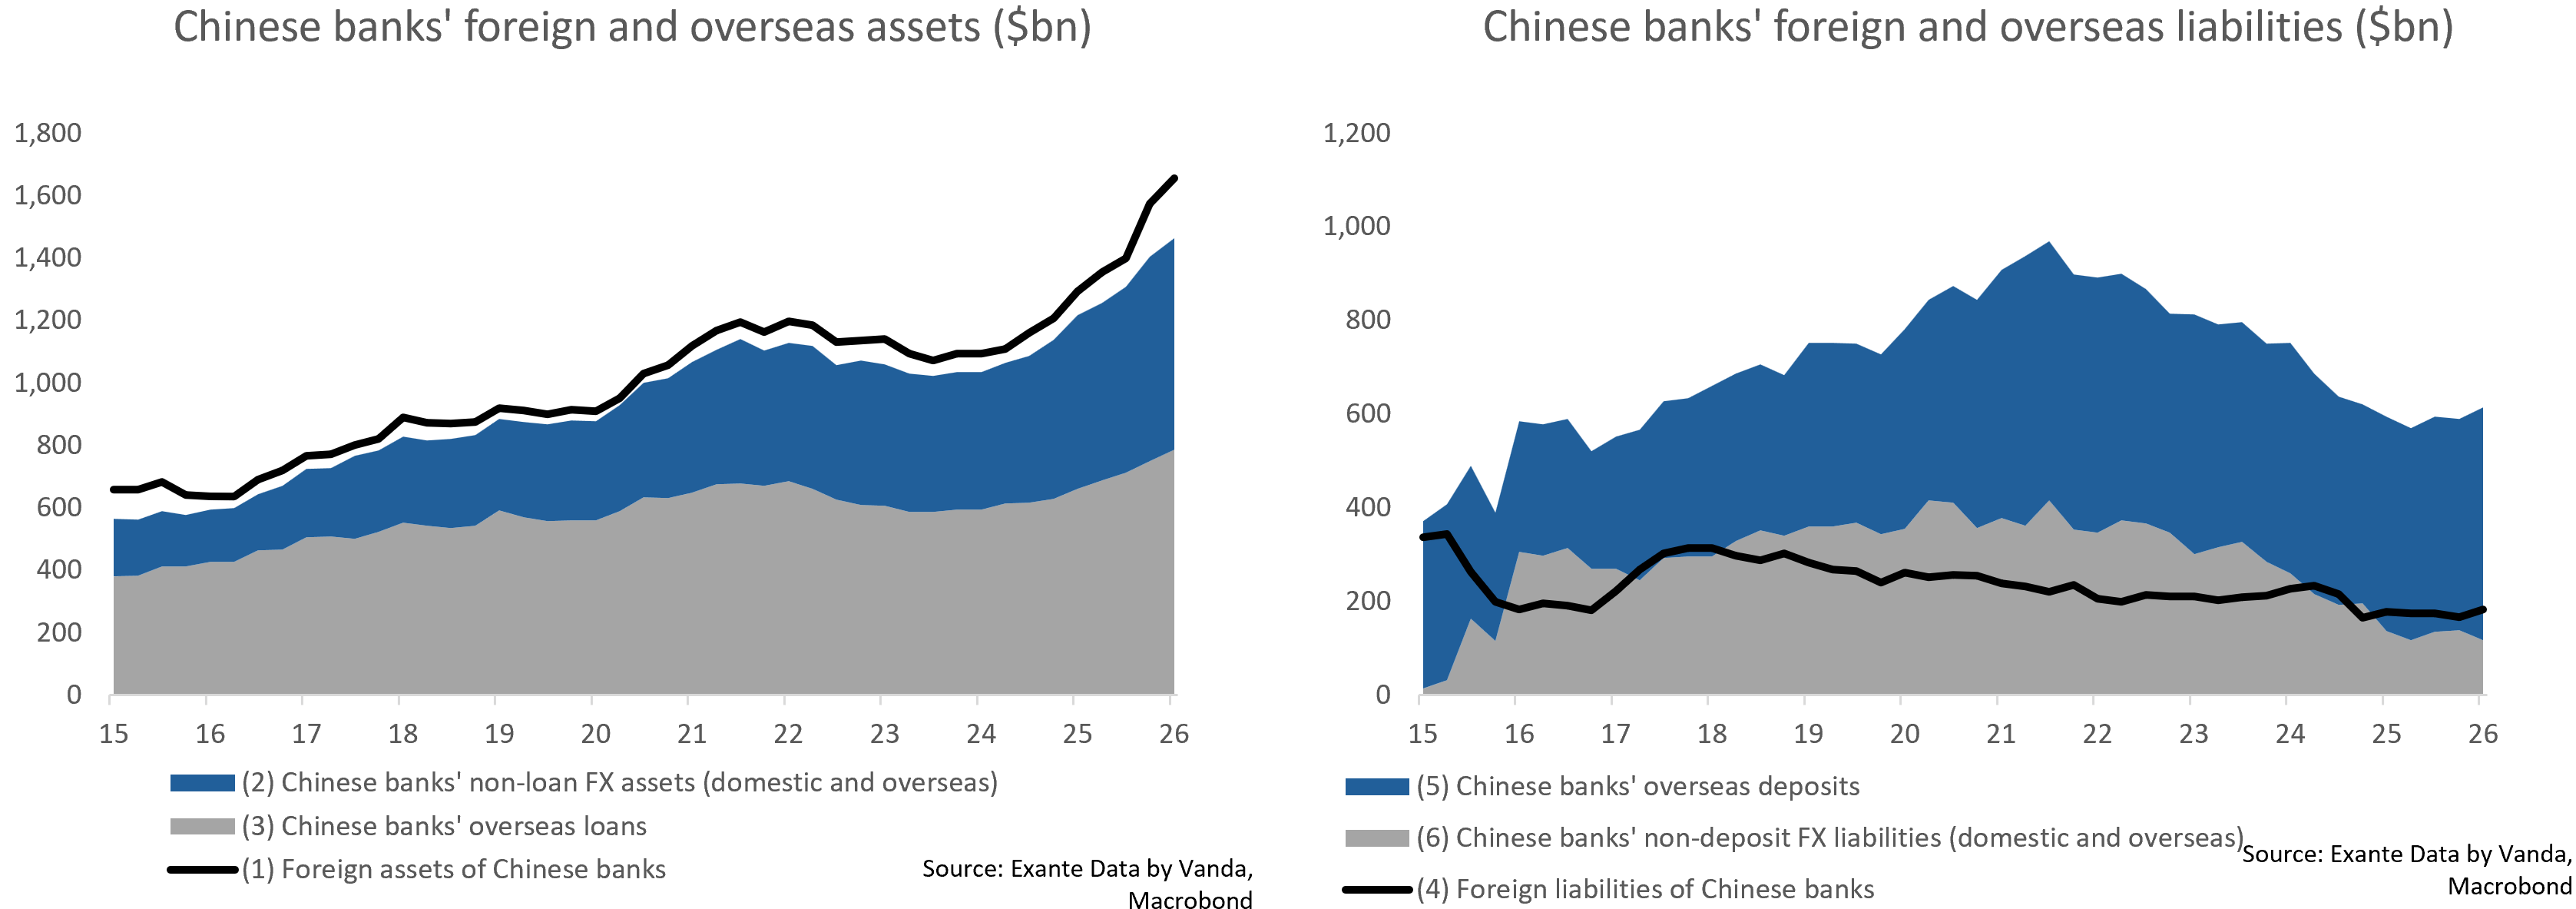
In the below left chart, we compare banks’ foreign assets to (a) and (b) above, and there is a very close correspondence. So far, so good, and the data broadly makes sense.
But there is little correspondence between banks’ foreign liabilities (PBOC Monetary Survey) and the sum of (a) overseas deposits and (b) non-deposit FX liabilities (onshore and offshore) from Sources & Uses - see the below right chart. The black line is not only much smaller than the stacked bars, but the trends are also wildly different. The clear implication is that foreign liabilities are not just a simple sum of overseas deposits and non-deposit FX liabilities.
That discrepancy is notable and suggests that the PBOC Monetary Survey captures foreign assets more comprehensively than foreign liabilities. Another explanation is that the two datasets treat the same categories (e.g., onshore non-deposit FX liabilities) differently. The divergences don’t mean that the data is “wrong” in how it is constructed, as the dataset is constructed to measure domestic monetary conditions. But it does mean that the dataset appears definitionally messy when it comes to banks’ external position: the asset vs. liability side appears to suffer from an apples-to-oranges comparison.
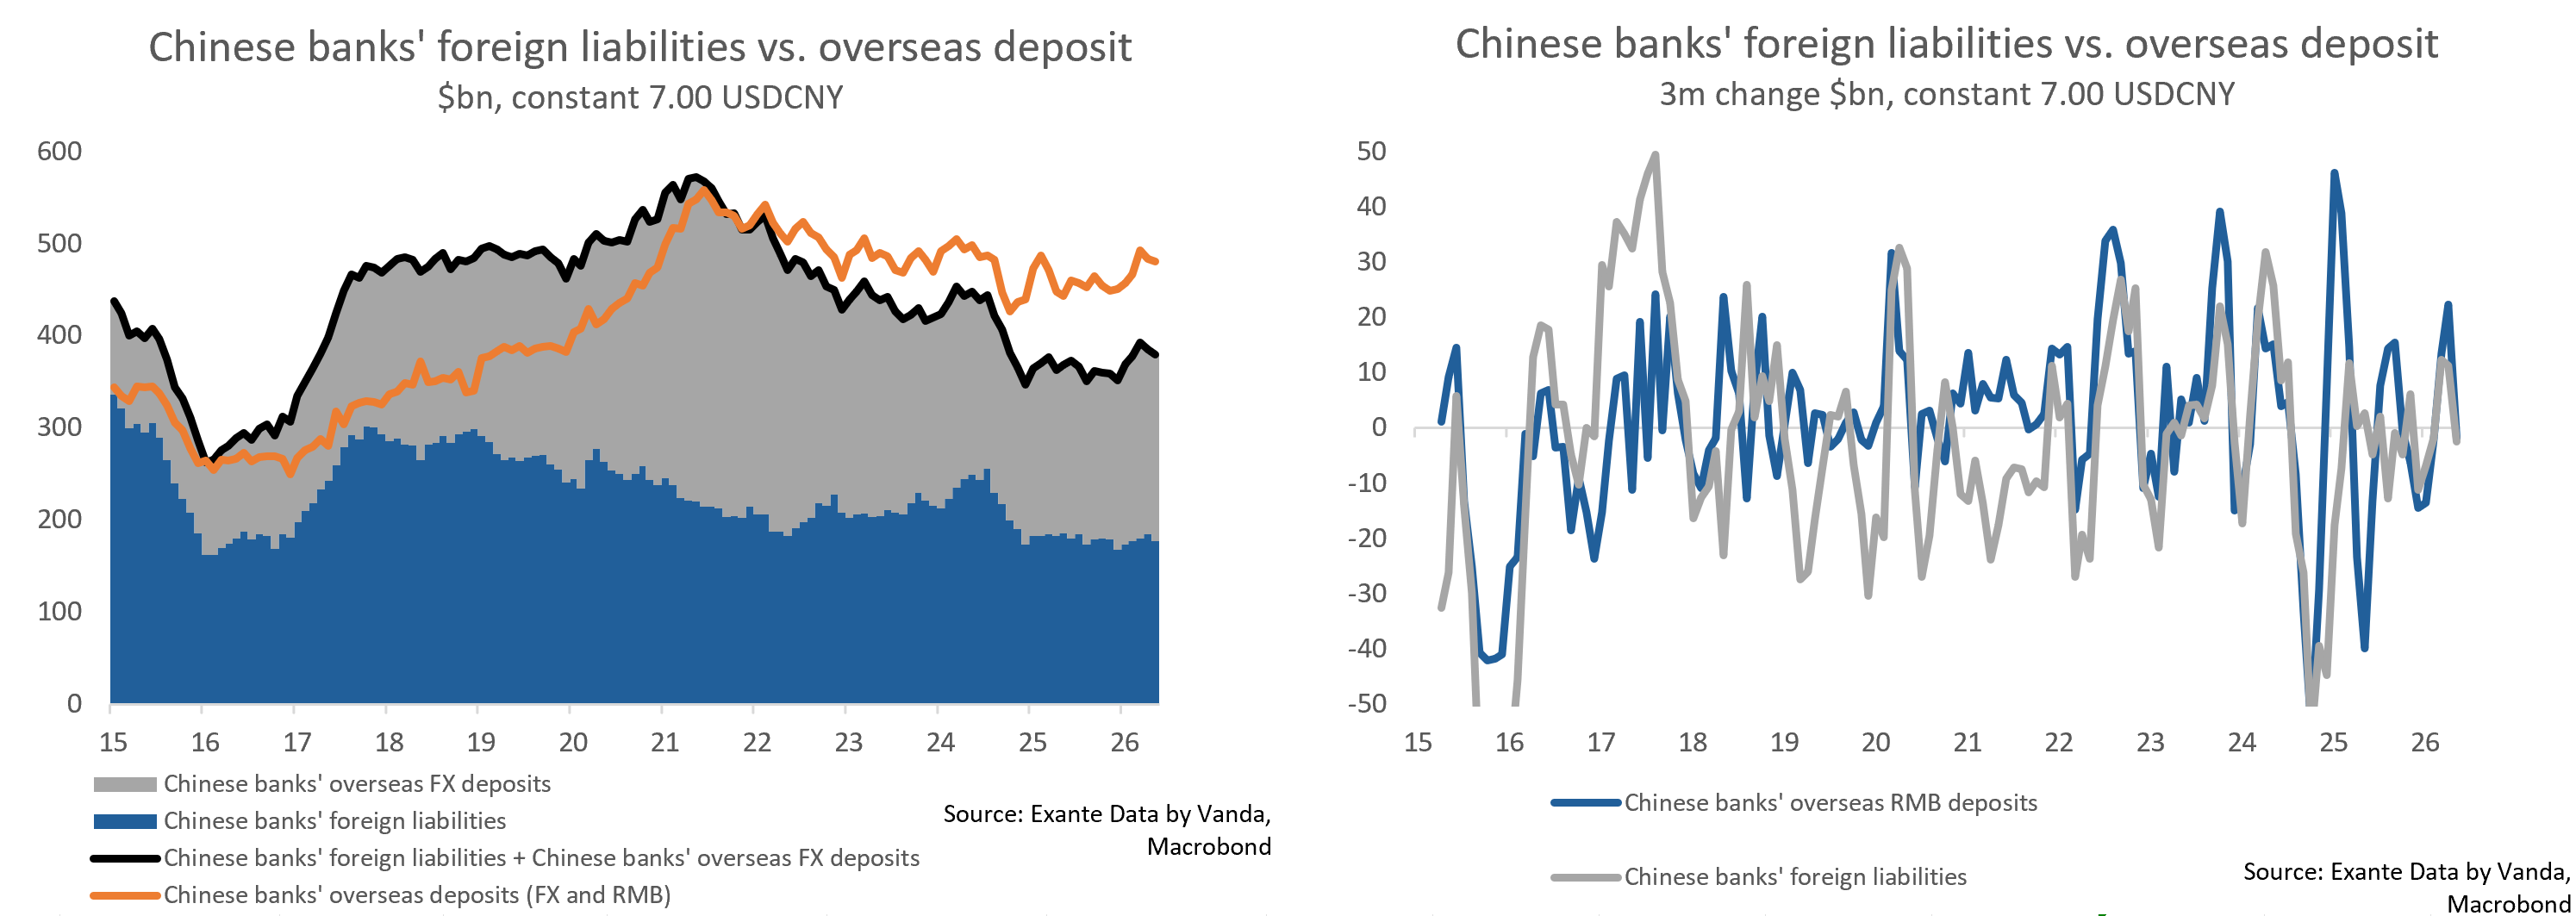
To better understand what is going on, a follow-up question is what is included in the PBOC Monetary Survey’s measure of banks’ foreign liabilities. An onshore report from Guosheng Securities argues that “foreign liabilities”, more or less, is composed of offshore RMB deposits (link in Chinese).
We find this definition puzzling, though the data suggest is could be true. In the below left chart, we sum banks’ foreign liabilities (blue area) and overseas FX deposits (grey area) and compare this to banks’ total overseas deposits (from Sources & Uses). There has indeed been a close correlation between the black and orange lines, especially since 2020, and this supports the idea that banks’ “foreign liabilities” might more or less be “offshore RMB deposits”.
In the below right chart, we look at the three-month change in banks’ foreign liabilities (PBOC Monetary Survey) vs. banks’ overseas RMB deposits (Sources & Uses). The correlation between the two series has increased markedly since 2022. This suggests that “banks’ foreign liabilities” is rather similar to “offshore RMB deposits”.
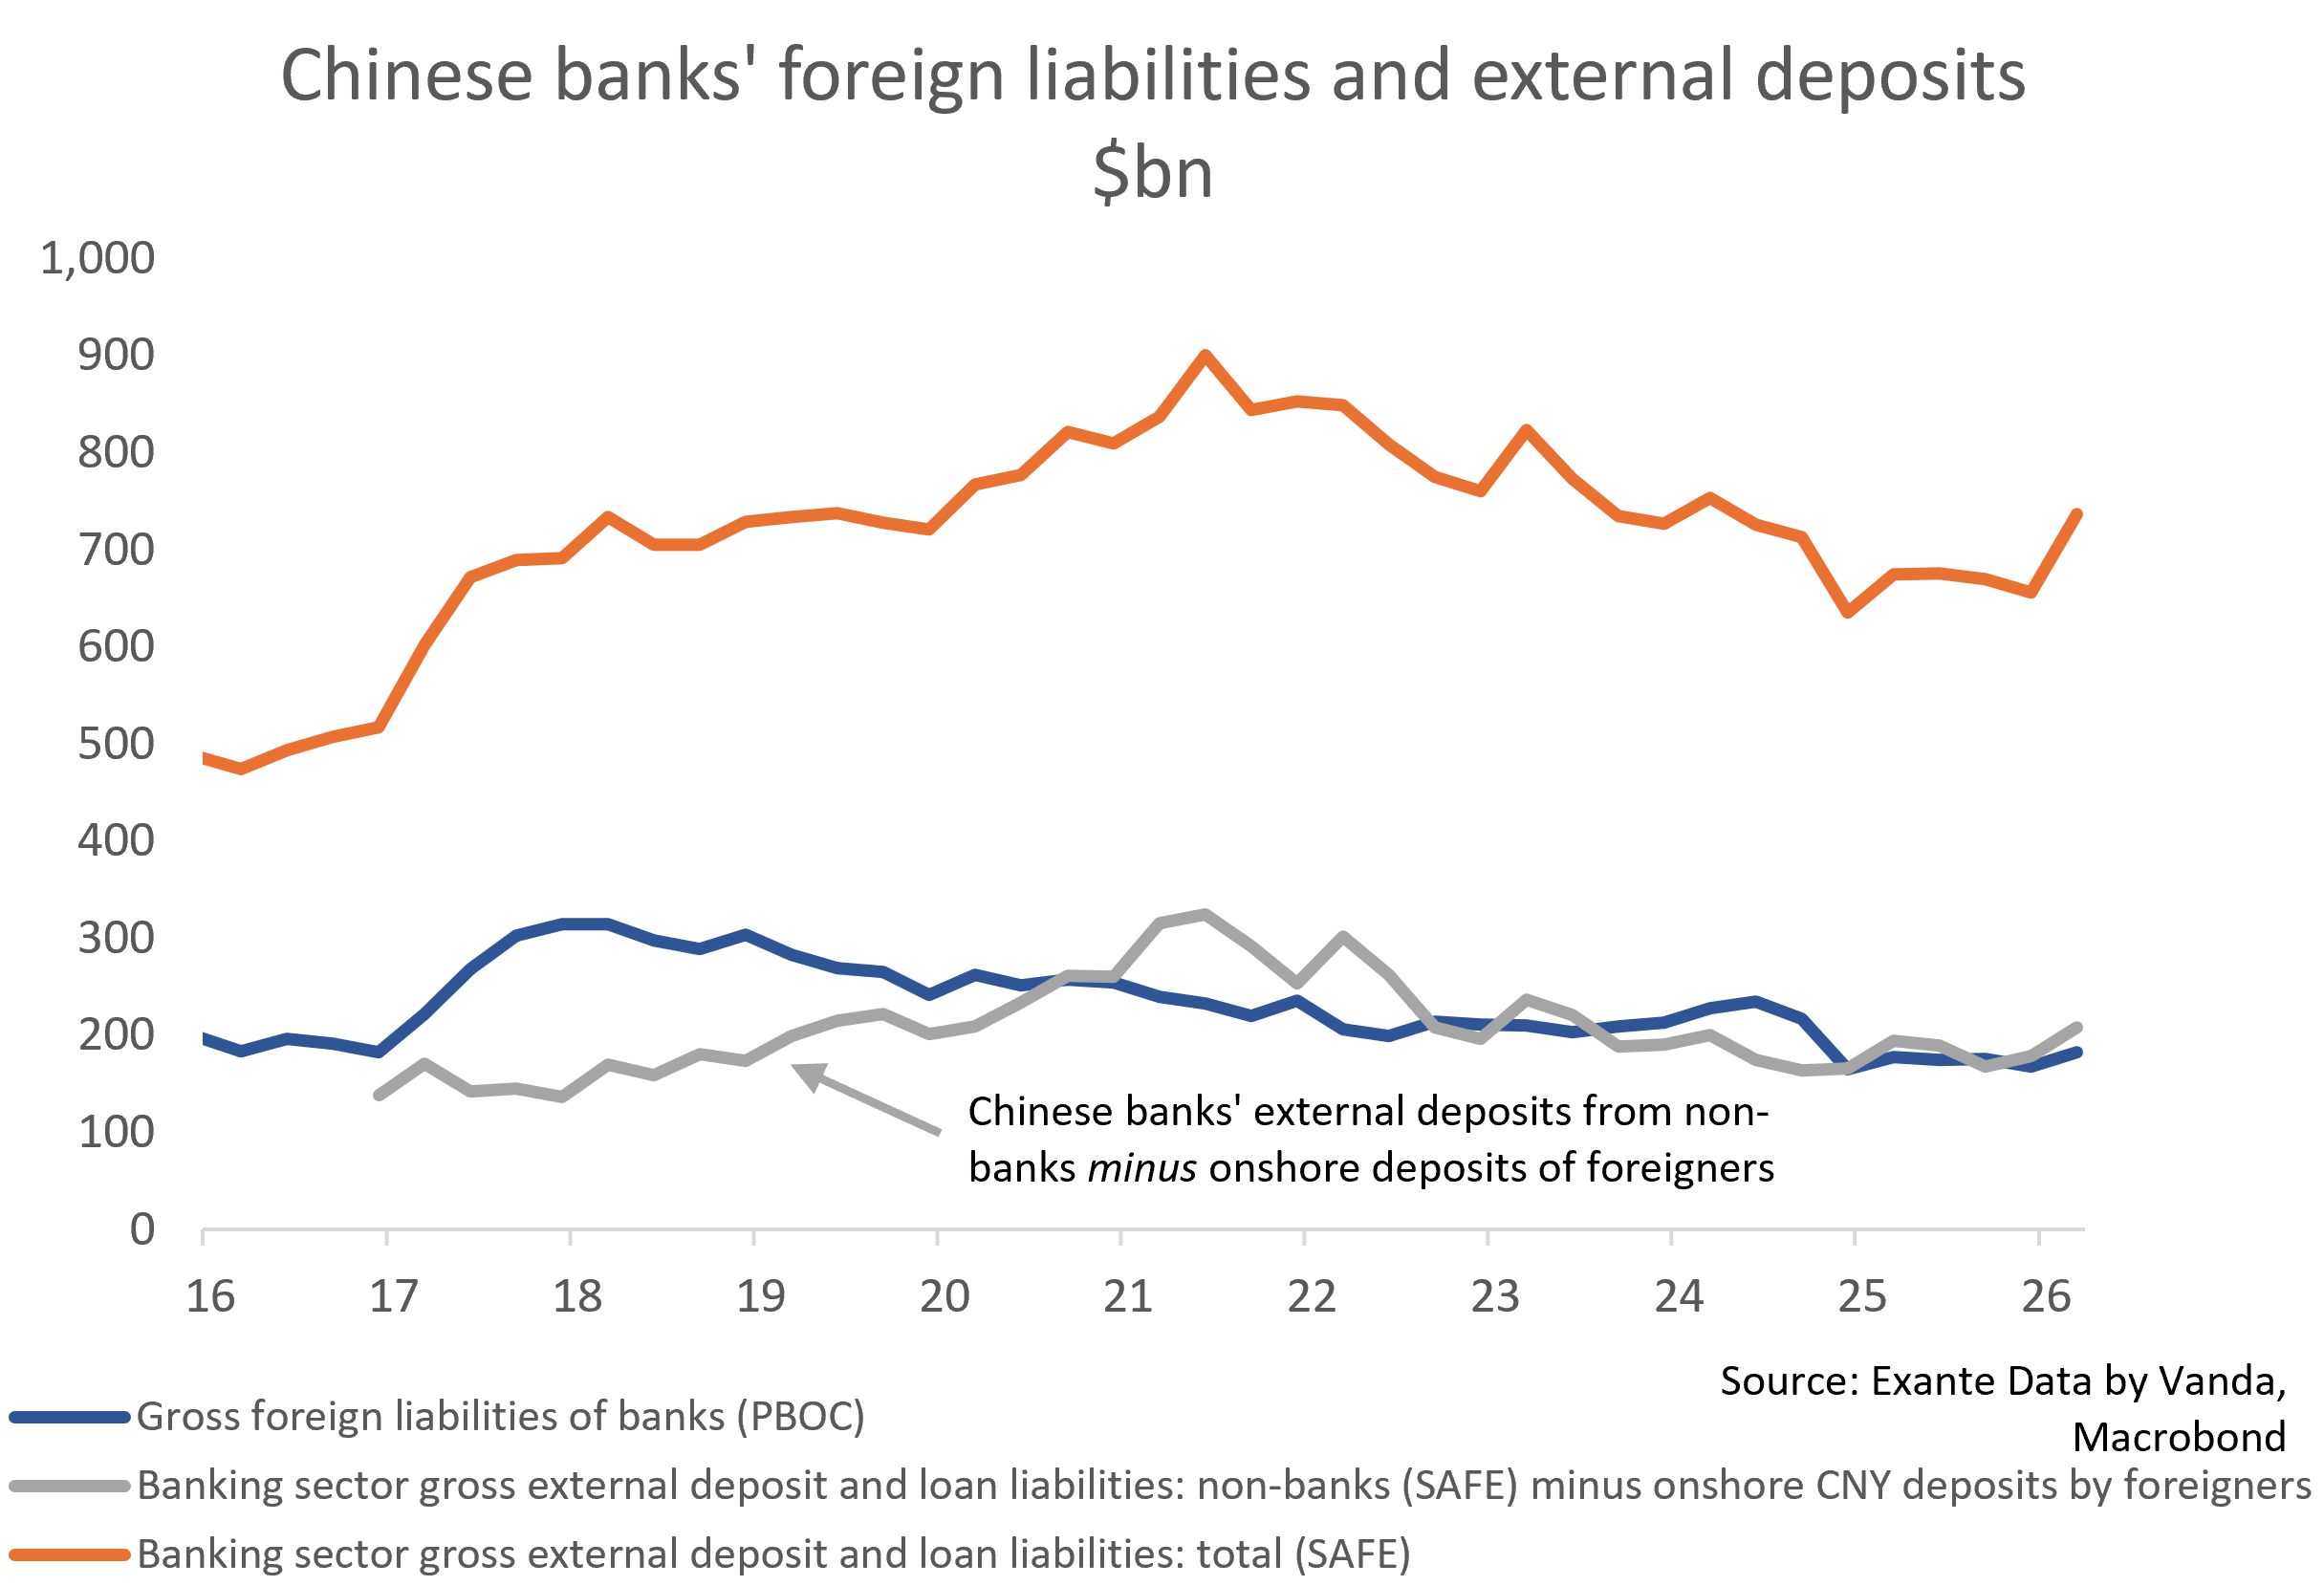
Another explanation is that banks’ foreign liabilities (PBOC Monetary Survey) exclude a) deposits by other banks and b) onshore deposits by non-residents. The orange line in the below chart shows the total external deposit liabilities of China’s banking system (SAFE Banking Sector External Position). If we look at only non-banks and furthermore subtract onshore deposits by non-residents, the resulting figure (grey line) is very similar to banks’ foreign liabilities (dark blue line). An example of onshore deposits by non-residents would be a Singaporean company depositing funds directly with an onshore Chinese bank from its Singapore office.
This could suggest that banks’ foreign liabilities (PBOC Monetary Survey) excludes a) deposits by banks and b) deposits by foreigners, even if it would be preferable for both to be be included when getting a sense of BoP-basis bank positions.
We have speculated whether offshore RMB deposits by Chinese residents might play a role in some of the dynamics we have identified in this note. If the Shanghai office of a Chinese company, for example, deposits RMB with the Hong Kong branch of a mainland bank, that might possibly be counted as a foreign or overseas RMB deposit by the PBOC, even though it should not be counted by SAFE (Banking Sector External Position) as it is a transaction between two Chinese residents. The exclusion of offshore resident deposits would, if anything, therefore lower the BoP-basis external liabilities, which is the opposite of the “problem” we have identified (namely, that foreign liabilities in the PBOC Monetary Survey are much smaller than in the SAFE data).
Dataset 4: Sources and Uses
In the previous section, we used a fourth dataset, the PBOC’s “Sources and Uses of Credit Funds of Financial Institutions” (link), to deconstruct banks’ foreign assets and foreign liabilities.
This dataset is built from the same “raw data” as the PBOC Monetary Survey. But the “Sources and Uses” data provides a different “cut” of the same data, and is perhaps slightly more useful for analyzing banks’ external position as it is more detailed. This dataset doesn’t follow IMF principles like the PBOC Monetary Survey and SAFE Banking Sector External Position dataset; it was created to monitor credit allocation during a period when credit in China was more administratively directed.
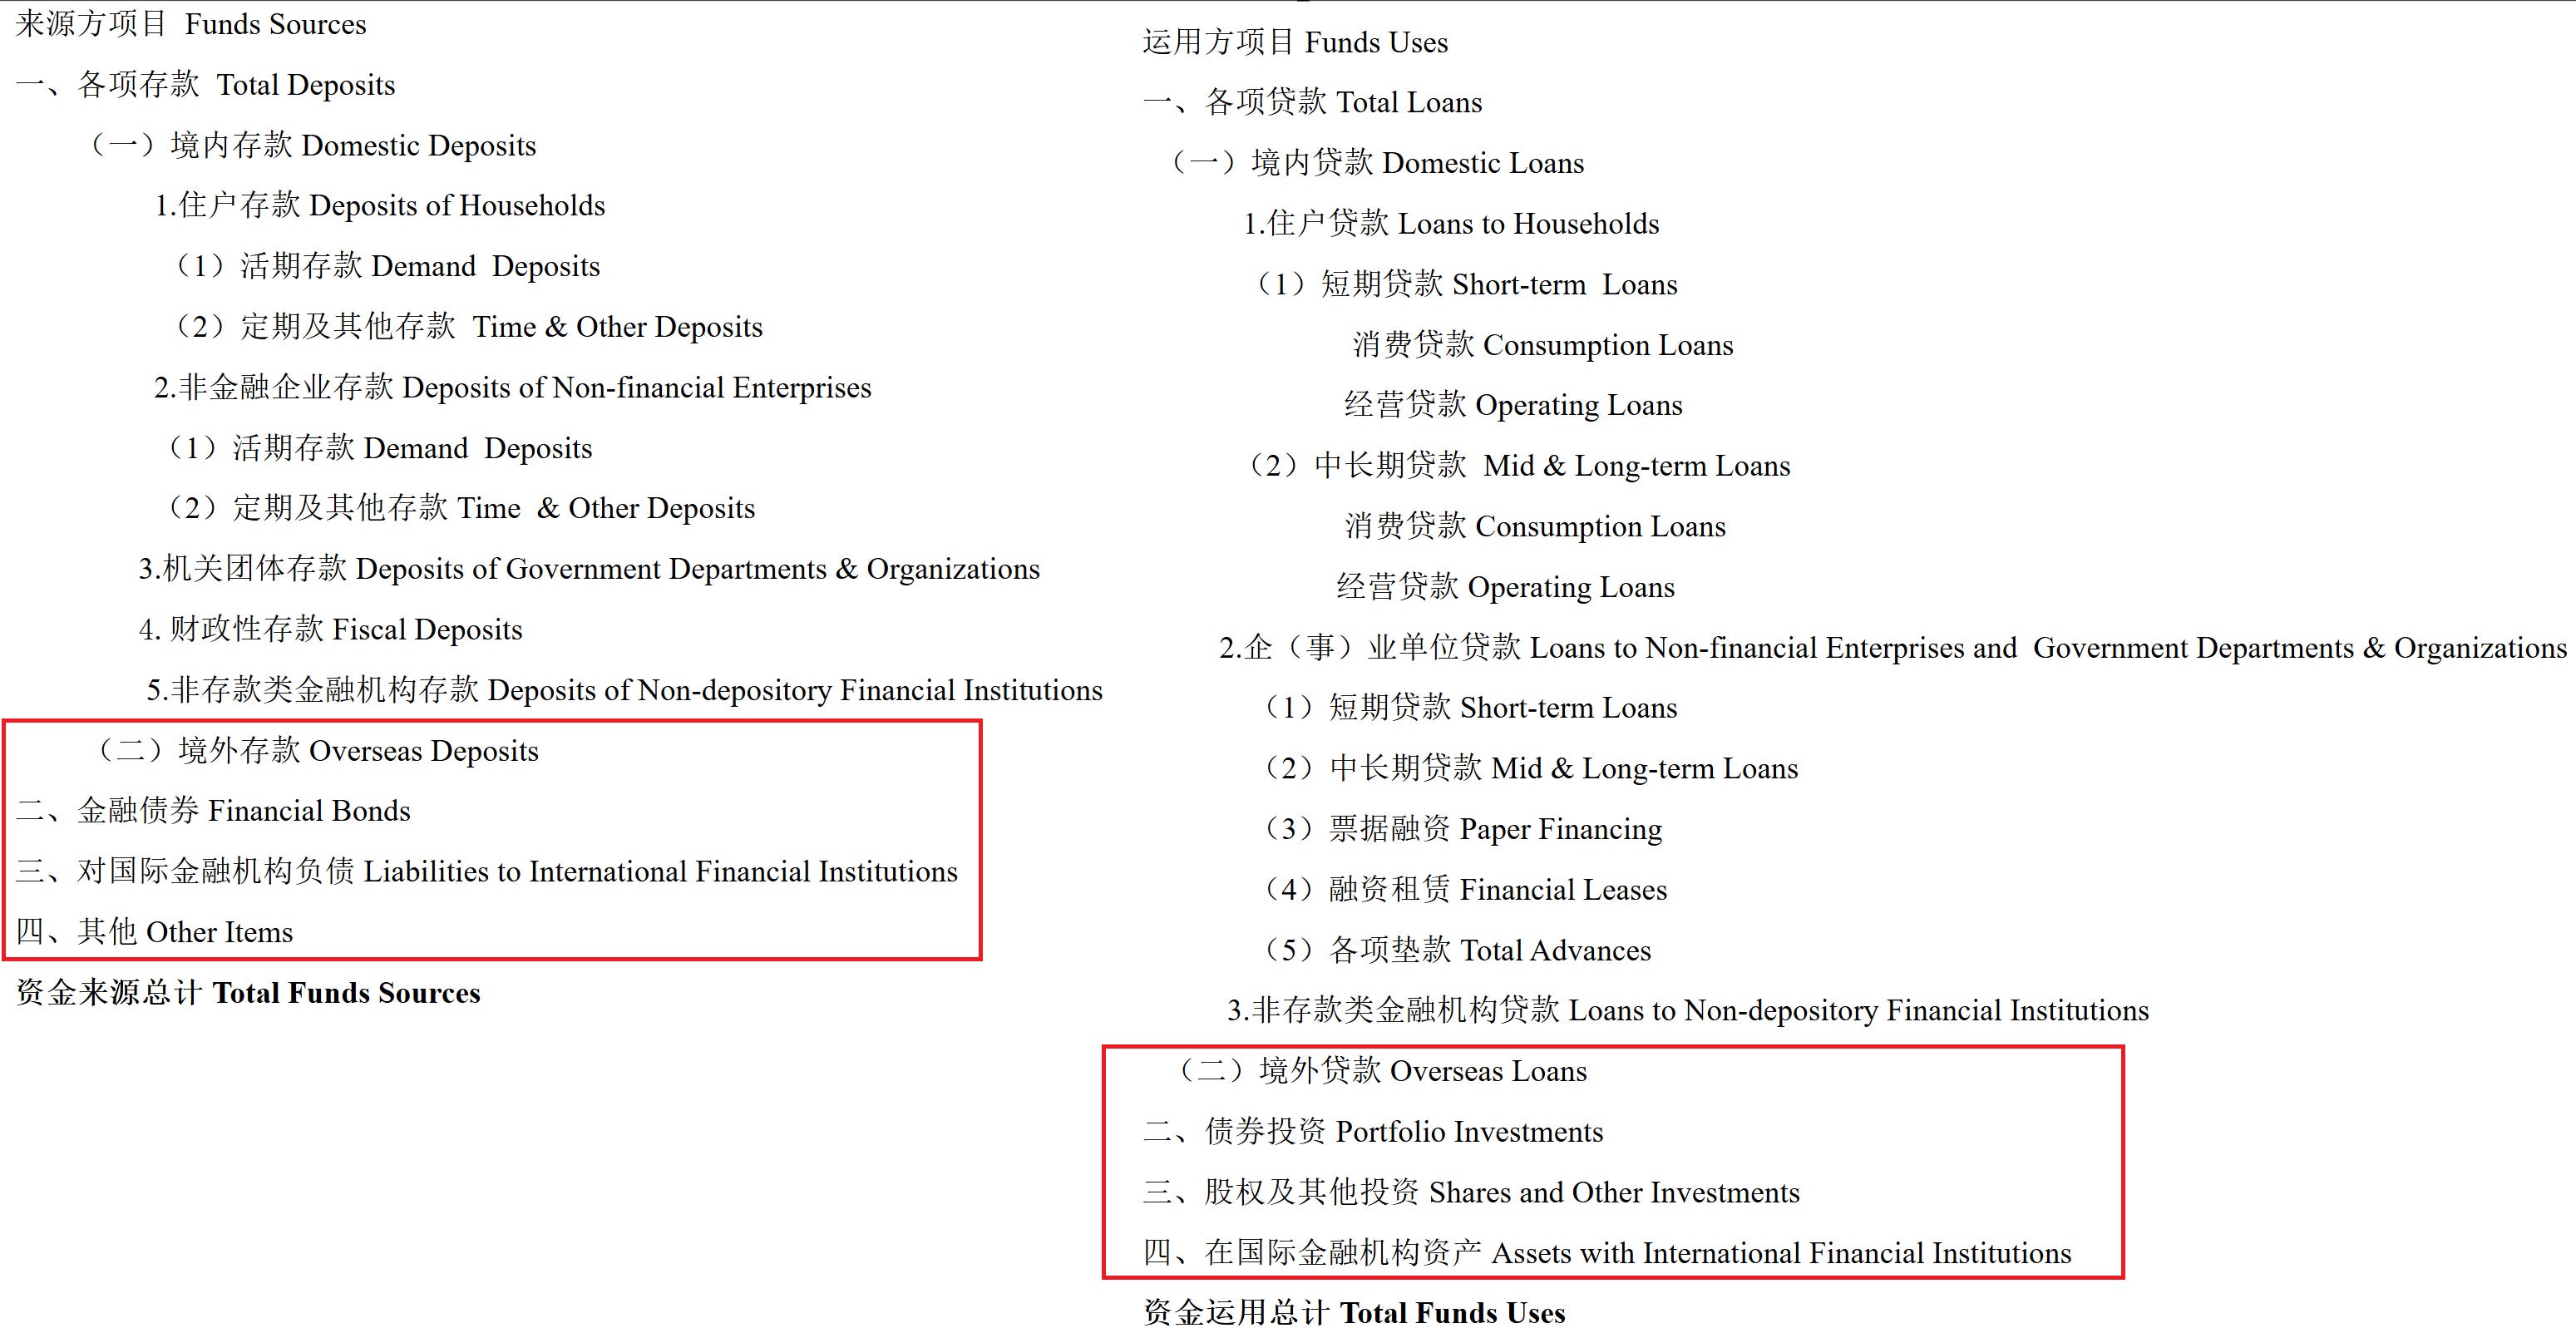
This dataset can also be used to construct a rough monthly proxy for the quarterly SAFE Banking Sector External Position data. We do this for loan assets, non-loan assets, deposit liabilities and non-deposit liabilities.
When we deconstructed banks’ foreign liabilities (PBOC Monetary Survey) earlier in the note, we used overseas deposits (FX and RMB) as well as non-deposit FX liabilities from the Sources and Uses data. Non-deposit FX liabilities include financial bonds (or bonds issued by banks), liabilities to international financial institutions and other items.
And to decompose banks’ foreign assets, we used overseas loans (FX and RMB) and non-loan FX assets. Non-loan FX assets include bond investments (called “portfolio investments”, though this is poorly translated from 债券投资), shares and other investments and assets with international financial institutions.
On both the asset side (“Funds Uses”) and liability side (“Funds Sources”), the data on non-deposit FX liabilities and non-loan FX assets is reported as a total across domestic and foreign counterparties. That is, like we mentioned earlier, not ideal, and means that we are unable to tell which portion of, for example, ‘FX repo liabilities’ is owed to Chinese residents vs. foreigners. But as we only look at FX-denominated categories, we would think the bulk of these positions are vis-à-vis non-residents.
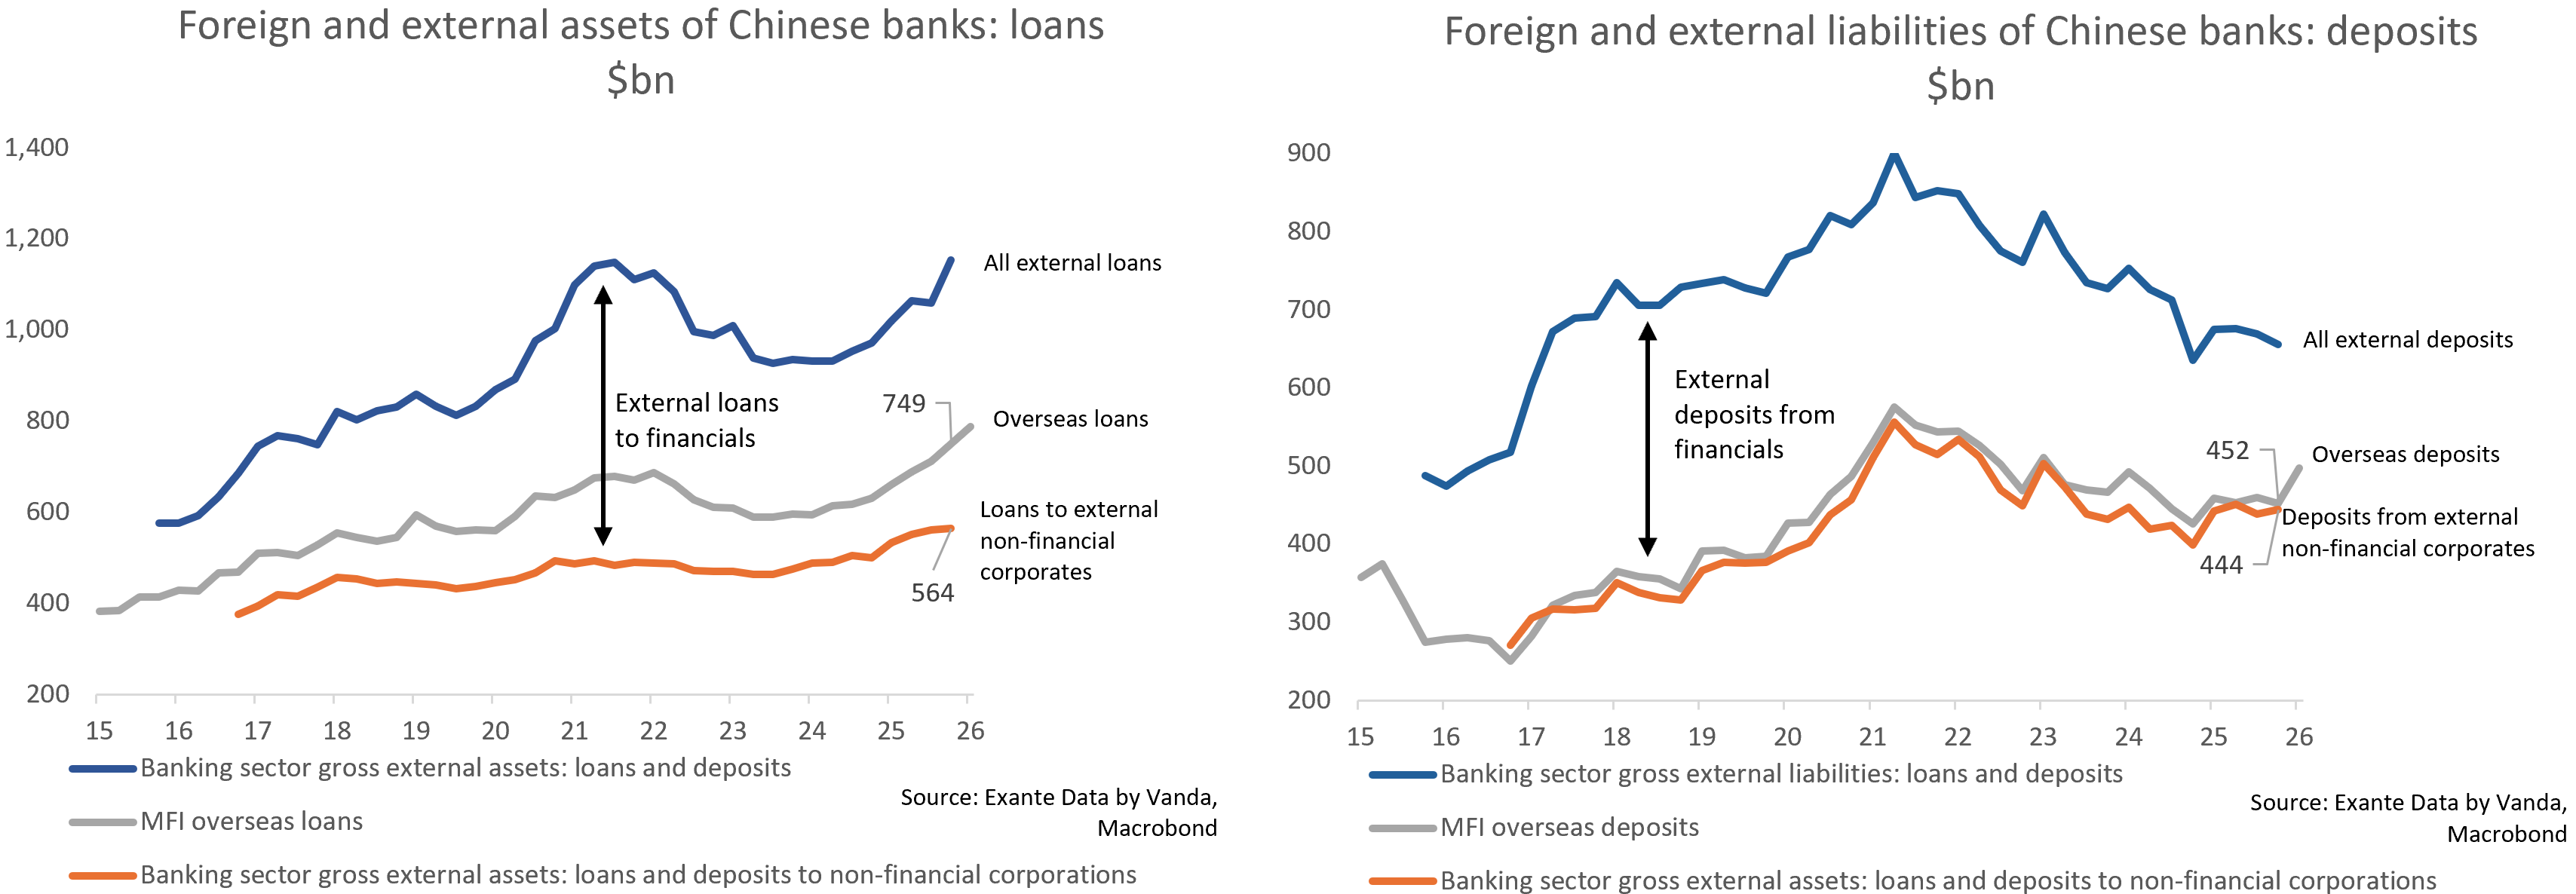
We first check how closely the Sources and Uses data track the SAFE data for loans and deposits. The thing that stands out in the below charts is that the Sources and Uses data track SAFE-basis loans to/deposits from corporates quite well (grey vs. orange lines). This also means that the Sources and Uses data likely exclude positions against financial institutions, which means the monthly tracking won’t capture this.
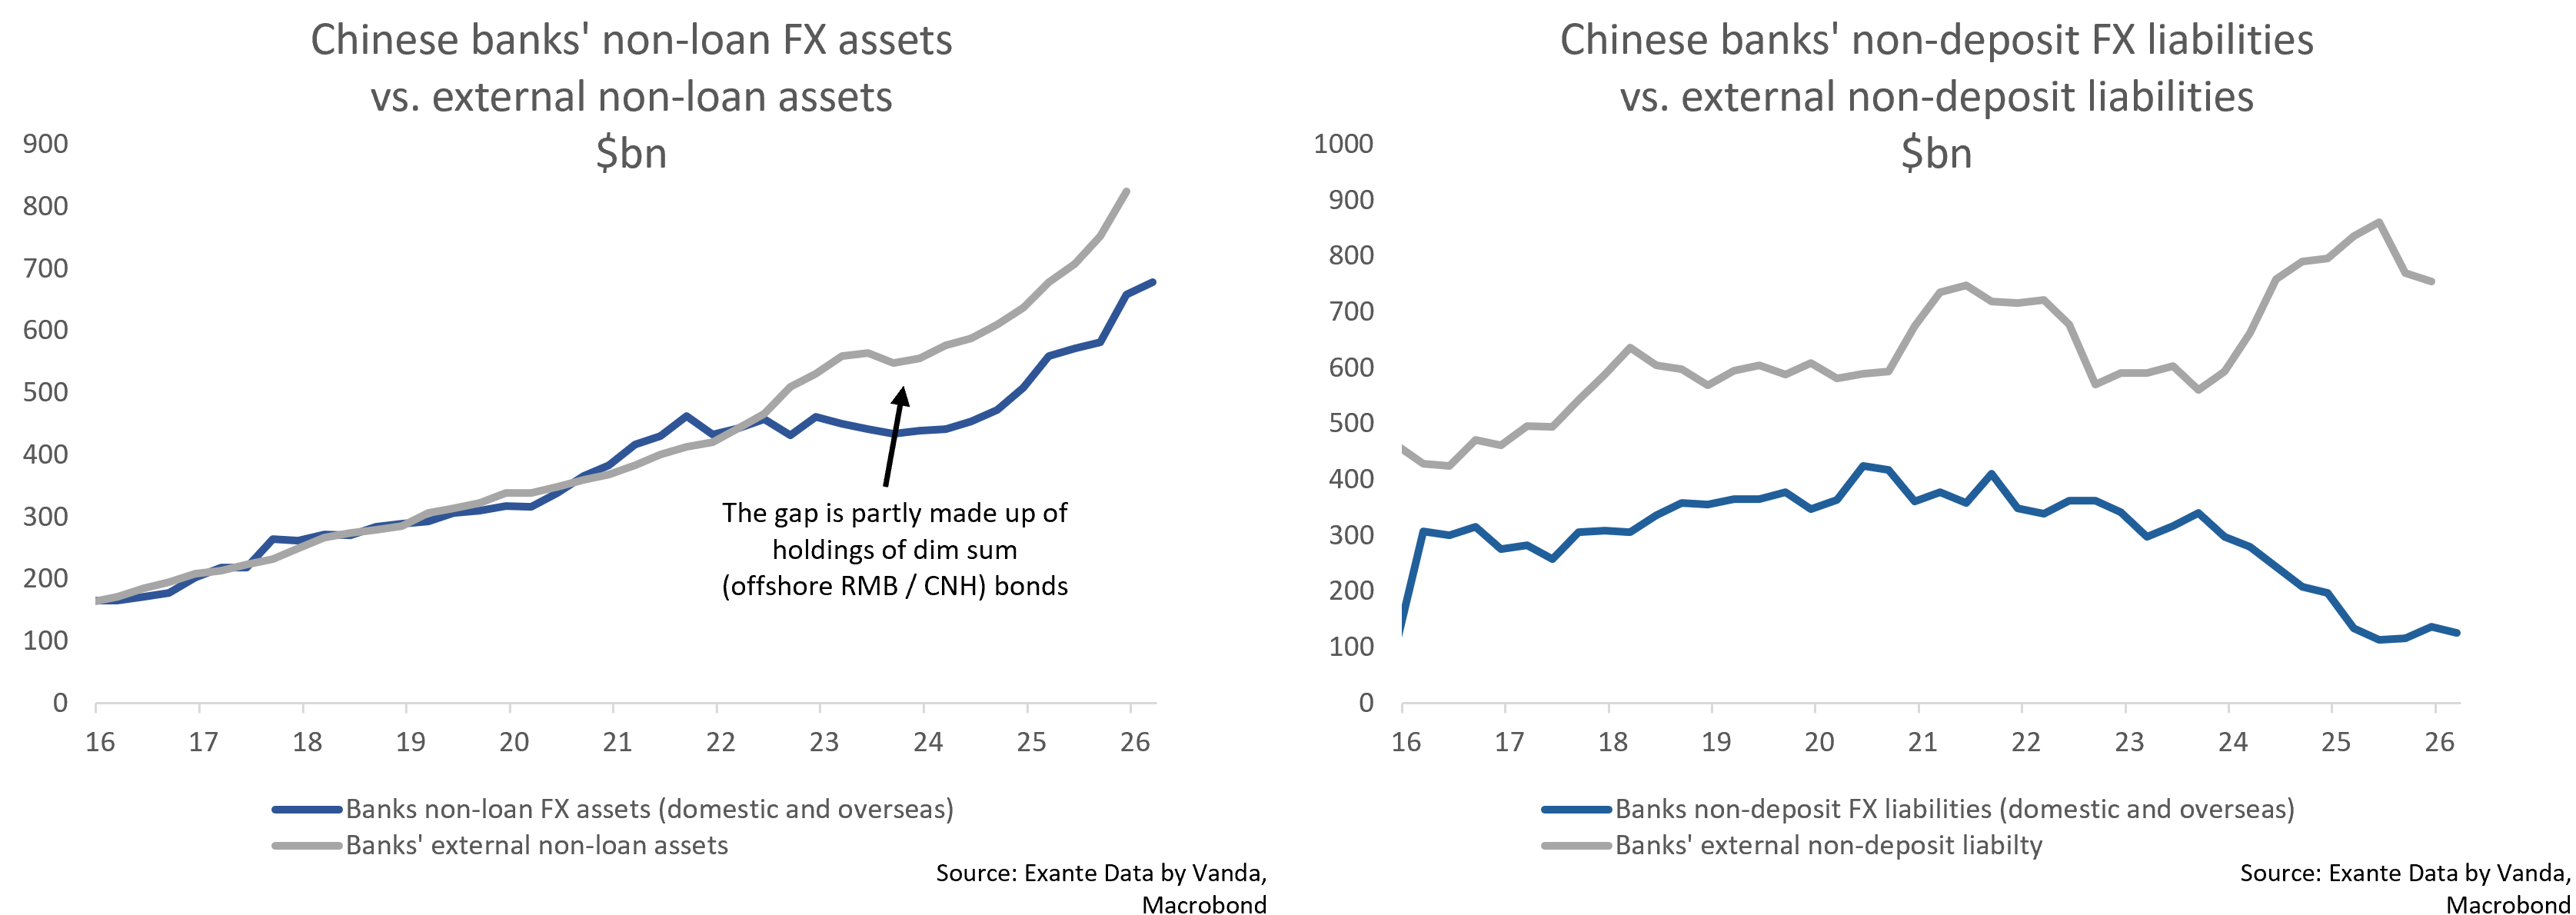
Banks’ non-loan FX assets (PBOC Sources & Uses) also line up relatively well with banks’ external non-loan assets (SAFE Banking Sector External Position), as we show in the below left chart. But the divergence is more notable on the liability side (see below right chart).
As the data exclude the deposits of financial institutions, like we showed in the right chart above, it is possible that the data also exclude non-deposit FX liabilities of financial institutions. The SAFE data, but perhaps not the Sources & Uses data, captures foreign holdings of bank equities, and we also speculate whether external/overseas RMB activity could play a role.
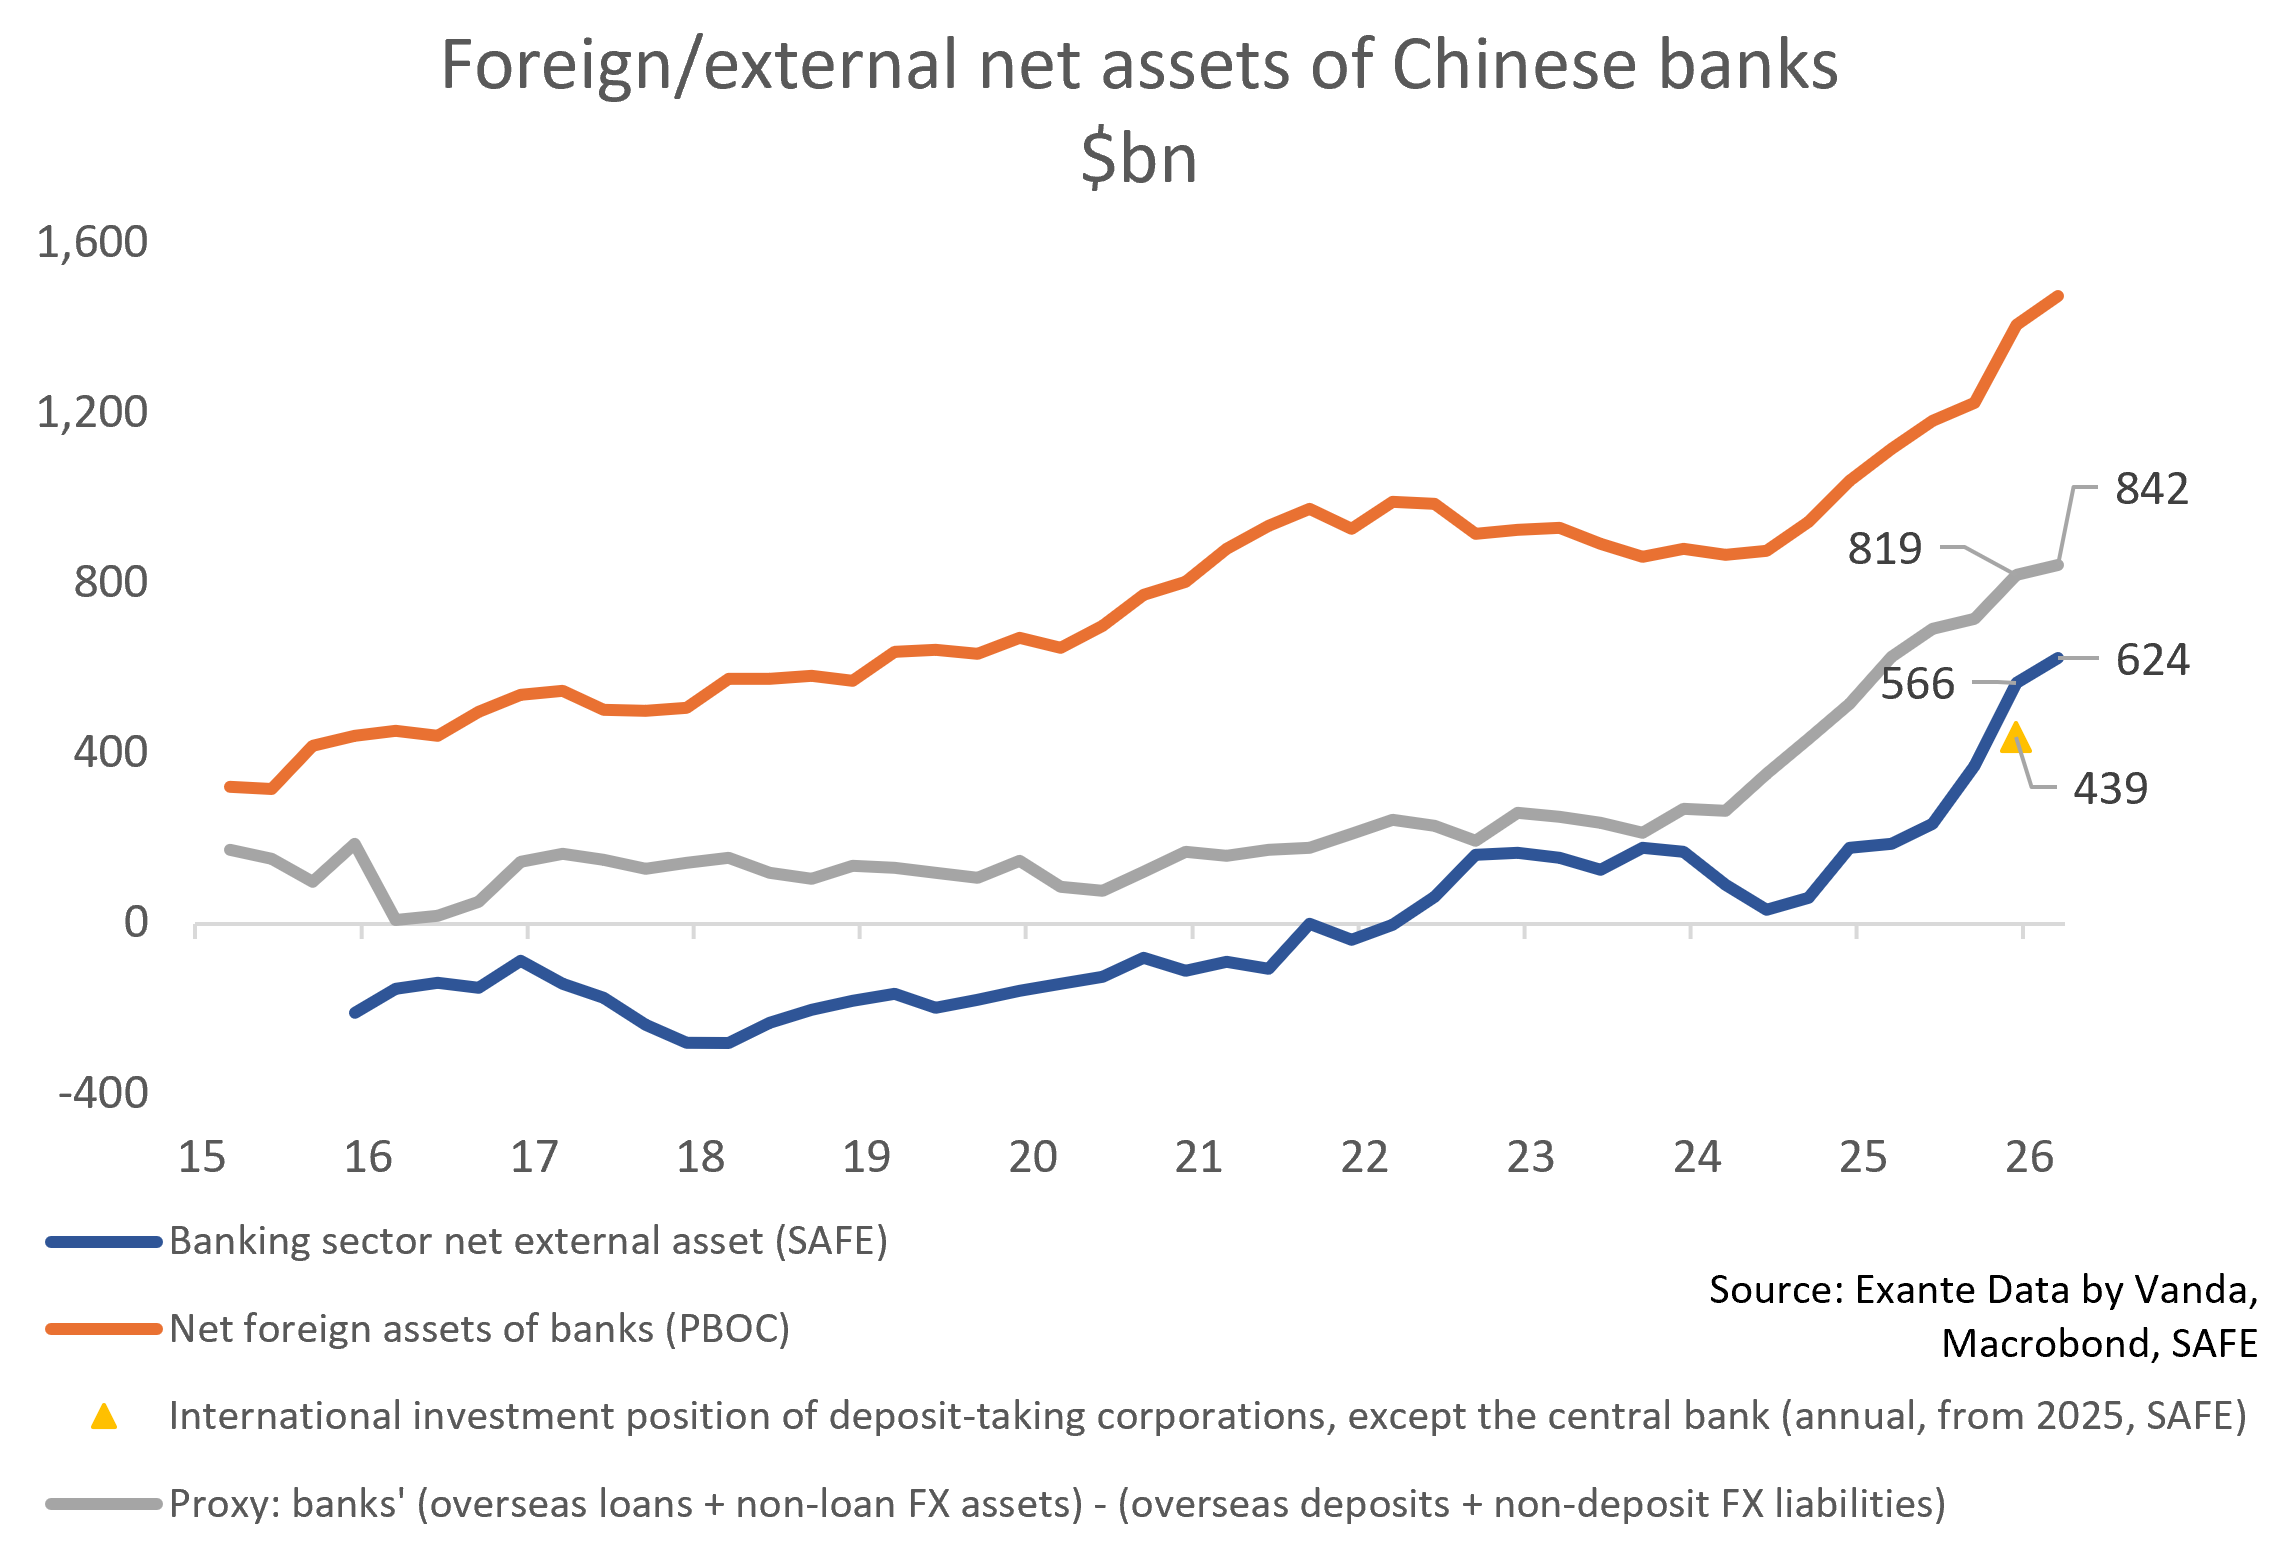
The grey line in the chart below shows a proxy of “net external asset” that adds up the different categories. We define it as: overseas loans (FX and RMB) + non-loan FX assets (domestic and overseas) - overseas deposits (FX and RMB) - non-deposit FX liabilities (domestic and overseas).
The correlation between our proxy (grey line) and the actual net external assets (SAFE Banking Sector External Position, dark blue line) is far from perfect, though the magnitude is somewhat similar. For the purposes of tracking the banking sector’s net external assets on a monthly basis, our proxy might be preferable to the data from the PBOC Monetary Survey (the orange line below).
At the same time, if we look solely at quarterly changes in the three series, then the PBOC Monetary Survey data correlates more closely with the SAFE data than does our proxy. This means that PBOC Monetary Survey data can also be used as a monthly proxy of changes in (though not to levels of) the external net assets of the Chinese banking system.
Where does it leave us? What is the conclusion?
The idea of this note is to deepen our understanding of the different ways to measure Chinese banks’ financial links with the rest of the world.
We have found that banks’ net foreign assets (PBOC Monetary Survey) appear to overstate the level of banks’ external net assets, and that SAFE’s dataset (SAFE Banking Sector External Position) appear better suited for BoP-type analysis of Chinese banks.
The reason why external net assets are lower in the SAFE vs. PBOC data comes mainly from the liability side. External liabilities have been broadly stable in both sources, though the level of external liabilities reported by SAFE is several times larger than that implied by the PBOC data. The reason is that the PBOC data appear to use a narrow definition of external liabilities.
The SAFE data is quarterly, however, and we can use another PBOC dataset (Sources & Uses) to get a rough/proxy read on a monthly basis. The PBOC Monetary Survey can, even if it’s misleading in level terms, also serve as a good monthly guide to changes in the SAFE data.
What is consistent across the datasets is that: 1) banks’ net external assets are increasing rapidly; and 2) external liabilities are broadly flat. The fact that this holds across multiple different datasets should increase our confidence in this conclusion.
More broadly, the surge in banks’ net external assets is the flip side of China’s large trade surplus. The large trade surplus therefore ‘forces’ China to accumulate foreign assets — in practice, mostly dollar assets — which increases China’s theoretical vulnerability to US financial sanctions. RMB settlement can reduce the dollar leg of this recycling, though it does not remove the underlying need to recycle export earnings.
Finally, in the absence of official statistical guides, this note should be read as a set of carefully developed hypotheses rather than definitive conclusions. We have tried to triangulate the data rigorously, but alternative interpretations may exist, and we welcome comments and alternative explanations from readers.
The content in this piece is partly based on proprietary analysis that Exante Data does for institutional clients as part of its full macro strategy and flow analytics services. The content offered here differs significantly from Exante Data’s full service and is less technical as it aims to provide a more medium-term policy relevant perspective. The opinions and analytics expressed in this piece are those of the author alone and may not be those of Exante Data Inc. or Exante Advisors LLC. The content of this piece and the opinions expressed herein are independent of any work Exante Data Inc. or Exante Advisors LLC does and communicates to its clients.
Exante Advisors, LLC & Exante Data, Inc. Disclaimer
Exante Data delivers proprietary data and innovative analytics to investors globally. The vision of exante data is to improve markets strategy via new technologies. We provide reasoned answers to the most difficult markets questions, before the consensus.
This communication is provided for your informational purposes only. In making any investment decision, you must rely on your own examination of the securities and the terms of the offering. The contents of this communication does not constitute legal, tax, investment or other advice, or a recommendation to purchase or sell any particular security. Exante Advisors, LLC, Exante Data, Inc. and their affiliates (together, “Exante”) do not warrant that information provided herein is correct, accurate, timely, error-free, or otherwise reliable. EXANTE HEREBY DISCLAIMS ANY WARRANTIES, EXPRESS OR IMPLIED.
Exante Data is a trading name of Vanda Research Limited which is an appointed representative of Messels Limited which is authorised and regulated by the Financial Conduct Authority.
No posts
Comments
Nothing yet. Say the first thing.
Sign in to join the conversation.